


Prevention of gestational diabetes mellitus (GDM) is a key intervention to circumvent the maternal and fetal consequences of this disease. The primary method of preventing GDM is by lifestyle changes, such as physical activity and diet( Reference Donazar-Ezcurra, López-Del Burgo and Bes-Rastrollo 1 ). One important modifiable risk factor is vitamin D deficiency among pregnant women. Vitamin D deficiency is considered highly prevalent worldwide and often persists during pregnancy( Reference Holick, Binkley and Bischoff-Ferrari 2 , Reference Wei, Qi and Luo 3 ). Studies have suggested that low concentrations of vitamin D may be associated with alterations in glucose metabolism( Reference Amegah, Klevor and Wagner 4 ), can be a risk factor for GDM( Reference Lau, Gunton and Athayde 5 – Reference Bener, Al-Hamaq and Saleh 7 ) and are characterised by glucose intolerance or glycaemia values higher than the normal range when detected during pregnancy( 8 ).
One possible mechanism by which vitamin D may act on glucose metabolism is by increasing adiponectin secretion( Reference Dinca, Serban and Sahebkar 9 , Reference Karras, Polyzos and Newton 10 ). This adipokine has insulin-sensitisation properties of the target cells (liver, skeletal muscle and adipose tissue) and can enhance glucose uptake in muscle tissue( Reference Rosen and Spiegelman 11 – Reference Rühl and Landrier 13 ). Adiponectin also protects β-cells from immune attack and reduces insulin resistance through immunoregulatory and anti-inflammatory effects( Reference Rosen and Spiegelman 11 – Reference Sung, Liao and Lu 14 ). In pregnant women, concentrations of adiponectin have been inversely associated with adverse maternal outcomes, such as GDM( Reference Xu, Zhao and Chen 15 , Reference Retnakaran and Retnakaran 16 ), overweight and obesity( Reference Ianniello, Quagliozzi and Caruso 17 ). During pregnancy, a reduction in maternal plasma adiponectin concentrations is expected( Reference Mazaki-Tovi, Romero and Kusanovic 18 , Reference Nien, Mazaki-Tovi and Romero 19 ). Many factors can influence the expression of this adipokine. Vitamin D concentration is one example( Reference Rühl and Landrier 13 , Reference Vaidya, Forman and Underwood 20 ), as it down-regulates pro-inflammatory cytokines and up-regulates anti-inflammatory cytokines. Vitamin D appears to be positively associated with adiponectin gene expression and suppresses the renin–angiotensin–aldosterone system (RAAS) components secreted by adipocytes, thus contributing to increased adiponectin secretion( Reference Vaidya, Forman and Underwood 20 – Reference Forman, Williams and Fisher 22 ). Low 25-hydroxyvitamin D (25(OH)D) concentrations may then reduce the secretion of adiponectin and could be considered a risk factor for GDM and insulin resistance( Reference Rühl and Landrier 13 , Reference Pala, Ozalp and Yener 23 , Reference Mohammadi and Paknahad 24 ).
Leptin is a hormone that regulates lipid metabolism and inflammation by influencing glucose metabolism in an inverse manner to adiponectin, that is, it reduces insulin sensitivity( Reference Li, Wang and Miao 25 ). Leptin is directly associated with pre-eclampsia, GDM and macrosomia( Reference Song, Gao and Qu 26 , Reference Fatima, Alam and Chaudhry 27 ). Studies have shown an inverse association between vitamin D and leptin concentrations( Reference Menendez, Lage and Peino 28 – Reference Karonova, Belyaeva and Jude 30 ). The mechanism by which vitamin D metabolites impact leptin levels remains unclear. One possible mechanism is that the fat solubility of vitamin D can cause it to be sequestered in fat tissues, leading to a high level of intracellular Ca that increases lipogenesis and decreases lipolysis( Reference Hajimohammadi, Shab-Bidar and Neyestani 31 ). A lower serum vitamin D may lead to a higher serum leptin, since its concentration is related to greater body fat mass( Reference Considine, Sinha and Heiman 32 , Reference Fatima, Farooq and Tauni 33 ). However, randomised clinical trials have found no association between vitamin D supplementation and changes in leptin concentrations( Reference Hajimohammadi, Shab-Bidar and Neyestani 31 , Reference Dinca, Serban and Sahebkar 34 ).
There are few studies evaluating the association between vitamin D status, glycaemia and adipokines during pregnancy, particularly among healthy pregnant women without comorbidities such as GDM( Reference Hajimohammadi, Shab-Bidar and Neyestani 31 , Reference Mousa, Abell and Shorakae 35 , Reference Pratumvinit, Wongkrajang and Wataganara 36 ). The aim of this study was to evaluate the vitamin D status of pregnant women in the first trimester and, if variation in vitamin D status during pregnancy was associated with changes in adiponectin, leptin and glycaemia concentrations throughout pregnancy among a cohort of healthy Brazilian women.
Methods
Study design
This study consists of a prospective cohort with healthy pregnant adult women from a public health care centre in Rio de Janeiro, Brazil, carried out from November 2009 to October 2011.
A total of 299 women were invited to participate in the study in accordance with the following eligibility criteria: (a) being between 5 and 13 weeks of gestation, (b) aged between 20 and 40 years and (c) without any known infectious or chronic non-communicable diseases (except obesity). Criteria for exclusion after baseline clinical evaluation consisted of the following: miscarriage (n 25), chronic arterial hypertension (n 3), multiple gestation (n 4), diagnosis of infectious or non-communicable disease after starting of the study (n 11), advanced pregnancy (≥14 weeks of gestation, n 15), pre-natal care withdrawn (n 7), stillbirth (n 5), no vitamin D measured at baseline (n 30), self-reported glycaemia alteration (n 12) and no biochemical analyses performed (n 1).
Biochemical analyses
Venous blood samples were taken after a 12-h overnight fasting at three different visits (first, second and third gestational trimesters). Samples were immediately centrifuged (5000 rpm for 5 min), aliquoted and stored at −80°C until further analysis. Plasma samples were used to determine 25(OH)D (nmol/l), leptin (ng/l) and adiponectin (ng/ml) concentrations.
Main independent variable
Plasma 25(OH)D concentrations were analysed using liquid chromatography–tandem MS (LC–MS/MS) at the Quest Diagnostics Nichols Institute Laboratory (San Juan Capistrano) using the LC Thermo Cohesive System coupled to a Thermo Quantum Ultra Mass Spectrometer (Thermo Fisher). This method is the ‘gold standard’ with analytical measurement range of 10–640 nmol/l and the CV <10 %.
The 25(OH)D concentrations at baseline (5th–13th gestational weeks) were used to determine vitamin D status. Pregnant women were categorised as being vitamin D sufficient or insufficient using two cut-points based on the Endocrine Society Practice Guidelines (ESPG) and the Institute of Medicine (IOM). According to the ESPG, vitamin D sufficiency and insufficiency are defined as having 25(OH)D concentrations ≥75 and <75 nmol/l, respectively( Reference Holick, Binkley and Bischoff-Ferrari 2 ). Using the IOM cut-points, sufficiency and insufficiency were defined as 25(OH)D concentrations ≥50 or <50 nmol/l, respectively( 37 ). There are controversies in the literature as to which cut-point of vitamin D for insufficiency is the most appropriate. There is also no specific guideline set forth for pregnant women. We have decided to report both cut-points to increase transparency and to allow for comparability between various studies in the literature.
Dependent variables
Serum fasting glycaemia was estimated by enzymatic colorimetric methods using commercial kits (Linco Research and Wiener Lab., respectively), and insulin concentrations were assessed by ELISA using specific commercial kits designed for humans (Millipore), with sensitivity of 2 µU/ml. Homoeostatic model assessment of insulin resistance (HOMA-IR) was calculated based on the product of fasting insulin (µU/ml) and glucose (mmol/l) divided by 22·5( Reference Matthews, Hosker and Rudenski 38 ). Adipokines were evaluated using ELISA, with sensitivities of 0·78 ng/ml for adiponectin and 5 ng/l for leptin.
Covariate assessment
A structured questionnaire administered at baseline was used to collect information on study population characteristics, including age (year), per-capita monthly household income (USD), parity (nulliparous or primiparous/multiparous) and self-reported skin colour (white, black or mixed). Date of first blood collection was used to define the season at baseline (summer, autumn, winter and spring).
Anthropometric measurements were collected according to standardised procedures at baseline( Reference Gordon, Chumlea and Roche 39 ). Weight was measured using a digital scale (Filizzola PL 150; Filizzola Ltda) at each gestational trimester, and height was measured in duplicate using a portable stadiometer (Seca Ltda). The early pregnancy BMI was calculated using the following formula: weight at baseline (kg)/height2 (m2). The gestational age was obtained from the first ultrasonography (USG) examination (92·3 %; n 167) or using the reported date of the last menstrual period if the USG was not performed before the 24th week of gestation (7·7 %; n 14).
The total dietary vitamin D intake (µg/d) was calculated using Nutritional Composition Tables from the Brazilian Institute of Geography and Statistics( 40 ) according to a semi-quantitative FFQ( Reference Sichieri and Everhart 41 ). The FFQ was validated for the adult population of Rio de Janeiro( Reference Sichieri and Everhart 41 ) and administered in the first trimester of gestation by trained interviewers and referring to intake of the last 6 months. Data on vitamin D supplementation were self-reported throughout pregnancy (first, second and third trimesters).
Statistical analysis
Data distribution was analysed according to the Shapiro–Wilk test. Maternal age, vitamin D intake, per-capita family income, early pregnancy BMI, glycaemia, insulin, HOMA-IR, adiponectin and leptin were not normally distributed (Shapiro–Wilk test P value <0·05). The sample characteristics are described using medians and interquartile ranges. Categorical data are presented as absolute values (n) and relative frequencies (%). Baseline characteristics were stratified according to vitamin D status (sufficiency v. insufficiency). To compare medians and frequencies, the Mann–Whitney U test and the χ 2 test were used, respectively.
Dropout analyses were performed to verify the presence of selection bias comparing those who completed the study to those who were lost to follow-up. The following variables were considered: vitamin D status according to thresholds, dietary vitamin D intake, age, early pregnancy BMI, per-capita family income, glycaemia, insulin, HOMA-IR, adiponectin and leptin concentrations, parity, self-reported skin colour and season at recruitment.
Scatter plots containing longitudinal prediction and 95 % CI were constructed to illustrate the variation in glycaemia and adipokine concentrations during pregnancy according to vitamin D baseline status.
Linear mixed-effect (LME) models were performed to assess the longitudinal associations of vitamin D baseline status with the outcomes throughout pregnancy. The modelling process allows the inclusion of time-dependent and time-independent variables; it is robust to deal with unbalanced time intervals and considers the correlation between repeated measures( Reference Singer and Willett 42 , Reference Twisk 43 ). Interactions between vitamin D baseline status and gestational age were considered to explore the longitudinal behaviour of the evaluated outcomes. The LME models were adjusted for confounders selected by biological plausibility and statistical significance (P<0·2) in the bivariate analysis for each of the five outcomes (glycaemia, insulin, HOMA-IR, adiponectin and leptin). The test to detect interactions was low powered. We considered P<0·1( Reference Greenland 44 ) as a threshold to define statistical significance for the interaction terms and P<0·05 for the main effect variables.
All analyses were performed in Stata 12.0 (Stata Corporation). The significant interactions identified in the LME models were illustrated by graphs plotted with RStudio 3.3.1 software( 45 ).
Ethical approval
This study was conducted according to the guidelines of the Declaration of Helsinki. The Rio de Janeiro Federal University Maternity Hospital Ethics Committee (protocol number: 0023.0.361.000-08) and the Municipal Secretary of Rio de Janeiro Ethics Committee (protocol number: 0139.0.314.000-09) approved all procedures involving humans. All participants signed an informed consent for participation in the study.
Results
The baseline sample comprised 181 pregnant women. From baseline to the second-trimester follow-up, 11 women moved out from the pre-natal program, 2 withdrew consent, 4 abandoned pre-natal care at the study site, 12 missed the follow-up interview and 1 had no biochemical analyses performed, leaving a sample of 151 women at the second trimester. From the second to the third visit, six women were classified as lost to follow-up and seven had no biochemical analyses performed. Eleven women missed the second-trimester interview but returned to the study in the third trimester. Therefore, our final sample at the third trimester comprised 149 women (online Supplementary Fig. S1).
In total, 149 women completed the study, and 32 were lost to follow-up. There were no significant differences between women who completed the study compared to those who were lost during follow-up (online Supplementary Table S1).
At baseline, women had a median age of 26 (IQR 22·0–31·0) years, early pregnancy BMI of 23·7 (IQR 21·9–27·0) kg/m2, per-capita family income of 292·4 (IQR 184·8–421·0) USD and reported a vitamin D intake of 3·4 (IQR 2·22–4·64) µg/d, and 46·9 % self-reported their skin colour to be mixed. The prevalence of vitamin D insufficiency was 70·7 % (n 128/181) and 16·0 % (n 29/181) according the cut-offs proposed by the ESPG and the IOM, repectively. Women who began the study in the winter, compared to those who began in summer, were more likely to be vitamin D insufficient (ESPG: 33·6 v. 15·6 %, respectively, P<0·001; IOM: 51·7 v. 3·5 %, respectively, P<0·001) (Table 1). None of the women who participated in the study received nutritional vitamin D supplementation (data not shown).
Table 1 Baseline characteristics of the study population according to vitamin D sufficiency status in the first trimester of pregnancy (Medians and interquartile ranges (IQR); numbers and percentages)
25(OH)D, 25-hydroxyvitamin D.
* P value refers to the Mann–Whitney test. P values <0·05 were considered statistically significant.
† P value refers to the χ 2 test. P values <0·05 were considered statistically significant.
‡ Among women with vitamin D sufficiency according to Endocrine Society Practice Guidelines at baseline, we observed significantly higher proportions of women entering pregnancy in the summer and in the autumn, compared with those who became pregnant in the winter.
§ Among women with vitamin D insufficiency according to Endocrine Society Practice Guidelines at baseline, we observed a significantly higher proportion of women entering pregnancy in the winter than in the summer.
|| Among women with vitamin D insufficiency according to the Institute of Medicine at baseline, we observed a significantly higher proportion of women entering pregnancy in the winter than in the summer.
Pregnant women with vitamin D sufficiency at baseline showed lower glycaemia when compared to insufficient women (ESPG: median 79·5 v. 84·0 mg/l, respectively, P=0·003; IOM: median 83·0 v. 84·0 mg/l, respectively, P=0·034) (Table 2). The glycaemia decreased from the first to the second trimester, followed by a slight increase from the second to the third trimester onwards, in both women with vitamin D sufficiency and insufficiency at baseline (Fig. 1(a) and (b)). However, the rate of change for glycaemia throughout pregnancy did not show a significant difference between the baseline vitamin D groups (Table 3). Similar results were observed when 25(OH)D was analysed throughout pregnancy (Fig. 2(a) and (b); Table 4).
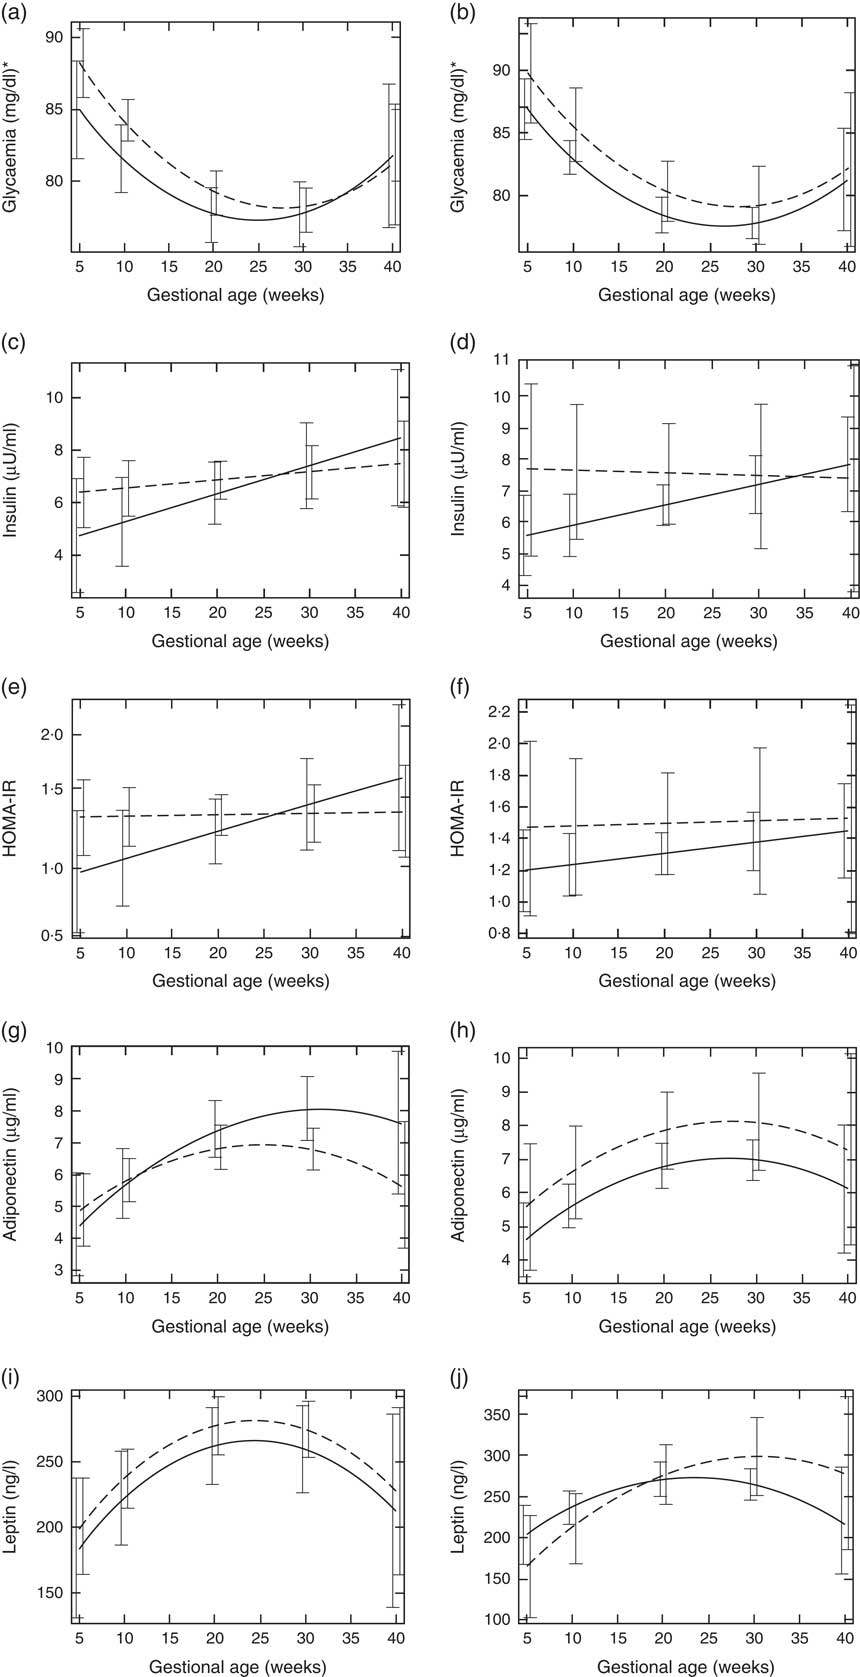
Fig. 1 Changes in glucose metabolism markers and adipokines throughout pregnancy according to vitamin D baseline status, Rio de Janeiro/Brazil, 2009–2012. Glycaemia according to vitamin D status (a) Endocrine Society Practice Guidelines and (b) the Institute of Medicine cut-off points. Insulin according to vitamin D status (c) Endocrine Society Practice Guidelines and (d) the Institute of Medicine cut-off points. Homoeostatic model assessment of insulin resistance (HOMA-IR) according to vitamin D status (e) Endocrine Society Practice Guidelines and (f) the Institute of Medicine cut-off points. Adiponectin according to vitamin D status (g) Endocrine Society Practice Guidelines and (h) the Institute of Medicine cut-off points. Leptin according to vitamin D status (i) Endocrine Society Practice Guidelines and (j) the Institute of Medicine cut-off points.
![]() , Sufficiency vitamin D status at baseline;
, Sufficiency vitamin D status at baseline;
![]() , insufficiency vitamin D status at baseline. * To convert glucose in mg/dl to mmol/l, multiply by 0·0555.
, insufficiency vitamin D status at baseline. * To convert glucose in mg/dl to mmol/l, multiply by 0·0555.
Table 2 Markers of glucose and adipokines concentrations of the study population according to vitamin D sufficiency status in the first trimester of pregnancy (Medians and interquartile ranges (IQR))
25(OH)D, 25-hydroxyvitamin D; HOMA-IR, homoeostatic model assessment of insulin resistance.
* P value refers to the Mann–Whitney test. P values <0·05 were considered statistically significant.
† To convert glucose in mg/dl to mmol/l, multiply by 0·0555.
Table 3 Markers of glucose metabolism and adipokines changes during pregnancy according to vitamin D adequacy status at the first trimester, Rio de Janeiro, Brazil, 2009–2011 (β-Coefficients and 95 % confidence intervals)
HOMA-IR, homoeostatic model assessment of insulin resistance.
* Sufficiency (reference category, 25(OH)D≥75 nmol/l)/inadequacy status (25(OH)D<75 nmol/l).
† Sufficiency (reference category, 25(OH)D≥50 nmol/l)/insufficiency status (25(OH)D<50 nmol/l).
‡ The adiponectin, leptin and glycaemia models were adjusted for gestational age and quadratic gestational age in weeks and for women’s age, BMI and seasons (spring/summer/autumn/winter); the insulin and HOMA-IR models were adjusted for gestational age in weeks and for women’s age, BMI and seasons (spring/summer/autumn/winter). Glycaemia model: number of observations=474; number of groups=182; average of 2·6 observations per group. Insulin model: number of observations=475; number of groups=180; average of 2·6 observations per group. HOMA-IR model: number of observations=467; number of groups=182; average of 2·6 observations per group. Adiponectin model: number of observations=474; number of groups=182; average of 2·6 observations per group. Leptin model: number of observations=480; number of groups=181; average of 2·7 observations per group.
§ β=longitudinal linear regression coefficient.
¶ To convert glucose in mg/dl to mmol/l, multiply by 0·0555.
|| P value refers to maximum likelihood estimator.
** The reference category was adequate status of 25(OH)D.
†† P values <0·1 were considered statistically significant.
Table 4 Markers of glucose metabolism and adipokines according to vitamin D sufficiency status changes during pregnancy, Rio de Janeiro, Brazil, 2009–2011 (β-Coefficients and 95 % confidence intervals)
HOMA-IR, homoeostatic model assessment of insulin resistance; 25(OH)D, 25-hydroxyvitamin D.
* Sufficiency (reference category, 25(OH)D≥75 nmol/l)/insufficiency status (25(OH)D<75 nmol/l).
† Sufficiency (reference category, 25(OH)D≥50 nmol/l)/insufficiency status (25(OH)D<50 nmol/l).
‡ The adiponectin, leptin and glycaemia models were adjusted for gestational age and quadratic gestational age in weeks and for women’s age, BMI and seasons (spring/summer/autumn/winter); the insulin and HOMA-IR models were adjusted for gestational age in weeks and for women’s age, BMI and seasons (spring/summer/autumn/winter). Glycaemia model: number of observations=503; number of groups=207; average of 2·4 observations per group. Insulin model: number of observations=509; number of groups=205; average of 2·5 observations per group. HOMA-IR model: number of observations=498; number of groups=207; average of 2·4 observations per group. Adiponectin model: number of observations=506; number of groups=207; average of 2·4 observations per group. Leptin model: number of observations=512; number of groups=206; average of 2·5 observations per group.
§ β=longitudinal linear regression coefficient.
¶ To convert glucose in mg/dl to mmol/l, multiply by 0·0555.
|| P value refers to maximum likelihood estimator.
** The reference category was adequate status of 25(OH)D.
†† P values <0·1 were considered statistically significant.
The rate of change in insulin was greater among vitamin D sufficient women at baseline (ESPG: β=0·166; 95 % CI 0·047, 0·285, P=0·006; IOM: β=0·091; 95 % CI 0·019, 0·162, P=0·013) (Fig. 1(c) and (d)). There was a less pronounced increase in insulin throughout pregnancy among vitamin D insufficient women compared to those who started with sufficient status according to ESPG (interaction β=−0·12; 95 % CI −0·251, 0·009; P=0·069) (Table 3). We found significant results when 25(OH)D was analysed throughout pregnancy using the IOM thresholds (interaction β=−0·153; 95 % CI −0·325, 0·018; P=0·080) (Fig. 2(c) and (d); Table 4).
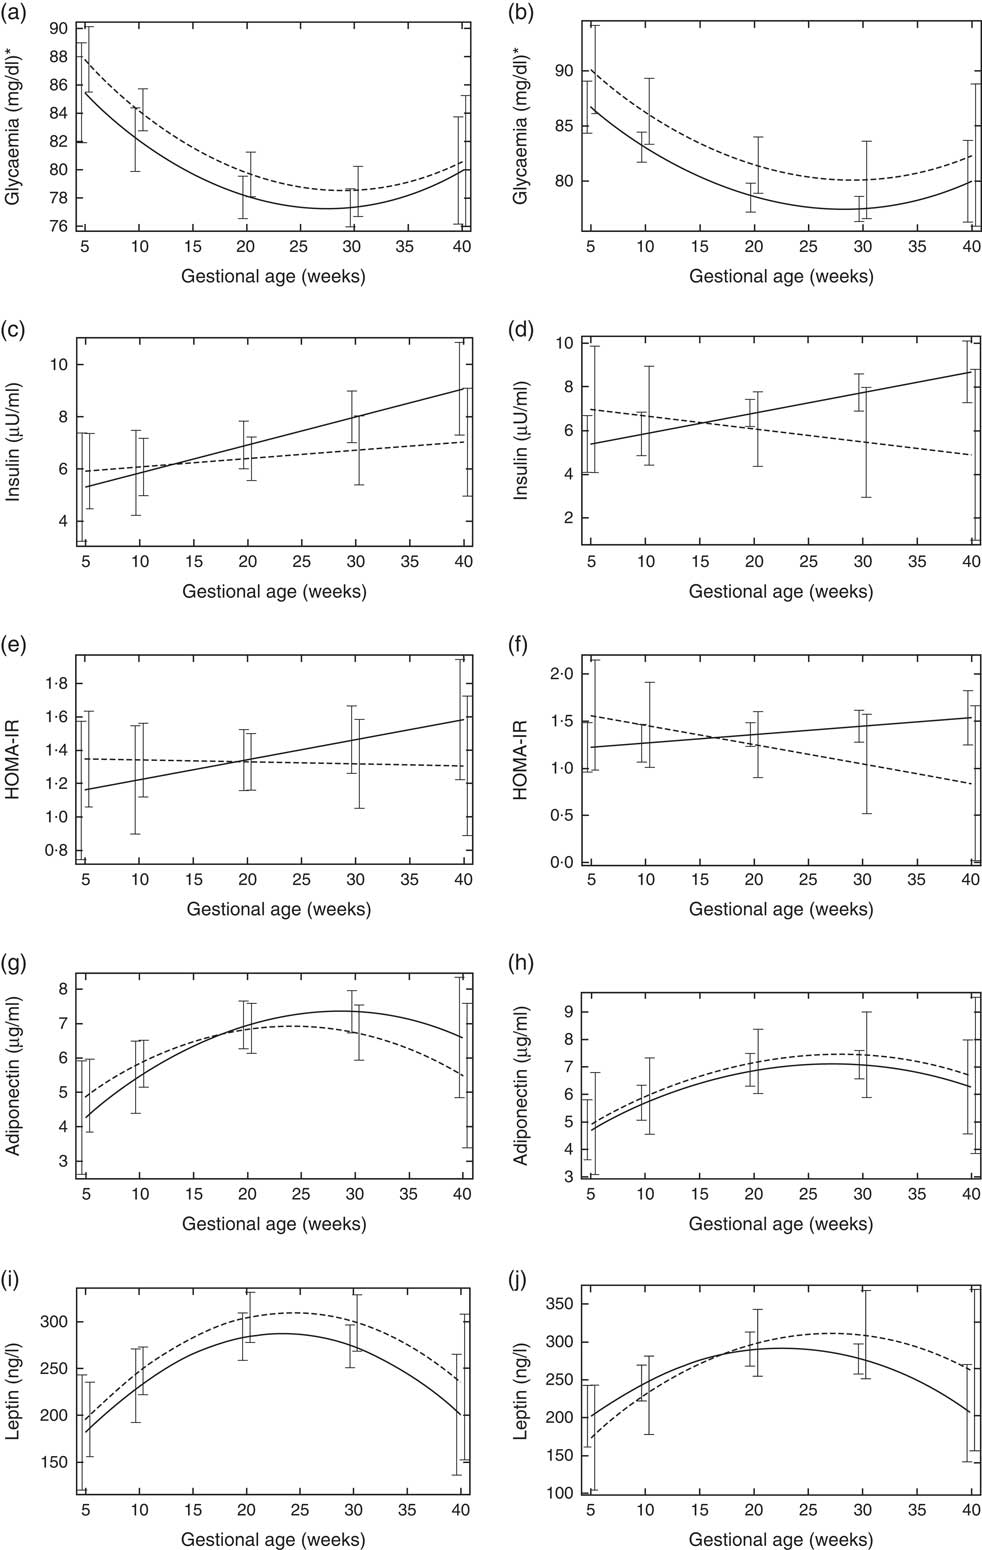
Fig. 2 Changes in glucose metabolism markers and adipokines according to vitamin D status throughout pregnancy, Rio de Janeiro/Brazil, 2009–2012. Glycaemia according to vitamin D status (a) Endocrine Society Practice Guidelines and (b) the Institute of Medicine cut-off points. Insulin according to vitamin D status (c) Endocrine Society Practice Guidelines and (d) the Institute of Medicine cut-off points. Homoeostatic model assessment of insulin resistance (HOMA-IR) according to vitamin D status (e) Endocrine Society Practice Guidelines and (f) the Institute of Medicine cut-off points. Adiponectin according to vitamin D status (g) Endocrine Society Practice Guidelines and (h) the Institute of Medicine cut-off points. Leptin according to vitamin D status (i) Endocrine Society Practice Guidelines and (j) the Institute of Medicine cut-off points.
![]() , Sufficiency vitamin D status during pregnancy;
, Sufficiency vitamin D status during pregnancy;
![]() , insufficiency vitamin D status during pregnancy. * To convert glucose in mg/dl to mmol/l, multiply by 0·0555.
, insufficiency vitamin D status during pregnancy. * To convert glucose in mg/dl to mmol/l, multiply by 0·0555.
There was a tendency for lower HOMA-IR in the group of women classified as sufficient vitamin D status at baseline when compared to those with vitamin D insufficient status (ESPG: median 0·65 v. 0·93, respectively, P=0·062; IOM: median 0·82 v. 1·14, respectively, P=0·071) (Table 2). HOMA-IR increased throughout gestation among women with sufficient vitamin D status at baseline (ESPG: β=0·019; 95 % CI 0·00001, 0·039; P=0·050) but did not change in the insufficient group (Fig. 1(e) and (f)). However, the results were not significant for this biomarker when baseline vitamin D-sufficient and insufficient women were compared (Table 3). We found significant results when 25(OH)D was analysed throughout pregnancy using the IOM thresholds (interaction β=−0·030; 95 % CI −0·065, 0·005; P=0·094) (Fig. 2(e) and (f); Table 4).
The trend in changes in adiponectin throughout pregnancy showed an increase from the beginning of pregnancy until the second trimester and was followed by a slight decrease at the end of gestation for both vitamin D status groups, whether measured at baseline or when 25(OH)D varied throughout pregnancy (Figs. 1(g) and (h) and 2(g) and (h)). Women with vitamin D insufficient status at baseline started gestation with higher median plasma levels of adiponectin, although this association was not significant (5·26 v. 4·49 µg/ml, P=0·170) (Table 2). However, the rate of change of adiponectin throughout pregnancy was significantly higher in women with sufficient vitamin D levels at baseline (ESPG: β=−0·070; 95 % CI −0·150, 0·010; P=0·085) (Table 3). Women with sufficient vitamin D status at baseline, according to IOM classification, tended to have a lower rate of change in adiponectin throughout pregnancy, although this did not reach significance (Table 3; Fig. 1(h)). The rate of change in adiponectin throughout pregnancy was significantly higher in women with sufficient vitamin D levels when this marker varied throughout pregnancy (ESPG: β=−0·056; 95 % CI −0·116, 0·004; P=0·066) (Table 4).
There were no significant differences in leptin concentrations, comparing each trimester individually, according to ESPG, but it was found that women with inadequate vitamin D status according to IOM presented higher leptin concentrations (Table 2). Women with insufficient vitamin D status according to ESPG had a significant decrease in leptin concentrations (β=−0·259; 95 % CI −0·424, −0·094; P=0·002). Using the IOM cut-points, the decrease was significant only within the sufficient group (β=−0·214; 95 % CI −0·360, −0·068; P=0·004) (Fig. 1(i) and (j)). Women with insufficient vitamin D levels presented a greater increase in leptin concentrations, in relation to the sufficient group, according to IOM (β=2·532; 95 % CI −0·436, 5·501; P=0·094) (Table 3). These results did not hold when 25(OH)D varied throughout pregnancy (Fig. 2(i) and (j); Table 4).
Discussion
The main result of this study is the difference in the variation of adiponectin and insulin concentrations throughout pregnancy according to vitamin D baseline status defined by the ESPG. We observed that throughout pregnancy the rate of increase for both biomarkers was greater among women with vitamin D sufficiency compared to women who started their pregnancy in a vitamin D–deficient state. Another important finding is that women with insufficient vitamin D at baseline had a higher increase in leptin levels during gestation compared to the sufficient group according to the IOM classification. In addition, women classified with vitamin D sufficiency, independent of the cut-off criteria, had lower baseline glycaemia, although the rate of change of this biomarker did not differ between the two vitamin D status groups.
The definition of vitamin D sufficiency or insufficiency remains controversial. Currently, there are no specific cut-points for pregnant women, and the same cut-points are used for adults. It is well-known that the thresholds for several biomarkers are rarely available for this period of life, and the case is not different for vitamin D. Thus, more research is needed to establish the adequate cut-off point for this unique period in women’s life. In the current study, we opted to use two different thresholds presented by the two governing bodies of vitamin D status: the ESPG and the IOM. This strategy allows comparability with other studies in the literature and provides a broader picture of the studied associations in place. Another aspect of studies conducted during pregnancy that can be misleading is related to the timing vitamin D was assessed during pregnancy. The conclusions may vary if studies consider only baseline vitamin D, for example, first trimester, what should be a representation of how pre-conception period affects the parameters evaluated throughout pregnancy. On the other end, if data are available for several time points, this can provide a clearer picture of the trajectory and how this may influence a specific outcome. In general, the directions of the rate of change trajectories for the studied outcomes were similar, regardless of the 25(OH)D threshold used. Adiponectin was the exception. Pregnant women with sufficient vitamin D levels at baseline showed significantly higher levels of adiponectin when the ESPG criteria was used, while according to the IOM classification, they showed lower levels, but the results were not significant. The results regarding the timing of vitamin D assessment yield slight conflicting results for insulin, HOMA-IR and leptin. Again, the direction of the associations remained the same, but the statistical significance of the interaction changed depending on the timing and threshold used. An important finding of this study is that differing conclusions can be made depending on the vitamin D deficiency threshold used or the timing when vitamin D status is evaluated. This is of particular importance when considering the conflicting results in the scientific literature.
The longitudinal data with three time points are an important strength of this study. We did not identify other studies assessing these associations with longitudinal data in the scientific literature. Moreover, the robust statistical analysis of the present study, taking into account the correlations between repeated measures and considering all women had information on at least two time points, is an additional strength. The method used to measure plasma 25(OH)D concentrations was LC–MS/MS, which is considered the ‘gold standard’ for this marker. Furthermore, we also evaluated dietary vitamin D intake and supplementation. However, limitations, such as losses to follow-up and the absence of information about sun exposure data, should be acknowledged. To assess whether the losses to follow-up biased our results, we examined whether those women who were lost to follow-up differed from those who remained in the study. This analysis shows no significant differences in those who were lost to follow-up, which suggests that losses to follow-up occurred randomly in this study. We also adjusted all models for the season of the year at the time of blood collection, which was used as a proxy for sun exposure, since these data were not available. In addition, we did not measure the expression of enzymes that are involved in the conversion of vitamin D and the vitamin D receptor in the placenta to support extra-renal synthesis of 1,25-dihydroxyvitamin D3 (1,25(OH)2D3) during pregnancy( Reference Liu and Hewison 46 ). This could influence the outcomes; however, the maternal kidneys are likely to be the major source of increased maternal serum 1,25(OH)2D3 during pregnancy( Reference Liu and Hewison 46 ).
A high prevalence of vitamin D insufficiency according to the ESPG was previously reported in this cohort( Reference Figueiredo, Cocate and Adegboye 47 ), which is similar to results found for pregnant women in other studies using this threshold( Reference Schneuer, Roberts and Guilbert 48 , Reference Flood-Nichols, Tinnemore and Huang 49 ). Schneuer et al. ( Reference Schneuer, Roberts and Guilbert 48 ) observed that 80·4 % of 5109 pregnant women from Australia had vitamin D insufficiency in the first trimester. Flood-Nichols et al. ( Reference Flood-Nichols, Tinnemore and Huang 49 ) found that 70 % of 235 American women had vitamin D insufficiency in early pregnancy, while 59·0 % of 190 Brazilian pregnant women presented vitamin D insufficiency( Reference Pereira-Santos, Queiroz Carvalho and David Couto 50 ). We identified a low intake of vitamin D during pregnancy (3·4 µg/d) in the present study by considering either the recommendation of the ESPG of 37·5–50 µg/d or the Brazilian recommendations (15 µg/d)( Reference Maeda, Borba and Camargo 51 ). We also observed that none of the women used vitamin D supplements, since this is not part of public pre-natal care. In Brazil, only supplementation with Fe (40 mg) and folic acid (400 mcg) are mandatory for pregnant women( 52 ). Despite low vitamin D dietary intake, we have previously reported a longitudinal increase in 25(OH)D levels throughout pregnancy in this cohort of women( Reference Figueiredo, Cocate and Adegboye 47 ). In addition, the level of increase in 25(OH)D concentrations depended on seasonal variation. Pregnant women who started their pregnancy during the winter, spring or autumn seasons had a significant longitudinal increase in 25(OH)D concentrations, while women who began pregnancy during the summer season showed no significant changes in 25(OH)D concentrations throughout pregnancy( Reference Figueiredo, Cocate and Adegboye 47 ).
In the current cohort, pregnant women with vitamin D insufficiency according to the ESPG had higher glycaemia in the first trimester compared to women with vitamin D sufficiency. This result corroborates with findings from an earlier cross-sectional study with 155 Iranian pregnant women. That study showed a significant inverse association between first-trimester 25(OH)D concentrations and fasting glucose (r 0·238; P=0·003)( Reference Jafarzadeh, Motamedi and Behradmanesh 53 ). On another cross-sectional study, Casey et al. ( Reference Casey, McGinty and Holmes 54 ) evaluated the association between vitamin D and glycaemia markers at the third gestation trimester and found no significant association with fasting glucose or HOMA-IR. These results are in line with the present findings regarding the third trimester. It seems that the relationship between vitamin D and glucose concentrations may be mediated by the role of vitamin D on insulin action.
Due to increased maternal adiposity and placental production, increased insulin resistance is expected to occur during pregnancy from the 18th gestational week until the third trimester( Reference Catalano 55 ). Peripheral insulin sensitivity decreases in the third trimester, and the hepatic glucose production increases compared to the beginning of pregnancy( Reference Catalano, Tyzbir and Wolfe 56 ). Vitamin D appears to play a role in insulin sensitivity, stimulating the expression of the insulin receptors and improving glycaemic metabolism( Reference Alvarez and Ashraf 57 – Reference Arnold, Enquobahrie and Qiu 59 ). Thus, glucose would be better absorbed by the cells, and glycaemia would be at lower levels.
The longitudinal analyses from the present study show that pregnant women with vitamin D sufficiency at baseline had sharper increases in insulin concentration compared to those with vitamin D insufficiency according to both thresholds used. The greater increase in insulin in the group with vitamin D adequacy was not followed by significant longitudinal increases in glycaemia or HOMA-IR during pregnancy. The active metabolite of vitamin D (1,25(OH)2D3) has been shown to be involved in insulin secretion by the pancreas and glucose homoeostasis( Reference Sung, Liao and Lu 14 ). In addition, pancreatic β-cells are known to have vitamin D receptors and an insulin gene promoter that is stimulated by 1,25(OH)2D3, thus indicating a direct association between vitamin D and insulin( Reference Altieri, Grant and Casa 60 ). This mechanism could explain the greater insulin increase among women with vitamin D adequacy compared to those with vitamin D inadequacy in our sample. This result reinforces a small study performed with adults that found that subjects with vitamin D deficiency (<50 nmol/ml) secrete less insulin than subjects with adequacy status( Reference Gedik and Akalin 61 ).
A recent experimental study investigated the metabolic effects of adiponectin on maternal glucose and lipid metabolism by comparing pregnant rats with and without adiponectin deficiency( Reference Retnakaran 62 , Reference Qiao, Wattez and Lee 63 ). The authors observed that adiponectin stimulated the β-cell proliferation and impaired the islet mass without differences in insulin sensitivity effects in comparison to the deficient group( Reference Amegah, Klevor and Wagner 4 , Reference Retnakaran 62 , Reference Qiao, Wattez and Lee 63 ). This finding allows suggesting another mechanism on insulin besides the well-established insulin-sensitising property of this adipokine( Reference Retnakaran 62 , Reference Qiao, Wattez and Lee 63 ). In humans, pregnant women present this phenomenon of β-cell proliferation without increase in islet mass, but this particular study was limited because it was conducted in women who died during pregnancy( Reference Butler, Cao-Minh and Galasso 64 ). However, it is possible that adiponectin also exerts an effect on human cell proliferation( Reference Retnakaran 62 ). Vitamin D could stimulate the adiponectin secretion, which in turn stimulates β-cell proliferation, increasing insulin secretion. This explanation would support our results of greater increases in adiponectin and insulin in pregnant women with vitamin D adequacy status during pregnancy.
We found an association between vitamin D status and the rate of change in adiponectin during pregnancy. In the present study, pregnant women with adequate levels of 25(OH)D in the first trimester showed a sharper increase in adiponectin concentration throughout pregnancy when compared to women with inadequate levels of vitamin D. In addition, 1,25(OH)2D is known to regulate the RAAS in a negative feedback loop by binding with a transcription factor necessary for the expression of renin( Reference Yuan, Pan and Kong 65 ). Inhibition of RAAS results in increased levels of adiponectin and improved insulin sensitivity, which exerts influence on glycaemia( Reference Vaidya, Forman and Underwood 20 ). This mechanism of action can explain our result of higher increase in adiponectin among pregnant women with adequate 25(OH)D levels compared to those with inadequate levels.
Previous studies found direct associations between vitamin D and adiponectin independent of BMI in both young and adult populations( Reference Gannagé-Yared, Chedid and Khalife 66 – Reference Vaidya, Williams and Forman 68 ), but no studies were found with pregnant women.
No differences were observed in mean adiponectin and leptin concentrations between pregnant women with vitamin D adequacy and inadequacy at each gestational trimester, that is, cross-sectional analysis. Similarly, a case–control study conducted by McManus et al. ( Reference McManus, Summers and de Vrijer 69 ) also found no correlation between 25(OH)D and adipokine concentrations during the third trimester in both healthy pregnant women and pregnant women with GDM.
A meta-analysis conducted in 2016 showed that vitamin D supplementation increased the serum leptin concentrations, although a meta-analysis using cross-sectional studies with non-pregnant subjects found inverse associations between 25(OH)D and leptin levels (Fisher’s Z=−0·93; 95 % CI −0·95, −0·91)( Reference Hajimohammadi, Shab-Bidar and Neyestani 31 ). In the present cohort, it was observed that pregnant women with vitamin D sufficiency showed a less pronounced increase in leptin until the second trimester and a higher decrease until the end of gestation, although this did not reach significance. Similarly, Walsh et al. ( Reference Walsh, McGowan and Kilbane 70 ) evaluated the correlation between 25(OH)D and leptin levels at early pregnancy and 28 weeks of gestation and found a negative association that was not significant.
Conclusion
Pregnant Brazilian women with vitamin D adequacy (25(OH)D ≥75 nmol/l) at the first trimester had a higher rate of increase in adiponectin and insulin concentrations throughout pregnancy compared to women with vitamin D inadequacy (25(OH)D <75 nmol/l). These results indicate that vitamin D status at the beginning of gestation may influence the changes in adiponectin and insulin during pregnancy. Although these women had higher values of insulin, there were no higher glycaemia values, showing that there was an adequate metabolic response. This result reinforces the importance of monitoring the vitamin D status of pregnant women in the first trimester of pregnancy to achieve a favourable metabolic profile for reducing the risk of undesired pregnancy outcomes. Given the scarcity of studies, there is a need for research involving pregnant women to evaluate this relationship and to provide further evidence on this topic.
Acknowledgements
The authors are grateful to all participants of the cohort study, to the Municipal Health Centre Heitor Beltrão for giving us the space and allow the completion of data collection; to the Quest Diagnostics Nichols Institute laboratory (San Juan Capistrano, CA, USA) for performing the analyses of vitamin D. In addition, to the National Council for Scientific and Technological Development (CNPq in the Portuguese acronym; grant no. 471196/2010-0) and the Carlos Chagas Filho Foundation for Research Support of Rio de Janeiro State (FAPERJ in the Portuguese acronym, grant no. E-26/111.400/2010, E_14/2010) for the financial support. FAPERJ and CNPq had no role in the design, analysis or writing of this article.
C. B., P. G. C., G. K. formulated the research question, designed the study and developed the protocol. C. B. and P. G. C. conducted the statistical analysis, and N. H. A.-S. provided support for statistical analysis. E. G. d. B., A. B. F.-S., A. C. C. F., J. L., A. R. A. A., M. F. H. and R. M. assisted with the literature searches and with the writing of the manuscript. All authors substantially have contributed to and have approved the final version of this manuscript.
The authors declare that there are no conflicts of interest.
Supplementary material
For supplementary material/s referred to in this article, please visit https://doi.org/10.1017/S0007114518003057


