Child obesity is a growing public health epidemic across the globe in which currently 50 million girls and 74 million boys are obese(1). The increased prevalence of overweight and obesity is especially alarming in low- and middle-incomes countries (LMIC), such as Vietnam, that are undergoing the nutrition transition and shifting from traditional to obesogenic diets(Reference Winichagoon2). These countries also face the dual burden of a high prevalence of undernutrition and obesity and often accompanied by micronutrient deficiencies(Reference Biswas, Magalhaes and Townsend3–Reference Rachmi, Li and Baur5). Poor nutrition and growth early in life can also increase the risk for non-communicable chronic diseases later in life(Reference Emmett and Jones6–Reference Hoffman, Reynolds and Hardy10). However, existing tools that are used to measure child growth and body composition, especially in resource poor settings, are often either non-field friendly and/or inaccurate and unreliable(Reference Kyle, Earthman and Pichard11). Therefore, the objective of the present study was to develop and validate a relatively inexpensive and ‘field-friendly’ tool to assess body composition in children in LMIC.
Historically, large cohort studies and national surveys have relied on relatively inexpensive and generally reliable anthropometric measures, such as weight, height, waist circumference and skinfold measures, to estimate body composition in children and adults(Reference Lohman and Going12–Reference Hoffman, Sawaya and Martins15). However, these methods are generally not generalisable and may create biased estimates especially when body composition compartments, such as percentage body fat, have been calculated using prediction equations developed from populations that differ by age, race and/or ethnicity(Reference Nasreddine, Naja and Hills16–Reference Cameron, Griffiths and Wright21). For example, Hoffman et al.(Reference Hoffman, Sawaya and Martins15) reported that skinfold prediction equations consistently underestimated body fat mass (FM) compared with dual-energy X-ray absorptiometry (DXA) and 2H dilution. In addition, Rodríguez et al.(Reference Rodríguez, Moreno and Blay14) found that skinfold prediction equations had poor agreement with body composition measurements estimated by DXA. More recently, many studies are now relying on simpler and more reliable methods that have minimal operator error, such as bioelectric impedance analysis (BIA). While BIA may be considered to less prone to operator error compared with anthropometrics, it is not without limitations, and a recent review described varying degrees of bias attributed to the use of different prediction equations and the inconsistent use of protocols between studies(Reference Ward22).
Estimating body composition with BIA is based on the principle that electricity is impeded as it is conducted through a cylinder and passes easily through hydrated tissue, that is, fat-free mass (FFM), yet resisted by tissue with little to no water, fat mass (FM)(Reference Lukaski, Bolonchuk and Hall23). Yet, the human body is not one cylinder and can be thought to be composed of five cylinders, the trunk, arms and legs, and differences in proportions between these areas can yield different results for the same BIA. Moreover, the use of BIA is not without challenges as most manufacturers create proprietary equations that cannot be altered and have not been widely validated in children(Reference Haroun, Croker and Viner24). Still, a number of groups have published accurate prediction equations for paediatric uses of BIA(Reference Stevens, Ou and Cai25–Reference Kehoe, Krishnaveni and Lubree27). Developing population-specific prediction equations for BIA is typically done(Reference Stevens, Truesdale and Cai28–Reference Diouf, Diongue and Nde30) by comparing estimates against a ‘gold standard’, such as 2H dilution or DXA to assess body composition. For example, DXA was used to develop a nationally representative BIA prediction equation for children in the USA(Reference Stevens, Truesdale and Cai28). These approaches have also been used for special populations, such as neonates(Reference Tint, Ward and Soh31) and severely obese adolescents(Reference Steinberg, Manlhiot and Li32). However, gaps remain in the use of BIA to assess body composition in young children from LMIC that may differ by race and ethnicity which have been related to body composition(Reference Liu, Byrne and Kagawa33).
Given the rise of obesity in LMIC, there is an urgent need for simple yet valid measures of body composition that can be used easily to estimate body fat in young children in resource-poor environments and better understand how specific early life factors influence the development of adiposity across the lifespan. The objective of this paper was to develop and validate population-specific prediction equations for estimating FM and FFM in young Vietnamese children using reactance, resistance from bioelectrical impedance as well as anthropometric variables.
Methods
Study setting and sample
The present study is a collaboration between investigators based at Emory University, Rutgers University and Thai Nguyen University of Medicine and Pharmacy. We conducted a cross-sectional survey of 120 healthy children aged 4–7 years who were recruited from local schools and daycare centres in the city of Thai Nguyen, Vietnam. The study site was selected based on an existing partnership between Emory University and Thai Nguyen University of Medicine and Pharmacy and availability of resources, especially trained personnel and ease of access to a DXA machine at Thai Nguyen National Hospital, teaching hospital for Thai Nguyen University of Medicine and Pharmacy. We employed a convenience sampling framework to recruit children with an equal distribution of BMI z-score (underweight, normal and overweight), sex and age. Written informed consent was obtained from all mothers and/or primary caregiver, and all study protocols were approved by the Human Investigations Committees in Vietnam and Emory University.
Measures
Seven anthropometric measurements, height, weight, triceps and subscapular skinfolds and waist, hip, and mid upper arm circumferences, were obtained in duplicate by trained staff using standardised procedures(Reference Gibson34–Reference Lohman36). Weight and height were measured using a calibrated digital scale (Seca Corporation) and a fixed stadiometer (Seca Corporation), respectively. Skinfold thicknesses and circumferences were measured using Lange skinfold calipers and flexible, non-stretchable measuring tape. BMI z-scores were calculated by comparing each child’s weight and height measurements with the WHO standards(37), and children were categorised as low BMI (<–1 sd), normal (–1 to 1 sd) or overweight (>1 sd).
Body composition was measured using two different methods. First, we assessed body composition using a Seca mBCA 525 multifrequency BIA (Seca Corporation). All subjects had been fasting for at least 4 h with no vigorous exercise for 24 h before the measurement. All children wore minimal clothing and rested in the prone position for 5 min prior to the measurement. The position of each child’s arms and legs was done according to the manufacturer’s protocol. Specifically, the feet and thighs are not in contact with each other, and the hands and arms are placed beside the body without touching the body. Finally, the children were told to lie still and remain relaxed during the measurement. Using an 8-polar tactile-electrode impedance meter, four electrodes were placed on the palm and thumb of both hands, and four electrodes were placed on the anterior and posterior aspects of the soles of both feet. The raw values of total body resistance and reactance at 50 kHz were recorded for the data presented. Second, whole-body DXA scanning was used as the reference body composition measurement (Hologic Discovery DXA System, Hologic Inc). Scans were conducted using paediatric software according to the manufacturer-recommended protocol to obtain estimates of total FM, total FFM and percentage body fat (PBF).
Statistical methods
Descriptive analyses were conducted for general characteristics of study sample. The candidate predictors for the models were selected based on their clinical importance as reported in previous studies(Reference Stevens, Ou and Cai25,Reference Wan, Ward and Halim38) . Predictor variables included age, sex, five anthropometric variables (height, weight, waist circumference, hip circumference, subscapular skinfold), resistance and reactance as well as resistance index (RI, height in cm2/resistance).
We developed prediction equations by following the four steps of model development that have been used in previous validation studies(Reference Stevens, Ou and Cai25,Reference Stevens, Truesdale and Cai28) . In step 1, the random-split method was used to create the development and validation datasets with 70 and 30 % of the total observations in the original dataset, respectively. All potential models were built in the development set and tested in the validation set. In step 2, models were generated in the development dataset using the Least Absolute Shrinkage and Selection Operator technique(Reference Tibshirani39). Estimation of the penalty parameter for the Least Absolute Shrinkage and Selection Operator was based on grid search with 10-fold cross-validation as the optimisation criterion. In step 3, all final model equations were tested in the validation dataset. The predicted FM, FFM and PBF (FMPRED, FFM PRED and PBFPRED) were calculated in the validation data using the coefficients of the models selected in step 2 and then compared with the actual values from DXA (denoted as DXAFM, DXAFFM and DXAPBF). The model performance was evaluated using the following four metrics: predicted residual error sum of squares, root mean squared error (RMSE), mean absolute error (MAE) and R 2. The PRESS, RMSE and MAE measure the discrepancy between the predicted and the actual value, thus the smaller value, the closer the fit between the model and the data. The R 2 provides the proportion of the variance of an outcome variable that is explained by predictor variables in a multiple linear regression model such that a higher R 2 indicates a better fit. In step 4, the final equations for FMPRED, FFMPRED and PBFPRED were produced based on the selected model using the full dataset.
Sensitivity analyses were conducted to compare the performance of models that were developed from a list of candidate variables in which seven different subsets of candidate predictors were tested (models 1–7). All candidate predictors were first included in model 1 and then were removed one by one for each subsequent model until model 6 that contained only age, sex and weight and model 7 that included only RI and reactance. We also developed two sets of models, the first set included RI without height (as height in already included in the RI) and the second set included resistance and height to determine if using RI provided a better fit than the including the variables independently.
All statistical analyses were performed using Stata (version 15.2) and R (version 3.5.0), and statistical significance was set at P < 0·05.
Results
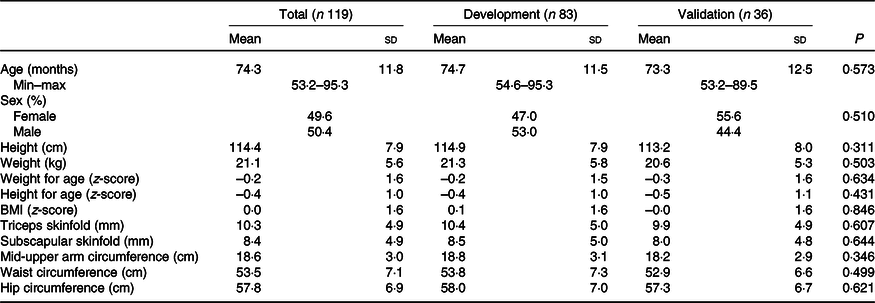
Descriptive statistics for anthropometric measurements and other sample characteristics are presented in Table 1, while estimates of body composition from BIA and DXA are shown in Table 2. There were no statistical differences in mean age, sex, height, weight, skinfold thicknesses or anthropometric indicators including WAZ, WHZ or HAZ or skinfold measures between the development and validation sub-samples. There were also no differences in mean values of resistance and reactance, RI, FM, FFM or PBF between the development and validation sub-samples.
Table 1. Anthropometric characteristics of children in Vietnam by total sample and development and validation groups
(Mean values and standard deviations; numbers and percentages)

Table 2. Body composition data of children in Vietnam by total sample and development and validation groups using bioelectrical impedance analysis (BIA) or dual-energy X-ray absorptiometry (DXA)
(Mean values and standard deviations)

RI, resistance index (height (cm)2/resistance).
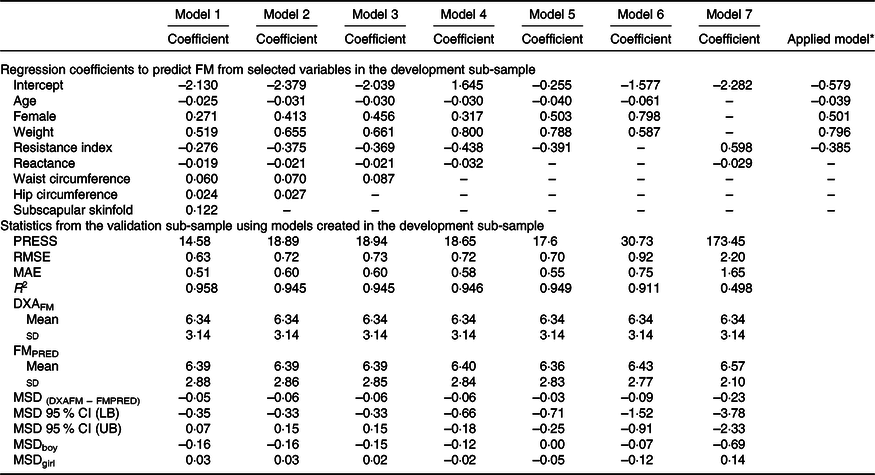
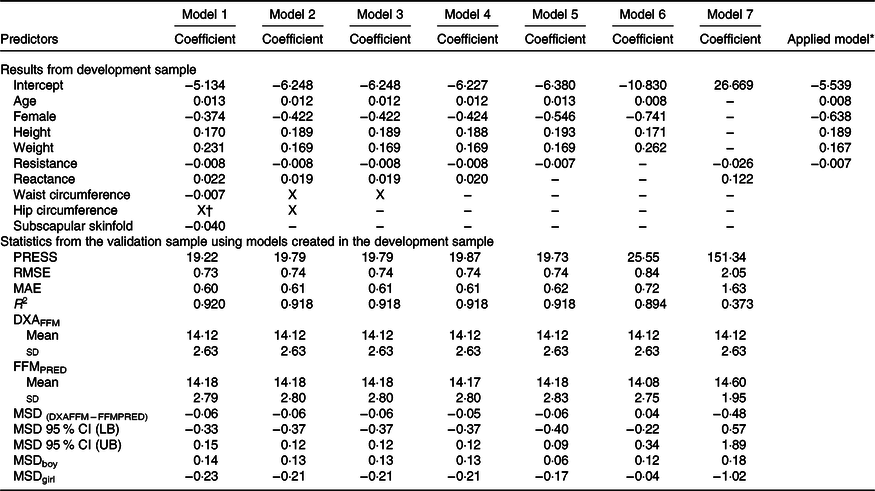
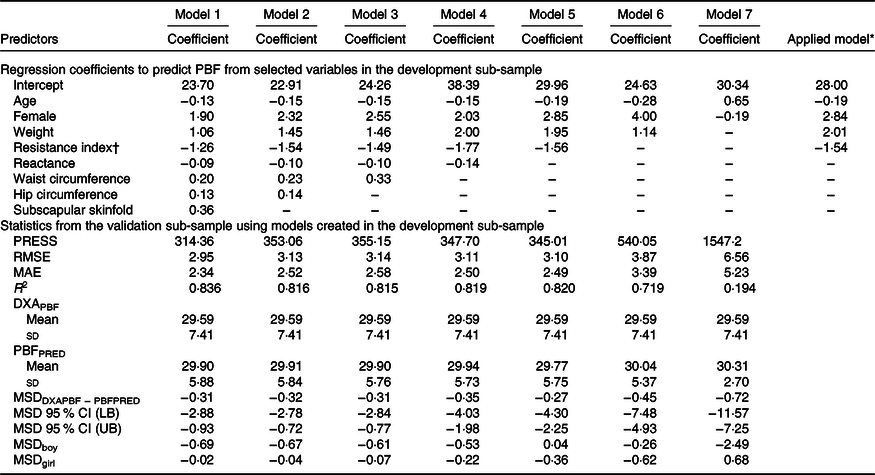
The development of prediction equations for total FM resulted in seven models that were applied to the validation sub-sample as shown in Table 3. Models 6 and 7 had the poorest performance with highest RMSE and MAE and lowest R 2. Although there were modest differences between the RMSE, MAE and R 2 for models 1–5, model 5 performed the best with the least number of parameters (age, sex, weight and resistance index) compared with 5–8 parameters in models 1–4, while maintaining a low RMSE (0·70), low MAE (0·55), high R 2 (0·95) and least difference between FMPRED and DXAFM (0·03 kg). We obtained similar results for FFM (Table 4) with model 5 (using resistance and height instead of resistance index). Results for the development of a prediction equation for PBF are provided in Table 5 in which model 5 also performed the best, but with a lower R 2 (0·82) compared with the model for FM or FFM (>0·90).
Table 3. Prediction models developed for total fat mass (FM) and statistics from the validation sample using novel models in the validation sample of children in Vietnam
(Mean values and standard deviations; coefficient values and 95 % confidence intervals)

PRESS, predicted residual error sum of squares; RMSE, root mean square error; MAE, mean absolute error; DXAFM, FM from dual-energy X-ray absorptiometry; FMPRED, predicted FM; MSD, mean signed difference; LB, lower bound; UB, upper bound.
* Final equation after model 5 was applied to all data. FM = −0·039 × age (months) + 0·501 × female (1) + 0·796 × weight (kg) − 0·385 × resistance index – 0·579.
Table 4. Prediction models developed for total fat-free mass (FFM) and statistics from the validation sample using novel models in the validation sample of children in Vietnam
(Mean values and standard deviations; coefficient values and 95 % confidence intervals)

PRESS, predicted residual error sum of squares; RMSE, root mean square error; MAE, mean absolute error; DXAFFM, FFM from dual energy X-ray absorptiometry; FFMPRED, predicted FFM; MSD, mean signed difference; LB, lower bound; UB, upper bound.
* Final equation after model 5 was applied to all data. FFM = 0·008 × age (months) – 0·638 × female (1) + 0·189 × height (cm) + 0·167 × weight (kg) – 0·007 × resistance – 5·539.
† X: Predictor was excluded by LASSO.
Table 5. Prediction models developed for percentage body fat (PBF) and statistics from the validation sample using novel models in the validation sample of children in Vietnam
(Mean values and standard deviations; coefficient values and 95 % confidence intervals)

PRESS, predicted residual error sum of squares; RMSE, root mean square error; MAE, mean absolute error; DXAPBF, PBF from dual-energy X-ray absorptiometry; PBFPRED, predicted PBF; MSD, mean signed difference; LB, lower bound; UB, upper bound.
* Final equation after model 5 was applied to all data. PBF = −0·19 × age (months) + 2·84 × female (1) + 2·01 × weight (kg) – 1·54 × resistance index + 28·00.
† Resistance index (height in cm2/resistance).
Results by sex are provided in the supplemental tables. There were no significant differences between sex for raw anthropometric measures except waist circumference which was higher in boys than girls (online Supplementary Table S1). Boys also had higher resistance, lower reactance and a higher RI compared with girls. As well, boys had greater LBM and BMD compared with girls.
For sensitivity analyses, we tested different variables for prediction models using height and resistance as two independent variables or as RI. For prediction of FM (online Supplementary Table S2), we obtained models with only slightly higher RMSE and MAE and minimally lower R 2, but larger mean differences between FMPRED and DXAFM. For prediction of FFM (online Supplementary Table S3), the models with RI generated greater mean differences between FFMPRED and DXAFFM compared with models using height and resistance as two independent predictors. In contrast, for prediction of PBF (online Supplementary Table S4), the models with RI generated smaller mean differences between PBFPRED and DXAPBF compared with models using height and resistance as two independent predictors.
Discussion
Given the increased prevalence of the double burden of malnutrition (DBM) in many LMIC, it is imperative that validated techniques be developed to assess body composition in children to better understand the aetiology of the DBM and assess programmes to prevent the DBM. To that end, we successfully developed a prediction equation that allows us to use BIA to obtain accurate estimates of FFM, FM and PBF in a sample of young children in Vietnam. The final equation that included raw data from BIA along with sex, age and body weight predicted FM within 25 g of DXAFM with an R 2 of 0·94 and FFM within 8 g of DXAFFM with an R 2 of 0·93. As well, the prediction equation developed for PBF had an R 2 of 0·82 with that estimated from DXA. It is also important to note that the standard deviations of the absolute values of the predicted FM and FFM compared with DXAFM and DXAFFM were similar, suggesting good agreement between the predicted and actual measures. The correlation between our prediction equations developed in Vietnamese children is similar with studies that used other population-specific BIA prediction equations and reported R 2 between 0·80 and 0·93(Reference Nasreddine, Naja and Hills16,Reference Hoffman, Toro-Ramos and Sawaya29,Reference Diouf, Diongue and Nde30) .
Techniques to estimate body composition in children that are logistically simple for field and survey research have generally relied on skinfold measures and other anthropometric techniques(Reference Gibson34,Reference Lohman36) . Skinfold measurements are found to be predictive of body composition in a diverse population of children with correlation coefficients as high as 0·85–1·00 for DXAFM and DXAFFM, respectively(Reference Wendel, Weber and Leonard40). However, skinfold measures are prone to operator error and can differ by population groups as reported by Hoffman et al.(Reference Hoffman, Sawaya and Martins15) in which three skinfold predictions were found to underestimate PBF by 2–4 percentage points compared with that measured by DXA. Thus, the use of BIA may reduce operator error, but without consistent protocols, bias between BIA and ‘gold standards’ may persist(Reference McLester, Nickerson and Kliszczewicz41–Reference Lee, Liao and Lu43). As well, BIA requires a specific prediction equation to generate the estimate of body composition from the requisite resistance and reactance data of the BIA.
The benefits of BIA are many, but mainly centered around ease of use and the relatively inexpensive equipment compared with DXA or stable isotopes. However, a key challenge for the use of BIA in children has been the lack of universal prediction equations for estimating body composition. To address this issue, investigators throughout the world have developed and validated specific prediction equations for children living in different populations. For example, in a study of Asian neonates, the use of weight, length, sex and RI (height (cm)2/resistance) had an R 2 of 0·90 compared with the FFM estimate from air-displacement plethysmography(Reference Tint, Ward and Soh31). A study of 3-year-old children in Denmark reported the estimation of FFM using weight, height, sum of skinfolds and RI had an R 2 of 0·85 compared with the FFM estimate from DXA(Reference Ejlerskov, Jensen and Christensen44). As well, in a study of 2-year-old multi-ethnic children, RI, weight, height and sex were used to predict FFM with an R 2 of 0·89 compared with the FFM estimate from DXA(Reference Rush, Bristow and Plank45). Finally, in a study of Mexican children, using FFM estimated from 2H dilution compared with a BIA prediction equation that included only RI and weight yielded an R 2 of 0·96(Reference Ramírez, Valencia and Bourges46). Thus, our results, using age, sex, weight and RI, resulted in a R 2 of 0·93 compared with the FFM estimate from DXA are comparable to other studies using similar techniques in different ethnic and geographic groups.
Our findings are consistent with other studies, but some limitations remain that merit discussion. First, the choice of outcome variable is important as it has implications for subsequent uses. For example, we relied on a two-compartment model that estimated FM and FFM and did not consider the contribution of other compartments, such as total body water, that would have required additional assessments, such as isotope dilution, that are more invasive and time consuming. However, DXA is considered a ‘gold standard’ for human body composition that is comparable to three- or four-compartment models of body composition. Second, including key variables that are meaningful and inherently related to the outcome of interest, such as height, weight, resistance, and accompanying skinfold measures, increases the validity, but caution needs to be exercised when such measures may introduce bias and operator error. While a number of other papers on this topic have developed prediction equations that include both height and RI(Reference Tint, Ward and Soh31,Reference Rush, Bristow and Plank45) , we followed the protocol that did not include height in any models that also contained RI(Reference Stevens, Truesdale and Cai28) as doing so overcontrols for the influence of height on the relationship between other variables and the DXA outcome given that it is already accounted for in the RI. Moreover, some anthropometric variables that were dropped in our analyses, such as waist circumference, may still be relevant given they are risk factors for hypertension, elevated TAG and insulin resistance. Yet, it should be noted there are other valid reasons for dropping variables when considering models of similar statistical properties, such as subscapular skinfold measures that required additional equipment the partial removal of clothes, a protocol that may be poorly accepted in many cultures, especially when measuring women and adolescent girls. Third, it has been suggested to correct for the disparity in body composition compartments owing to DXA measures that may underestimate one compartment over the other and estimate total body weights that are not equal to digital scales. We did not use a correction factor as the body weights estimated by DXA were statistically equal to that of the digital scale. Finally, it is important to note that the prediction equations developed in this cohort of healthy Vietnamese children may not be generalisable for other ethnicities but the fact that such equations are not generalisable underscores the need and importance of developing population-specific prediction equations. We tested our equations with another equation developed in a multi-national sample of children(Reference Liu, Byrne and Ma26) that had a much lower R 2 (0·73) compared with ours (0·91) as summarised in online Supplementary Table S5.
Our findings will be useful to better characterise the DBM that is a major public health problem in many LMIC, especially in Asia as well as immigrant groups in many developed countries, such as the USA(Reference Rachmi, Li and Baur5,Reference Khan and Khoi47) . In fact, one study from Vietnam reported that up to 22 % of children were found to be obese(Reference Hoang, Orellana and Le48). As well, improving our understanding of specific biological or environmental factors that promote the DMB remains a priority for research and development programmes. Therefore, developing techniques and research tools to more accurately address the issue of paediatric body composition in LMIC will greatly enhance the ability to address the DMB.
The results of the present study have a number of broad implications for research and policies in LMIC. For example, groups in a number of countries in South East Asia will benefit from this work by having access to accurate estimates of body composition in children. Both national and international organisations need simple and inexpensive methods to better evaluate the impact of programmes that are designed to promote healthy growth and lower the prevalence of childhood obesity. Finally, improving the ability to measure body composition in LMIC sets the stage for improving protocols and programmes to reverse the DBM.
In summary, we developed the first valid and highly predictive equations to estimate FM, FFM and PBF in Vietnamese children using BIA. This work is a major contribution that will allow ongoing research studies and national surveys to better estimate the burden and risks associated with overweight and obesity in young children. There is an urgent need to have these methods to support global efforts to prevent DBM as well as understand changes in body composition that occur over the life course especially in settings experiencing during rapid economic development to design appropriate interventions.
Acknowledgements
The authors would like to acknowledge field team at Thai Nguyen University of Medicine and Pharmacy for their work in field supervision and data collection.
Rollins School of Public Health (RSPH) Dean’s Pilot and Innovation Grant and the New Jersey Institute for Food, Nutrition, and Health.
P. H. N., M. F. Y., L. Q. K., R. M. and U. R. conceived and designed the study and collected all data. P. H. N. and D. J. H. analysed the data and wrote the manuscript, and M. F. Y., L. Q. K., R. M. and U. R. provided editorial input. All authors reviewed and approved the final version of the manuscript.
None of the authors has any conflicts of interest to declare.
Supplementary material
For supplementary material/s referred to in this article, please visit https://doi.org/10.1017/S000711452000241X


