


INTRODUCTION
Mass casualty incidents (MCIs) have become of growing concern in many locations where the occurrence of natural or anthropogenic hazard events is rising. The Florida Department of Health 1 categorizes MCIs by number of expected casualties. They specify categories I through V as having 5 through 10, 11 to 20, 21 to 100, 101 to 1000, and >1000 casualties, respectively. Even smaller MCIs challenge a community’s ability to provide quality patient care, quickly exhausting local rescue and response resources. MCIs may arise from more routine circumstances. For example, under severe weather conditions traffic accidents involving multiple vehicles and possible burn victims are common. Less probable but larger scale MCIs can arise due to human error, as would occur with the release of hazardous materials from a truck or train derailment. Larger MCIs may result from more catastrophic or less localized events, such as hurricanes. The US Federal Emergency Management Agency (FEMA) has identified specific disaster event types that might produce a MCI for which each state must be prepared.
Efficient response by the health care system, especially hospitals, is crucial to mitigating indirect loss of life and life-impacting injuries associated with MCIs. Preparedness steps and modified operational procedures designed for these types of incidents are needed for an efficient response, and are key elements in building resilient communities. Furthermore, techniques for quantifying the benefits of potential strategies for managing MCIs within the hospitals are warranted.
In a MCI, the health care system is faced with an abrupt increase in demand for resource-intensive care. The efficient management of critical resources in the form of staff (medical providers, nurses, etc.), stuff (oxygen, medical air, blood, hospital beds, etc.), and space (emergency rooms, operating rooms, laboratories, etc.) is crucial to meet surge demand requirements. Hick et alReference Hick, Barbera and Kelen 2 listed adaptive operational strategies for space and supply use under conventional, contingency, and crisis circumstances.
Only a few studies quantify hospital performance specific to a MCI.Reference Hick, Barbera and Kelen 2 - Reference Jacobson, Argon and Ziya 4 Of direct relevance is work by Yi et al,Reference Yi, George and Paul 3 who simulate a generic hospital under varying demand-capacity ratios. A few additional works discuss the need for studying the operations of hospitals in MCIs,Reference Comfort 5 , Reference Malavisi, Cimellaro and Terzic 6 and others have conducted case studies to reveal the role of hospitals in close proximity to MCI locations for specific historical events.Reference Aylwin, König and Brennan 7 The literature has yet to tackle the complexities of hospital operations in a MCI. This paper seeks to address this gap.
It is commonly assumed that waiting times for initial service will reach a steady state, after which point observations will reveal little new information. However, in the context of MCIs, nonstationary demand and service disruptions, among other demand and supply-side changes, produce transient time performance over the course of the response phase. Hospital system performance and its evolution over this period are greatly impacted by the initial system state: the number of available resources (eg, nurses, internal general ward [IGW] unoccupied beds, operating rooms [ORs]) and the number of patients waiting to receive services (eg, be admitted to the emergency department [ED], be admitted to an IGW, or be transferred to an OR). This research addresses system performance within the transient period under various initial states given dynamic demand and demand-responsive service capabilities. Few studies in any related field consider this transient system behavior. Those that do relate primarily to communications, supply chain management, and manufacturing.Reference Lin and Cochran 8 , Reference Stolletz and Lagershausen 9
In this paper, a patient-based, resource-constrained model of a generic urban hospital constructed in the Exendsim Simulation Software environment is described. A discrete event simulation modeling approach that uses an underlying queueing network conceptualization of the hospital’s critical units was taken. The modeling approach extends the work that assesses a hospital operating in routine circumstances to MCIs.Reference TariVerdi, Miller-Hooks and Kirsch 10 This approach explicitly recognizes that the performance of the whole hospital depends on the functionality of its units and the specific needs and care paths of the patients. Since services share resources in hospitals, shortfalls in one unit can negatively affect services provided in another unit. Specific to a MCI are patient-flow dynamics, demand management strategies, operational strategies that are responsive to evolving demand patterns and time-varying service capacities, and capacity-expansion actions. These capacity-expansion, demand management, and operational strategies were designed based on in-depth interviews with key hospital personnel and author experience.Reference Whyme, Notobartolo and Sasenick 11 These strategies include modified triage tactics, early-discharge decisions, speed-up in patient care procedures, and omission of some patient care services. In addition to presenting these strategies for efficient surge demand handling in a MCI, modeling adaptations for their replication are presented.
The interviews were conducted over multiple visits in the course of approximately one year at the Johns Hopkins Hospital, Suburban Hospital, and the Johns Hopkins Office of Critical Event Preparedness and Response. The primary sources (in addition to coauthors) included the director of operations and an administrative director of ED/trauma, safety, security and employee health services, among others. Extensive discussions regarding multiple hazard scenarios were held and findings were translated into modeling parameters.
Systematically designed experiments were conducted using this model to investigate the performance of the representative hospital under a range of MCI demand scenarios and response strategies. The experiments aimed to investigate (1) the functionality of a hospital and the impact of proposed capacity-expansion strategies (modifications to operations and alternative standards of care) in bottleneck formation in high-demand circumstances and (2) transient system behavior. The impacts of demand management through diversion of patients to alternative facilities and modified triage were also investigated.
METHODS: HOSPITAL MCI MODELING
The whole-hospital, resource-constrained model for level I and II trauma centers (hospitals) operating under a MCI scenario is described. Trauma level I hospitals are equipped at the highest level (of five levels) to provide total care for all injuries. The model builds on the framework developed in TariVerdi et al,Reference TariVerdi, Miller-Hooks and Kirsch 10 and thus differs not in its technical approach but rather in the details of the operations and patient flows. Modifications to routine operations and standards are proposed, and their potential for improved MCI handling is assessed.
Patients
In a MCI, patient arrival patterns depend on the circumstances of the event and unit service capacities depend on availability of required resources (staff and stuff). As patients arrive at the hospital, they are classified and prioritized based on injury type, severity, and prognosis. To handle a surge in demand for time-critical care, these triage protocols under a MCI differ from protocols implemented in routine circumstances. The outcome directly impacts the number of patients served and the burden on each of the care paths.
From a queuing perspective, within the arrival routine, customers arrive, each carrying individualized service requirements or survival likelihoods. Severity probability distributions typical of the MCI class determine individual patient survival likelihoods and therefore priorities. Survival likelihoods are a nonincreasing function of the time spent waiting for initial critical services based on patient injury category. If circumstances warrant, the lowest priority customers may be turned away without treatment. For customers who are accepted, customer priority, along with injury type, will dictate their assignment to specific care paths. Customers from classes with low priority are assumed to be impatient and may choose to renege if waiting times exceed a threshold.
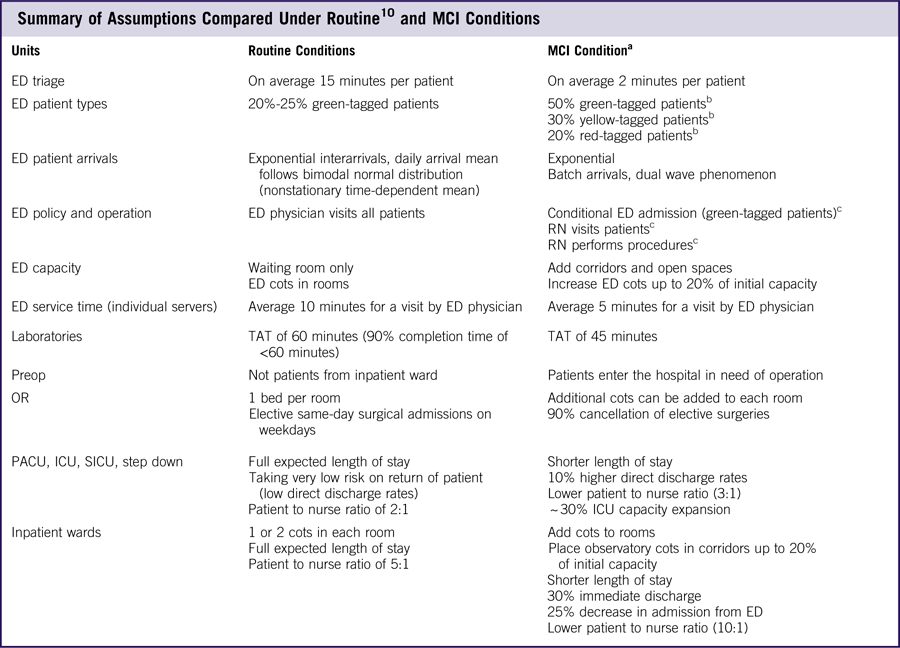
For routine circumstances within the ED, the Emergency Severity Index (ESI) triage protocol 12 is followed. An alternative prioritization scheme may be followed in a MCI when the number of patients entering the hospital in need of time-critical treatment exceeds a hospital’s capabilities. Even before arrival at the hospital, while at the disaster scene, first responders triage the affected population using a rapid triage protocol, such as Simple Triage and Rapid Treatment (START). START classifies patients as having minor (green), delayed (yellow), immediate (red), and sometimes expectant (black; low survival likelihood and high resource needs). 13 Following recommendations in the literature,Reference Paul, George and Yi 14 maximum wait time thresholds are set to 1 to 1.5 hours for immediate patients and 6 to 8 hours for delayed patients. These categories determine how transportation resources at the incident scene are allocated and accelerate the in-hospital triage process (Figure 1A).

Figure 1 (A) Patient Classes at MCI Scene and Arrivals to Hospitals. (B) Dual Wave Phenomenon of MCI Patient Arrival Pattern. 16 Abbreviations : EMS, emergency medical services; ESI, Emergency Severity Index; MCI, mass casualty incidents; START, Simple Triage Rapid Treatment.
At the hospital, patients who arrive by ambulance or are tagged at the scene as immediate bypass the in-hospital triage process. Others, including those who walk in (accounting for approximately 90% of MCI patients), are categorized by injury type based on an Injury Severity Score (ISS) between 0 and 75. The ISS is computed based on affected body regions and severity levels. ISS and injury type determine each patient’s survival likelihood, care path, and probable service times. Alternate classification methods for this purpose have been suggested in the MCI literature.Reference Yi, George and Paul 3 , Reference Durkins 15
In a MCI, casualties can be estimated using disaster planning software, such as PACER or HAZUS-MH. As demand from the incident arises, a drop in routine patient arrivals by 25% during the response period can be expectedReference Kelen, McCarthy and Kraus 17 and is assumed here. Some incident types, such as a pandemic, generate demand for the hospital that increases exponentially or linearly over time; whereas in other incident types, such as no-notice incidents, patient arrivals may increase rapidly but follow what is known as the “dual wave phenomenon” 16 (Figure 1B). These arrival patterns (Figure 1B) are replicated within the arrival routine of the model. Batch arrivals replicate transport of groups of patients from the MCI scene. The patients in these groups are categorized as immediate or minor and arrive to hospital randomly following uniform distributions on intervals [30, 60] and [15, 30] minutes from incident start, respectively. Individual arrivals follow a nonstationary time-dependent Poisson distribution.
Critical Hospital Services
Within the queuing network, nodes represent locations of potential bottlenecks along critical service paths. These bottlenecks occur within hospital units but affect the flow of patients across units. Units included in the model, as shown in Figure 2B, are registration and triage; the ED, including fast-track and trauma units; operation theaters consisting of preoperation (preop) rooms, ORs, and postoperation rooms (postop), such as surgical intensive care units (SICUs), postanesthetic care units (PACUs), and stepdown units; intensive care units (ICUs); and IGWs. Laboratories and imaging, radiology, computed tomographic (CT) scan, and magnetic resonance imaging (MRI), are included in parallel to these units as part of diagnostic services. Specialized medical resources in terms of medical providers, nurses, technicians, and critical medical supplies are also explicitly modeled. For certain MCIs, it may be important to include decontamination units, burn units, or other specialized services. In this model, patient care paths are a function of patient medical needs and MCI-based operational strategies.
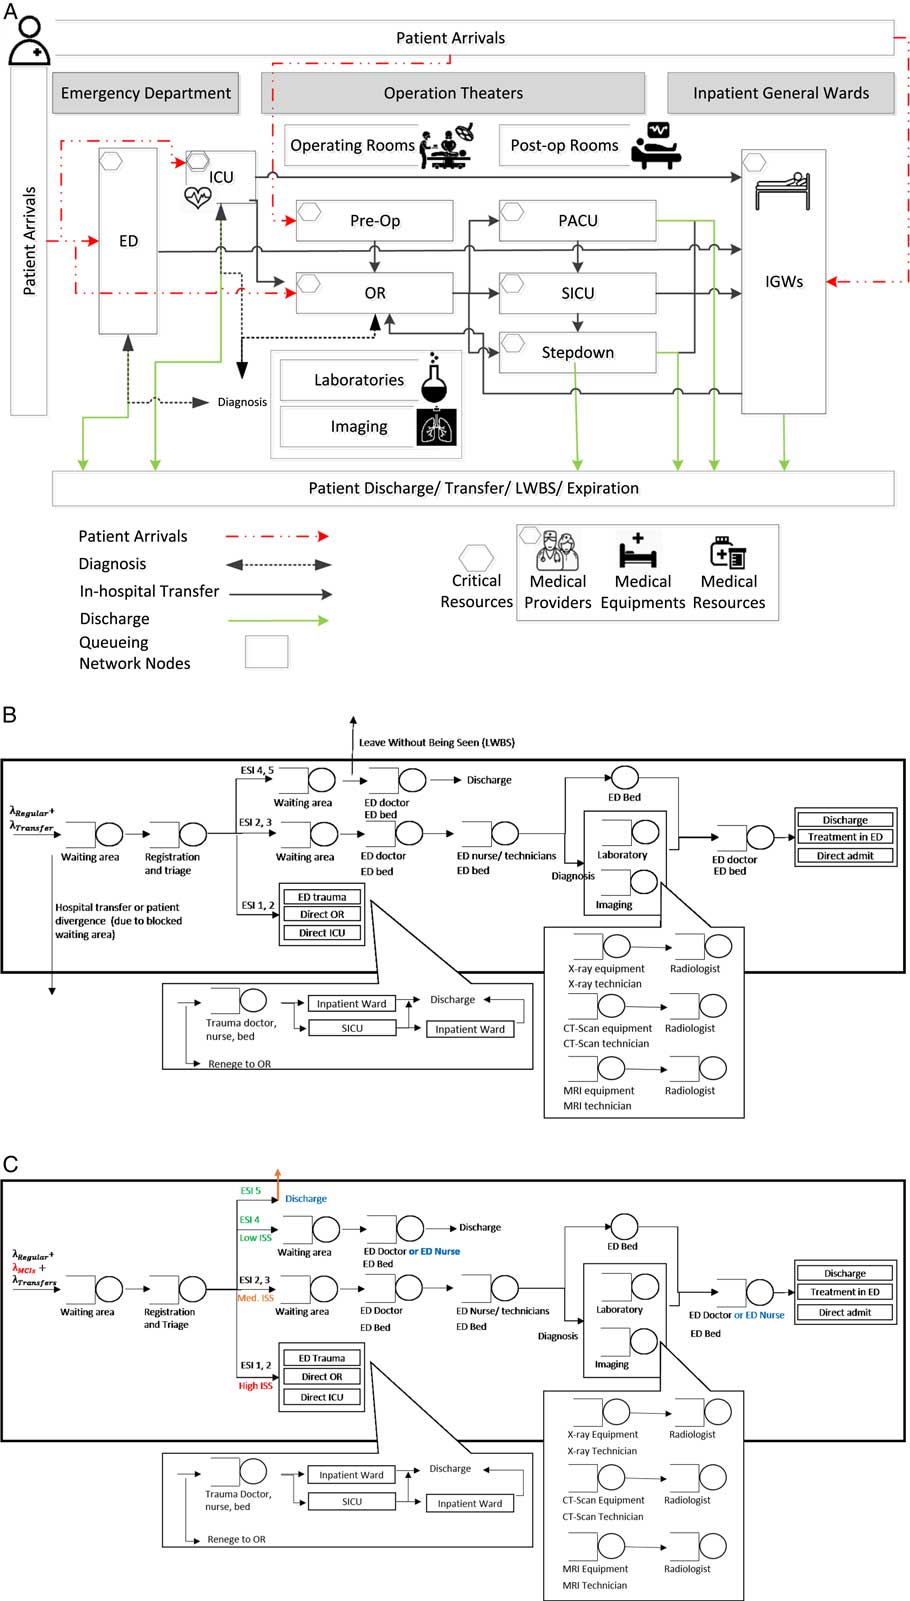
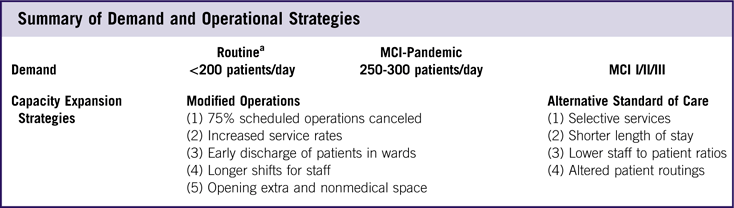
Figure 2 (A) Hospital Patient Flow Model.Reference TariVerdi, Miller-Hooks and Kirsch 10 (B) ED in Routine Conditions.Reference TariVerdi, Miller-Hooks and Kirsch 10 (C) ED in MCI Conditions. Abbreviations: ED, emergency department; ESI, Emergency Severity Index; ICU, intensive care unit; IGW, inpatient general ward; ISS, Injury Severity Score; LWBS, leave without being seen; MCI, mass casualty incident; PACU, postanesthetic care unit; SICU, surgical intensive care unit.
Federal guidelines 16 dictate that health care facilities be self-sufficient for 48 to 96 hours in the aftermath of a MCI. During the crisis period, they must have the ability to reach a 30% increase in service capacity compared with routine operations. To expand the capacity within critical units during a MCI, a hospital may modify its operations or it may, in some circumstances, be able to lower the standards of care. For example, in a MCI registered nurses may be permitted to serve certain patients that doctors would ordinarily treat. Some standards of care are dictated to the hospital and can only be lowered under government directive (ie, state of emergency declaration). Modifications to operations thus serve two purposes: (1) to exploit untapped capacities and (2) to maximize service rates under required standards. Combinations of modifications and alternative standards are referred to herein as capacity-expansion strategies (Figure 2). Such strategies are proposed here and replicated within the models following assumptions described in Table 1.
Table 1 Summary of Assumptions Compared Under RoutineReference TariVerdi, Miller-Hooks and Kirsch 10 and MCI Conditions
Abbreviations: ED, emergency department; ICU, intensive care unit; OR, operating room; PACU, postanesthetic care unit; RN, registered nurse; SICU, surgical intensive care unit; TAT, turnaround time.
a Interview results with Johns Hopkins Hospital (JHH) and other hospitals in the JHH system (JHHS).
b Suggested. 1
c Under state of emergency.
The ED in routineReference TariVerdi, Miller-Hooks and Kirsch 10 and MCI conditions is depicted in Figures 2B and C. Changes to care paths of ESI level 4 and level 5 patients for MCI operations are noted.
Key differences between flows under routine and MCI models can be described with reference to admissions protocols, state-dependent care paths, and changes in service requirements as described in Appendix A. Additionally, information related to model outputs, complete list of monitored queues and patient exit points from the system in form of transfers and expirations (mortalities or hospital failure to stabilize patients in a timely manner) are included in Tables A1 and A2.
Design of Numerical Experiments
Numerical experiments were designed to assess the functionality of a representative, full-service hospital under MCI scenarios for varying demand scenarios under proposed capacity-expansion strategies. Strategies and demand scenarios are synopsized in Table 2.
Table 2 Summary of Demand and Operational Strategies
Abbreviation: MCI, mass casualty incident.
a Using highest demand, consistent with the fall flu season and MCI I, II, & III, corresponding to 10, 20, and 100 MCI patients.
Initial results were obtained to identify the number of runs required to achieve an acceptable error of 0.05 in expected waiting times. To achieve stability in run results while simultaneously accounting for rare events, 50 runs were conducted under each scenario. Each run replicated hospital operations over a multiday, postevent period, where the number of days considered is set to either 2 or 7. While a 2-day period was sufficient to capture the operations immediately following a MCI, 7 days were necessary for a pandemic scenario with multiday impact on demand. Each simulation run, thus, was made over 22 or 27 days, respectively, 20 of which were set as a simulation warm-up period. Data from the warm-up period were not used or reported. Figure 3 reflects this warm-up period for 7-day run results. Thirty-five combinations of modified operations (MOs) and alternative standards of care (ASC) as might be adopted were specified.
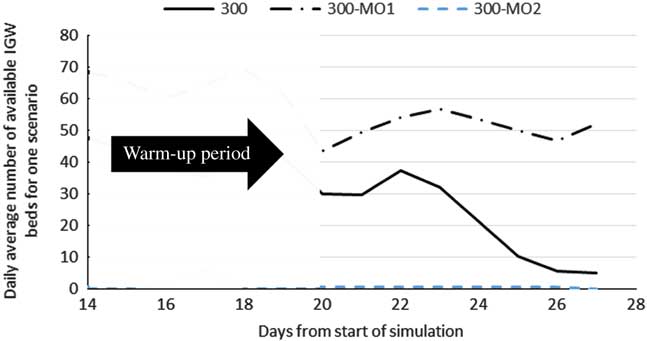
Figure 3 Daily Average Number of Available Inpatient General Ward Beds in MO1 and MO2 in MCI-P Scenarios
The inputs to the representative urban hospital model in terms of size (eg, number of beds, ORs), staffing, operational parameters, routing probabilities, and service times are summarized in Table 3.
Table 3 Design of Representative Hospital with Routing Probabilities and Service Time Distributions for RoutineReference TariVerdi, Miller-Hooks and Kirsch 10 and MCI Conditions
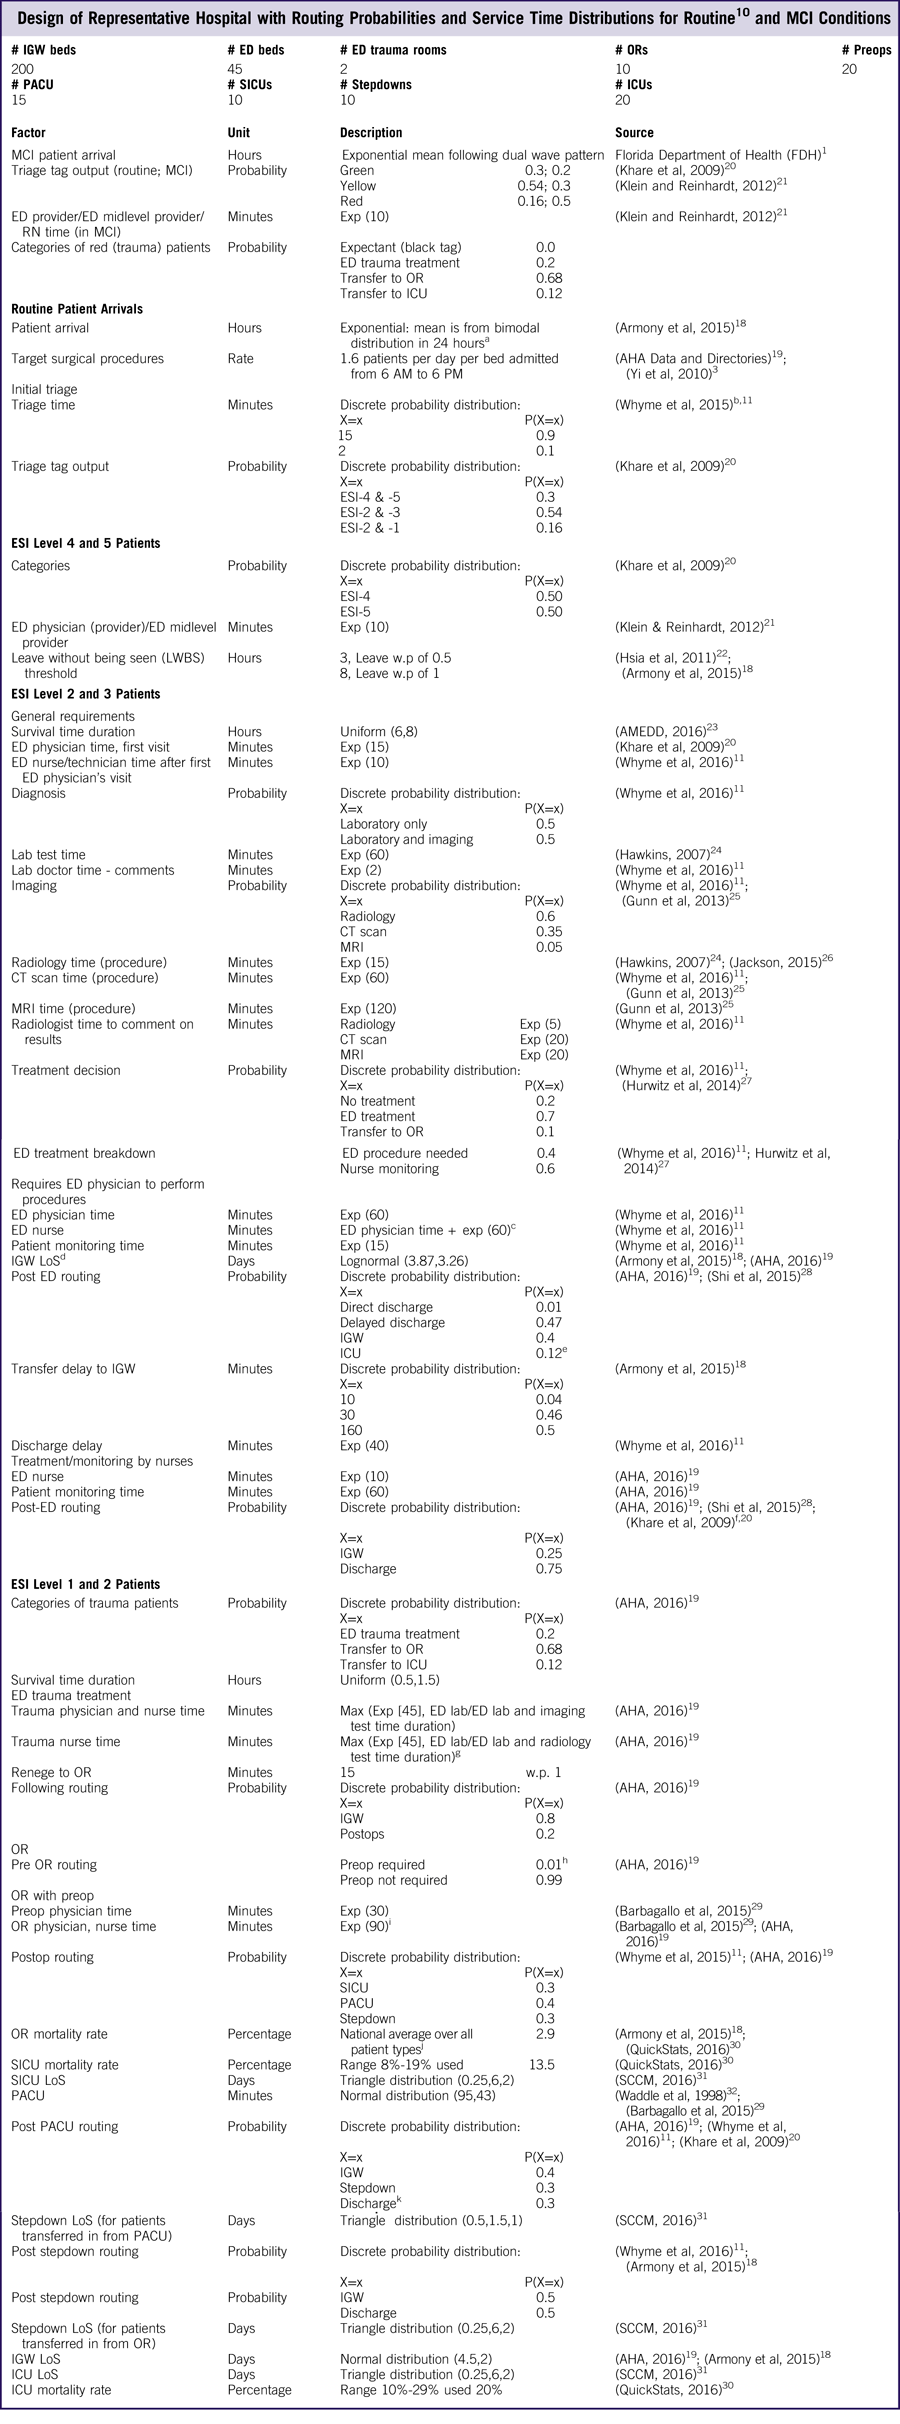
Abbreviations: ED, emergency department; ICU, intensive care unit; IGW, LoS, length of stay; inpatient general ward; MCI, mass casualty incident; OR, operating room; PACU, postanesthetic care unit; preop, preoperation room; postop, postoperation room; RN, registered nurse; SICU, surgical intensive care unit; TAT, turnaround time.
a Sample of patient arrival realization.Reference TariVerdi, Miller-Hooks and Kirsch 10
b Interview results with JHHS.
c Additional ED nurse time is for patient monitoring and transfer preparation.
d ICU and inpatient length of stay are shown to be significantly different between patients in various ISS levels.
e We assumed that 12% of all ED and elective admissions are directed to the ICU. This assumption was based on large-scale studies of ICU utilization and stakeholder feedback.
f Inpatient admission rate is 57% for ESI level 2 and 31% for ESI level 3 patients. Remainder are discharged.
g Nurse remains in charge until patient are released to the next unit or discharged.
h OR preparation for ED transferred patients is completed in ED and during transfer.
i Not including turnaround time.
j Mortality rate can be significant, such as 4.9% for cardiovascular patients, or as low as 0.92% for orthopedic surgeries.Reference Bhattacharjee and Ray 33
k PACU-discharge patient path corresponds to same-day/outpatient surgery. Patients in PACU-stepdown and OR-stepdown paths that are released less than 24 hours after surgery contribute to about 60% of OR patients as estimated for 2013 US community hospitals. 19
The output from 50 modeled queues in the runs were monitored to evaluate hospital performance under combinations of demand inputs and capacity-expansion strategies. Average and maximum waiting times, number of patients in the queues, and queue lengths were collected for analysis. Commonly used metrics from routine operations may not be well-suited to MCI analyses. Instead, mortality and number of patients for which the hospital failed to provide timely service were computed. Because the physical condition of each patient changes over time and depends on services provided, individual probabilities of mortality change as the simulation progresses. Mortality was presumed from patient survival likelihoods given injury type and severity and whether the patients successfully received services in the simulation runs within a critical time period.
RESULTS AND DISCUSSION
Results from the 7000 runs were obtained and analyzed. Reasonableness of the designed representative urban hospital and general modeling approach was assessedReference TariVerdi, Miller-Hooks and Kirsch 10 under routine conditions. Initial MCI model run results were discussed with emergency managers,Reference Whyme, Notobartolo and Sasenick 11 and the model was further tuned to incorporate elements that were not initially identified as key. The best capacity-expansion strategies were identified. Moreover, incident time-of-day impacts and resulting dynamic effects on waiting times were investigated. This section contains results of observed queues in which significant changes were identified.
Results
A baseline was created from results of runs for a demand of 200 ED patient arrivals per day with morning and afternoon peaks with higher wait times, as is typical of similarly sized, busy urban hospitals known to operate close to their capacities.Reference Armony, Israelit and Mandelbaum 18 Incidents falling under three MCI classes are replicated:
(1) MCI-P: an increase in the total number of patients per day by up to 100 patients to replicate seasonal effects from, for example, flu season and more severe conditions of a pandemic.
(2) MCI-I and MCI-II: a one-time increase in arrivals of 10 or 20 red (critical) patients to replicate a MCI I or II, respectively; such MCIs might occur in a rail transportation accident, for example.
(3) MCI-III: a dual wave arrival on day one of 100 MCI patients following patient types described in Table 3 and arrival pattern shown in Figure 1B for a high-casualty MCI III event.
MCI-P
The discrete event simulation model outputs are processed to obtain 7-day average patient throughput, number of transfers, and number of green patients who leave their queues without being seen (LWBS) under demand scenarios with total daily patient arrival rates of 200, 250, or 300 and routine operations and standards of care. Analysis of these outputs indicates that average waiting times are not significantly impacted by a surge in demand at this level. However, the number of transfers from the ED, number of patients diverted to another hospital upon arrival (ie, hospital refusals), and LWBS cases increased sizably.
Detailed study of waiting times along specific patient care paths revealed that the less severe patients (ESI levels 4 and 5) bare the cost of the surge through increased, often unacceptable waiting times and decreased throughput as a result of transfers. With an increase of 50 patients daily, the capacity of the waiting area for these patients was exceeded as indicated by increased waiting times at registration, high number of hospital transfers, and slight increase in LWBS cases. A sharp rise in waiting times was also noted for severely injured patients (ESI levels 1 and 2) in need of ICU or MRI equipment for diagnoses. These unmet needs greatly affect surgery theater throughput, putting patients at further risk.
Average performance improvements gained through capacity-expansion strategies (Figure 2) under the MCI-P scenario with a 100 daily patient increase are given in Table 4.
Table 4 7-Day Average Performance Improvements Under Capacity Expansion Strategies for MCI-P
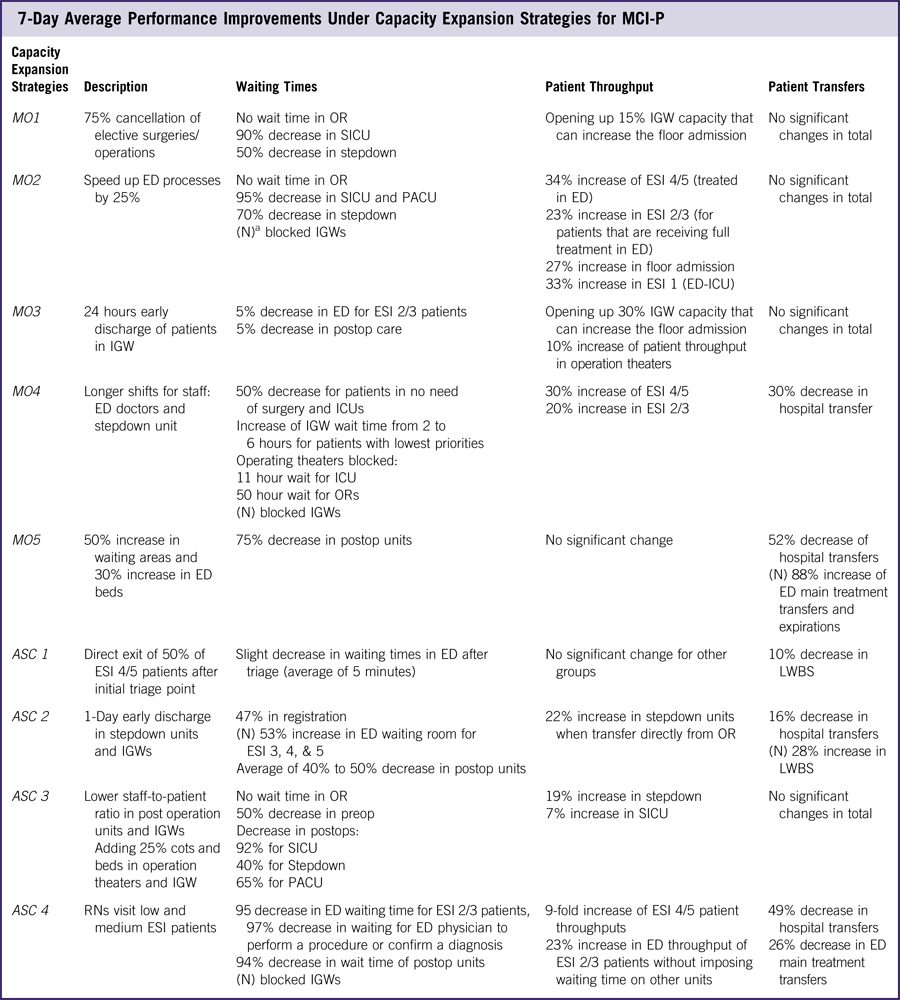
Abbreviations: ED, emergency department; ESI, Emergency Severity Index; ICU, intensive care unit; IGW, inpatient general ward; LWBS, leave without being seen; MCI, mass casualty incident; MCI-P, an increase in the total number of patients per day by up to 100 patients to replicate seasonal effects from, for example, flu season and more severe conditions of a pandemic; OR, operating room; PACU, postanesthetic care unit; preop, preoperation room; postop, postoperation room; RN, registered nurse; SICU, surgical intensive care unit.
a (N) indicates statistically significant negative impact.
Results from Table 4 show improvements that are not necessarily proportional to the capacity changes incurred through expansion strategy implementations. Further, they indicate that an expansion strategy aimed at a particular hospital unit may have negative or positive secondary effects on other units. By example, the canceling of 75% of elective surgeries (MO1) eliminated OR waiting times and decreased postop waiting times by more than 90%, but simultaneously released only 15% of the beds in the IGWs. Effects of expansion strategies transcend the units they targeted. In the experiments, speeding up processes in the ED (MO2) increased throughput in the ED itself, but simultaneously improved functionality of operation theaters and decreased bed availability in the IGWs (Figure 3). The improvement in the functionality of the operation theaters resulted from increased ED efficiency, which further decreased the probability that patients reach a critical state requiring that they be transferred to the higher acuity care paths that include operations. As patients clear the ED, more patients will be admitted to the hospital, leading to higher inpatient admission numbers and lower IGW bed availability.
As the impact of each capacity-expansion strategy extends beyond its specific target, predicting the effects across the hospital of combined strategies is difficult. For insight into the effectiveness of combining strategies, two capacity-expansion strategies were considered simultaneously under the MCI-P scenario: MO2 and ASC4. These were chosen to address bottlenecks noted along patient care paths. These modifications specifically target bottlenecks in lab test result interpretation and ED procedures that rely on available ED physicians. Each strategy alone creates marked improvements. For example, MO2 and ASC4 each led to an increase in throughput of ESI level 4 and level 5 patients by approximately 30% and 40%, respectively. When combined, effect was a tenfold increase in throughput of the same patient categories. An added benefit is a combined effect of decreased hospital transfers and LWBS cases by roughly one-half. It is noteworthy that when implemented separately, there was no significant impact on LWBS cases and only ASC4 resulted in improvements in hospital transfers. A negative consequence, however, of this combination is that it led to an increase in waiting time for the OR by blocking the IGWs and postop units. It might be more effective and less deleterious to add staffed beds to the IGWs. Other examples of superadditive impacts of combined strategies were observed and included in Appendix B.
MCI-I and MCI-II
To analyze the impact of a MCI I or MCI II on hospital performance under routine operations and standards of care, 2-day performance measure averages were recorded. From these results it was noted that, while the additional 10 critical patients did not affect overall ED performance, all needed surgery, and thus waiting times in the ORs increased from less than 5 minutes to 100 minutes. It is recommended in military triage guidelines that waiting times for this class of patients not exceed 90 minutes. The model thus will choose to transfer the patients whose expected waiting times exceed this limit. Consequently, in the MCI-II case, no further increase in waiting times at the ORs was noted. Additional performance loss was observed in the postop units, which suffered from a doubling of waiting times and an increase of 300 minutes in average transfer times from the OR to the stepdown unit and an increase of 417 minutes in average transfer times from the PACU to the stepdown unit. The important role of well-functioning trauma rooms in stabilizing critical patients was also noticeable.
For MCI-I or MCI-II, capacity-expansion strategy MO1 (canceling elective surgeries) was found from the experiments to provide the needed OR capacity to handle the extra critical patients for these incident scenarios. A less intrusive version of MO1, in which surgery patients who arrived at the hospital prior to the MCI are moved from preop to the IGWs so that their surgeries can be delayed until after the MCI patients are served, was tested. This adapted MO1 strategy eliminated OR waiting times and reduced average waiting times in postop units; the average SICU, PACU, and stepdown waiting times dropped by 62%, 60%, and 42%, respectively.
MCI-III
Results for 100 additional MCI patient arrivals to the hospital following the dual wave phenomenon (explained in Methods) under routine operations and standards of care indicate an untenable situation. The main entry point to the hospital for all patient types, including those arriving by ambulance, quickly became blocked, patients were diverted, and LWBS cases rose sharply. There was also an increase in ED waiting times. Surprisingly, however, the waiting times in the operation theaters was not as great as they were for the MCI-I and MCI-II scenarios, perhaps due to the dual-wave arrival pattern in which the critical patients arrivals are more spaced out over time.
ASC3 and MO1 capacity-expansion strategies can be combined to increase ED capacity. The results of runs aimed at testing this hypothesis showed an acceptable increase in waiting times in the ED for a significant improvement or even elimination of waiting times for the ORs, SICU, and stepdown unit.
Timing and Dynamics
Experimental results discussed thus far assumed that the first incident-related arrival would occur at noon. Additional runs under both MCI-II and MCI-III scenarios were conducted with an incident occurrence near midnight. Overall, nighttime waiting times for the ORs were comparatively low as there are no scheduled operations, and patient processing times were generally higher. Results in Figure 4 also indicate that an incident arising at noon would lead to higher peak waiting times, despite faster patient processing. Consequently, the average mortality rate is expected to be greater (2.7 versus 0.67 patients per day) for an incident arising at noon as opposed to midnight.
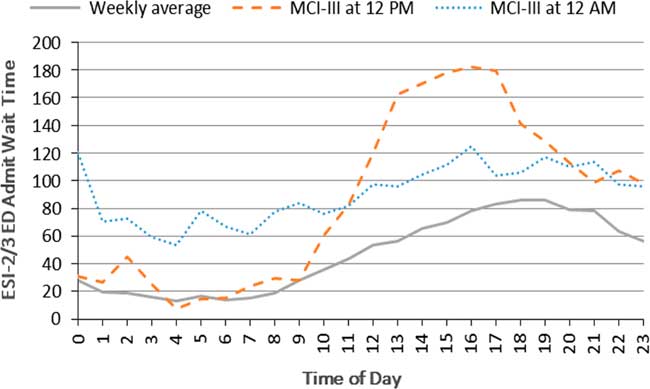
Figure 4 Hospital Functionality Over 24 Hours of the Transient Period (Day 1 Following the MCI III). Abbreviations: ED, emergency department; ESI, Emergency Severity Index; MCI, mass casualty incident.
CONCLUSIONS
Several important observations were made from analysis of the numerical run results and proposed capacity-expansion strategies. First, response capability depends on not only the number of critical patients but their arrival pattern and injury types. A hospital can better serve a larger number of critical patients if they arrive over time than it can fewer critical patients arriving all at once. Such insights can be used in regional response planning and can help a hospital in choosing between potential capacity enhancement options depending on its trauma response capability. For example, for a trauma level I hospital it might be best to increase the number of IGW beds to free up space in the ED and ORs, whereas for a trauma level III hospital, enhancing the capacity of the ED directly could better enhance response. Additionally, the modeling approach proposed here reveals that capacity-expansion strategies, such as increasing the number of ED beds, may not be effective without concomitant enhancements to other facilities or increases in indirectly related resources. Second, the results show that capacity enhancement plans, when combined, can have a superlinear impact if paired carefully. In fact, only 2 to 3 enhancement types were needed to reach acceptable service levels for suitable combinations.
A third observation, a critical point for hospital bottleneck analysis, is that the longest wait times were not necessarily found at bottlenecks, but often were noted at the entry to downstream services. Analysis steps taken in this work can be replicated to find the initial point of bottlenecks in hospital patient flows. Fourth, the model run results indicate that implementing strategies of alternative standards of care was more effective in improving hospital performance than implementing strategies that would modify operations. Allowing nurses to handle low–injury class patients and early discharge strategies were found to be the most effective of such changes in standards. The effects of such strategies on long-term patient wellness (ie, 30-day return risk) needs further study. Finally, and more generally, the results show the criticality of taking a holistic view of hospital functionality in terms of both interactions along patient care paths that cross units and medical staff and resource availability and constraints.
The accuracy with which the model replicates a specific hospital, and thus estimates its performance, is a function of how well it simulates actual conditions in terms of not only demand, space, physical resources, and processes, but actions and decisions of the hospital personnel. To calibrate the model accordingly will require observation of the hospital and its functionality under rare events.
This work highlights minimum required information to monitor hospital functionality and captures the dependencies between those elements in MCI conditions that would help hospitals with different sizes to replicate and rebuild the model. The proposed modeling framework could also serve within a real-time forecasting tool for predicting next period resource needs and capacity requirements. Predictions can be employed to choose appropriate capacity enhancement modifications, changing priorities, or demand management strategies (eg, redirecting patients) and forecast their effectiveness as compared to the costs and difficulties associated with their implementation.
Funding
This work was funded by the National Science Foundation. This support is gratefully acknowledged, but implies no endorsement of the findings.
Supplementary material
To view supplementary material for this article, please visit https://doi.org/10.1017/dmp.2018.4


