


Evidence of the relationship between dietary sugars and adverse health outcomes has caused sugars to become a subject of public health concern(Reference Moynihan and Kelly1–Reference Malik, Pan and Willett7). In 2015, the WHO released a sugars intake guideline recommending a reduction of dietary free sugars(8) based on evidence that a diet high in free sugars would lead to weight gain (low- and moderate-quality evidence) and dental caries (very-low- and moderate-quality evidence)(Reference Moynihan and Kelly1,Reference Te Morenga, Mallard and Mann2) . Free sugars are defined by the WHO as ‘monosaccharides and disaccharides added to foods and beverages by the manufacturer, cook or consumer, and sugars naturally present in honey, syrups, fruit juices and fruit juice concentrates’(8). Free sugars are, therefore, predominantly found in non-nutritive energy-dense foods such as sugar-sweetened beverages (SSB) and confectionary(Reference Lei, Rangan and Flood9). The WHO guideline strongly recommends that free sugars intake be reduced to <10 % of total energy (TE) intake(8), the equivalent of approximately twelve teaspoons of sugar per day for adults. The WHO made a further conditional recommendation that intakes be reduced to <5 % TE for additional health benefits(8).
Nationally representative dietary surveys from several high-income countries have indicated typical free sugars intakes exceeding the WHO recommendations, including the Netherlands (14·2 % TE)(Reference Sluik, van Lee and Engelen10), Australia (11·7 % TE)(Reference Lei, Rangan and Flood9), the UK (12·3 % TE from non-milk extrinsic sugars)(11) and the USA (14·6 % TE from added sugars)(Reference Welsh, Sharma and Grellinger12). Similarly, recent analyses using 2008/2009 NZ Adult Nutrition Survey (NZANS) data have found that New Zealand (NZ) adults (over 15 years) consume more free sugars than the WHO guidance (median intake 57 g/d or 11 % TE, the equivalent of 14·3 teaspoons of sugar)(Reference Kibblewhite, Nettleton and McLean13). The majority (58 %) of NZ adults do not meet the <10 % WHO recommendation(Reference Kibblewhite, Nettleton and McLean13). However, this figure likely underestimates the true free sugars intake of NZ adults; an estimated 21 % of men and 25 % of women underreported energy intake in the NZANS(Reference Gemming, Jiang and Swinburn14), and it is likely that underreporting was exacerbated for foods containing free sugars as individuals are more likely to underreport energy-dense foods(Reference Gemming and Ni Mhurchu15).
New Zealand has the third highest adult obesity rate among countries in the Organisation for Economic Co-operation and Development (OECD)(16), and almost one in three (32 %) NZ adults and one in eight (12 %) children are now obese(17). This is an increase from 27 % of adults and 8 % of children in 2006/2007(17). The increasing prevalence of obesity has occurred in parallel with greater availability of total sugars in NZ, which increased from approximately 135 g per capita per day in 1982/1984 to 160 g per capita per day in 2000/2002(18). Dental decay also remains the most prevalent chronic disease in NZ(19). The 2009 NZ Oral Health Survey reported that dentate NZ adults had a mean of fourteen decayed, missing or filled teeth, and one in three dentate adults (35 %) had untreated coronal decay (decay on the visible crown of the tooth)(19).
It is evident that interventions and policies are urgently required to reduce dietary free sugars. Such interventions would benefit from focusing on both dietary patterns, that is, the way in which foods and beverages are combined to form a complete diet(Reference Hu20), and specific foods where consumption could be reduced or products reformulated. The causes of obesity and dental caries are multifactorial, and dietary risk factors are additive in their effects(Reference Selwitz, Ismail and Pitts21). Consequently, it is unlikely that disease prevalence can be attributed solely to one food or beverage. Dietary pattern analysis is, thus, advantageous as it acknowledges that nutrients such as free sugars are not consumed in isolation(Reference Hu20,Reference Hodge and Bassett22) . Additionally, dietary patterns may be easily translated into population dietary guidelines, and educational interventions as food-based recommendations are more easily understood and adopted by the general public than single-nutrient recommendations(Reference Hu20). Focusing on dietary patterns has, thus, been suggested as the most effective method for achieving dietary guidelines(Reference Hu20).
Our primary aim was, therefore, to determine the dietary patterns associated with meeting the WHO free sugars guideline (<5 and <10 % TE). Secondary aims were to determine the dietary patterns associated with moderate and high intakes of free sugars, and whether dietary patterns low, moderate or high in free sugars differ by sex, age or ethnicity.
Methods
Study design and population
NZANS, NZ’s most recent national nutrition survey, was conducted between October 2008 and October 2009. A full report of the NZANS methodology can be found on the Ministry of Health website(23). Briefly, 4721 NZ adults over 15 years living in permanent private residences were recruited, with sufficient sampling of Māori (Indigenous New Zealanders), Pacific Islanders, and younger and older age groups to produce robust data for all major ethnic and age groups. A multi-stage, stratified, probability-proportional-to-size sample design was used. Survey weights were developed to ensure results were representative of all NZ adults. Trained interviewers collected dietary data during face-to-face 90-min interviews administered in participants’ homes using a computer-based multiple-pass 24-h diet recall. Researchers distributed interviews across all days of the week. To allow for the estimation of usual intake of nutrients, a repeat 24-h diet recall was conducted on a random subsample of 25 % of participants (n 1180).
Data preparation
Prior to analysis, the thirty-three initial NZANS food groups(24) were adapted into thirty-four new food groups, which would produce easily interpretable dietary patterns associated with free sugars intake (Table 1). For example, ‘non-alcoholic beverages’ were separated into ‘low-sugar beverages’ and ‘sugar-sweetened beverages’ on the basis of whether or not the mean total sugar content of a particular subgroup met the cut-off for the lower rate of the UK Soft Drinks Industry Levy (drinks containing added sugars with a total sugar content ≥5 g/100 ml(25)). The food groups ‘beef and veal’, ‘lamb and mutton’, and ‘pork’ were aggregated into an overarching ‘red meats’ food group based on health outcomes associated with red meat consumption(Reference Forouzanfar, Alexander and Bachman26).
Table 1 Food groups used in dietary pattern analyses
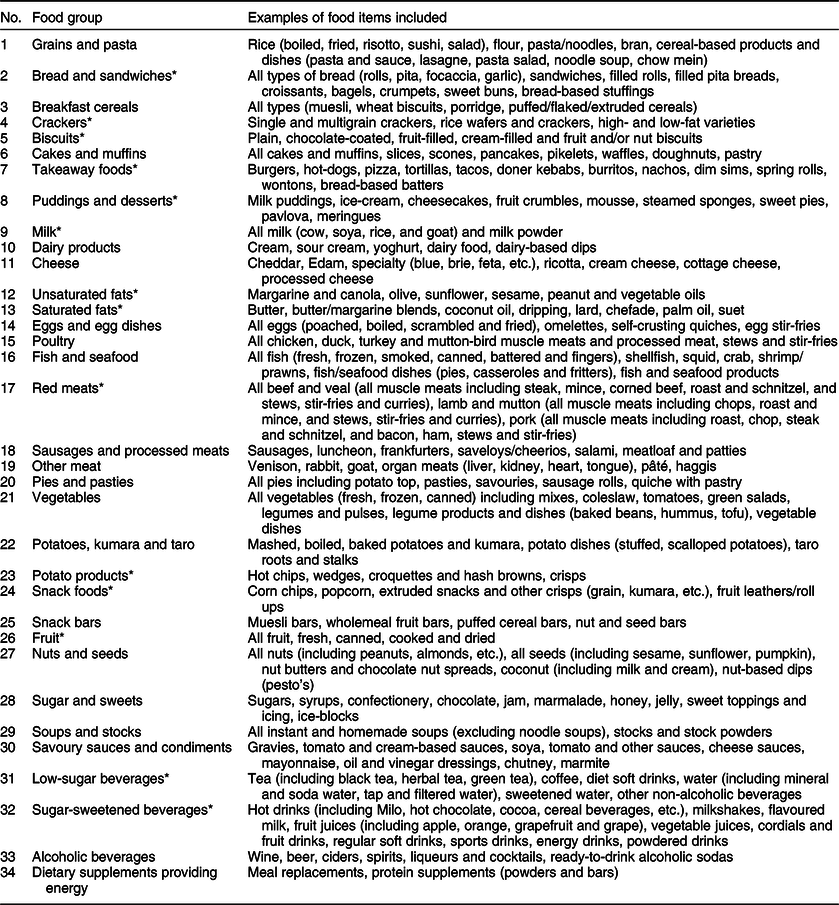
* Food groups differ from original food groups in the New Zealand Adult Nutrition Survey.
Usual dietary intake, rather than a single day’s dietary intake, was used in the present study to account for intraindividual variability. To determine usual intake, participants’ intakes of each food group were adjusted using repeat 24-h diet recall data and the Multiple Source Method (MSM)(Reference Harttig, Haubrock and Knüppel27). Analyses were performed by sex, and it was assumed that all participants were habitual consumers of each food group in the absence of FFQ data.
Derivation and analysis of dietary patterns
Following a literature review of the strengths and limitations of a posteriori dietary pattern derivation methods(Reference Steele28), no one method appeared better than another. Principal component analysis (PCA) was selected as the most appropriate method to derive dietary patterns in the present study. PCA is a data reduction technique in which x correlated foods or food groups are entered and transformed to produce a smaller number of y uncorrelated variables(Reference Varraso, Garcia-Aymerich and Monier29). The uncorrelated variables produced are components that represent unique dietary patterns.
PCA was conducted on usual dietary intake (g/d) for the thirty-four food groups using the survey-weighted correlation matrix. The Kaiser–Meyer–Olkin measure of sampling adequacy (0·57; >0·5 acceptable) and Bartlett’s test of sphericity (P < 0·001; P < 0·001 acceptable) were used to ensure that correlation within the dataset was adequate for performing PCA. Resulting components were retained on the basis of having an eigenvalue >1·0, their position on a scree plot (before an ‘elbow’) and their interpretability. An orthogonal varimax rotation was used to improve the interpretability of components(Reference Varraso, Garcia-Aymerich and Monier29,Reference Michels and Schulze30) . Rotated components were named based on food groups with component loadings >±0·2. Component loadings depict correlations between each food group and dietary pattern. Food groups with a component loading >+0·2 or >–0·2 for a particular dietary pattern positively or negatively characterised that pattern respectively, indicating high or low intakes of the food group for participants adhering to the pattern. The larger the positive or negative component loading, the more meaningfully that food group characterised the dietary pattern.
Component scores were extracted as standardised values with a mean of zero and variance of one. Component scores, indicating how closely a participant adhered to a particular dietary pattern, were adjusted for in all logistic regression models. PCA does not produce mutually exclusive dietary patterns. Therefore, participants received a component score for each of the retained dietary patterns, with half of the population receiving positive scores and half receiving negative scores.
Statistical analyses
Stata/IC 15.0(31) was used to conduct all statistical analyses, except for the estimation of usual intake of nutrients where MSM was used. All survey data, except for specified sociodemographic data presented in Table 2, were weighted, and survey commands were used to produce proportions, medians, percentiles, OR and 95 % CI. Subpopulation commands were used for estimates by sex, age group (≤30 and >30 years) and ethnicity (Māori, Pacific, or New Zealand European and other (NZEO)). Prioritised ethnicity was used with the following order of prioritisation: Māori, Pacific and NZEO. When stratifying the population by sex, age, ethnicity or free sugars intake, it was ensured that there were a sufficient number of participants in each stratum (defined as n ≥ 30(24)) to produce robust results.
Table 2 Unweighted and survey-weighted characteristics of the 4721 participants in the New Zealand Adult Nutrition Survey
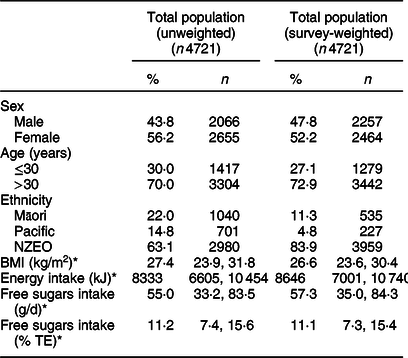
NZEO, New Zealand European and other; TE, total energy.
* Median (25th, 75th percentiles).
Total intakes of free sugars were calculated in 2017 by Kibblewhite et al. (Reference Kibblewhite, Nettleton and McLean13) for all foods and beverages consumed by NZANS participants based on the methods outlined by Louie et al. (Reference Louie, Moshtaghian and Boylan32). Free sugars were defined in the study by Kibblewhite et al. (Reference Kibblewhite, Nettleton and McLean13) and in the present study using the WHO definition of ‘monosaccharides and disaccharides added to foods and beverages by the manufacturer, cook or consumer, and sugars naturally present in honey, syrups, fruit juices and fruit juice concentrates’(8). Total consumption of free sugars was used to categorise each participant as meeting the <5 or <10 % WHO free sugars guidelines or not meeting the WHO guidelines. Maximum-likelihood logistic regression models were subsequently fitted to determine which of the resulting dietary patterns were associated with meeting the <5 and <10 % WHO free sugars guidelines. The dichotomous dependent variable used in each model indicated whether participants met or did not meet the <5 or <10 % WHO free sugars guideline. Models were adjusted for sex, age, prioritised ethnicity and component score for all derived dietary patterns. OR (and 95 % CI) were calculated for the total population and by sex, age and prioritised ethnicity.
Results
Sociodemographics
Table 2 describes the unweighted and survey-weighted characteristics of the 4721 NZANS participants. Unweighted values depict characteristics of the NZANS study population. Survey-weighted values depict characteristics of the NZ population. Compared with the total NZ population, the study population comprised a slightly higher proportion of females (56 v. 52 %) and adults ≤30 years (30 v. 27 %), and oversampled Māori (22 v. 11 %) and Pacific (15 v. 5 %).
Table 3 shows the proportion of survey participants who met the <5 % TE free sugars guideline (low free sugars), met the <10 % TE but did not meet the <5 % TE free sugars guideline (moderate free sugars), and who met neither (high free sugars). Less than one in eight (12 %) met the <5 % WHO guideline, and fewer than one in three (42 %) met the <10 % WHO guideline.
Table 3 Survey-weighted proportion of participants meeting the WHO <5 % and <10 % TE free sugars guideline and not meeting the guideline by sex, age and prioritised ethnicity
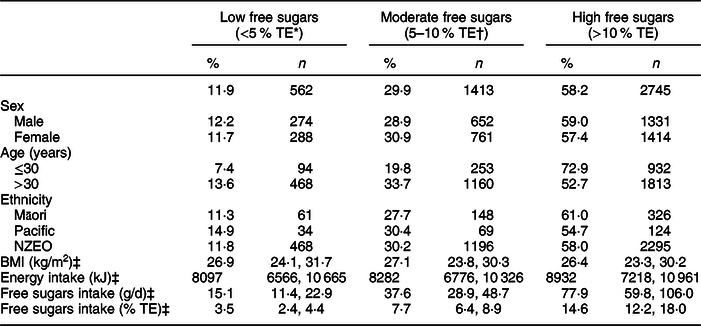
TE, total energy; NZEO, New Zealand European and other.
* Free sugars intake <5 % TE, that is, met the <5 % WHO free sugars guideline.
† Free sugars intake ≥5 % TE but <10 % TE, that is, met the <10 % WHO free sugars guideline only.
‡ Median (25th, 75th percentiles).
A significantly higher proportion of adults >30 years met the <5 and <10 % WHO free sugars guidelines (14 and 34 %, respectively) than adults ≤30 years (7 and 20 %, respectively) (Table 3). No significant differences were seen by sex or ethnicity. Participants consuming a diet high in free sugars had a significantly higher mean energy intake than participants with diets moderate or low in free sugars. Median BMI did not significantly differ between NZ adults consuming a diet low, moderate or high in free sugars.
Dietary patterns
Eight dietary patterns were identified using PCA (Table 4), which explained 34 % of the total variance in food group intake. Dietary pattern 1 was a ‘sandwich’ pattern characterised by high intakes of bread and sandwiches, unsaturated fats (including margarine), cheese, red meat and sugar and sweets (including sweet spreads). Pattern 2 was termed ‘fast foods, SSB and desserts’ and was characterised by high intakes of SSB, takeaway foods, puddings and desserts and pies and pasties, and low intakes of vegetables, low-sugar beverages and fruit. Pattern 3, ‘traditional’, was characterised by foods commonly associated with NZ culture, including high intakes of potatoes, kumara and taro, savoury sauces and condiments, vegetables, red meats, puddings and desserts, cakes and muffins, and low intakes of soups and stocks and dietary supplements. Pattern 4 was termed ‘takeaway foods and alcohol’ and was characterised by high intakes of potato products, fish and seafood, alcoholic beverages and takeaway foods, and low intakes of soups and stocks. Pattern 5 was termed ‘breakfast foods’ and was characterised by high intakes of milk, breakfast cereals, sugar and sweets, puddings and desserts and cakes and muffins, and low intakes of alcoholic beverages and eggs and egg dishes. Pattern 6 was termed ‘snack foods’ and was characterised by high intakes of snack bars, cheese, crackers, dairy products and fruit. Pattern 7 was termed ‘saturated fats and sugar’ and was characterised by high intakes of saturated fats, cheese and sugar and sweets, and low intakes of unsaturated fats and nuts and seeds. Pattern 8 was termed ‘contemporary’ and was characterised by high intakes of grains and pasta, poultry, snack foods, nuts and seeds and low-sugar beverages, and low intakes of biscuits.
Table 4 Rotated component loadings for food groups included in the eight identified dietary patterns
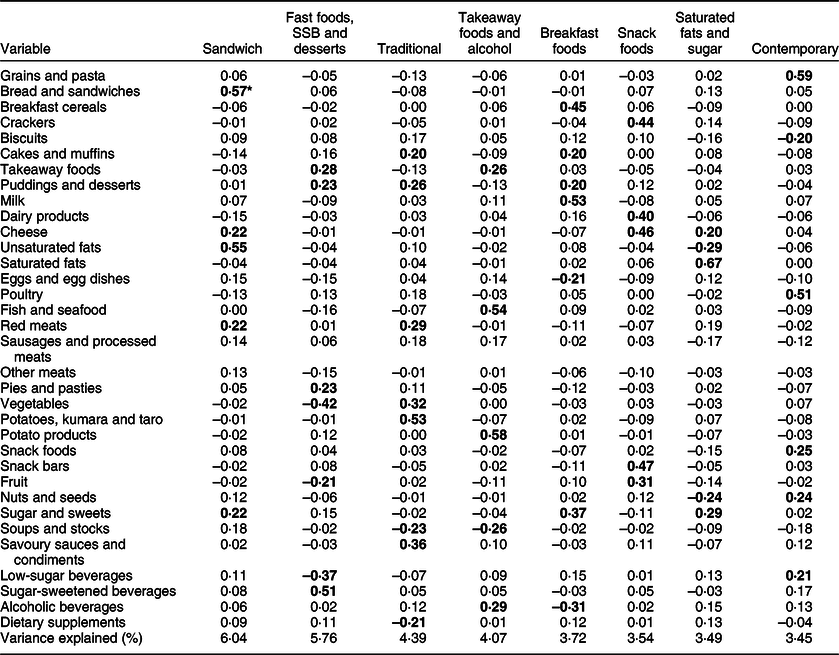
SSB, sugar-sweetened beverages.
* All bold values indicate component loadings ≥0·20 considered in the naming of dietary pattern.
Associations between dietary patterns and the WHO free sugars recommendations
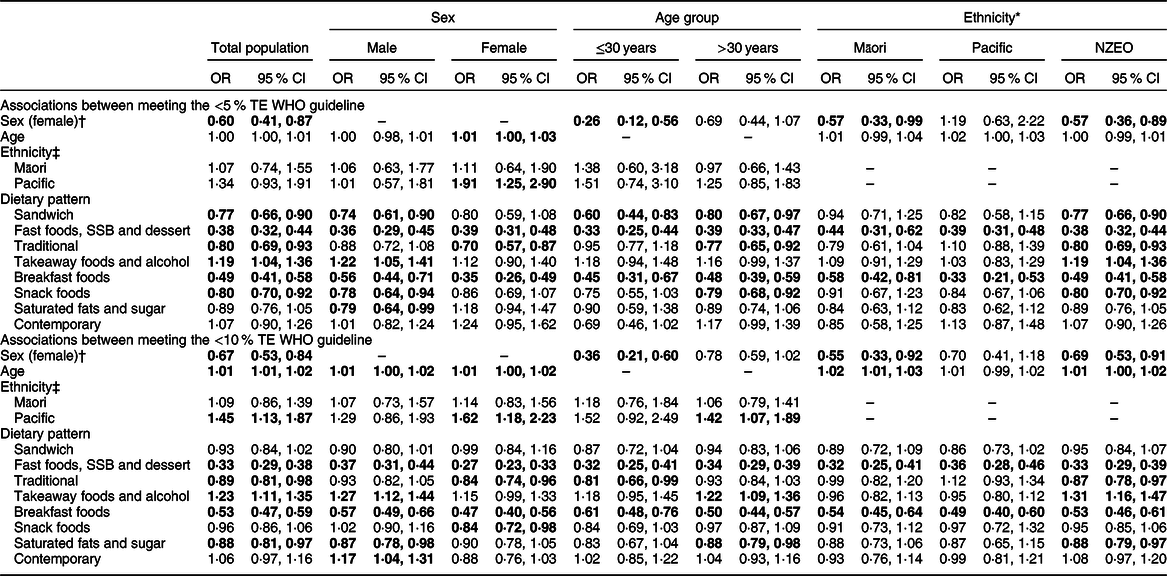
For the total population, adherence to the ‘takeaway foods and alcohol’ dietary pattern was positively associated with meeting both the <5 and <10 % WHO guidelines (Table 5). In the total population, every sd increase in ‘takeaway foods and alcohol’ component score was associated with a 19 % (1·19; 95 % CI 1·04, 1·36) or 23 % (1·23; 95 % CI 1·11, 1·35) increase in the likelihood of meeting the <5 and <10 % guidelines, respectively. Males and NZEO were more likely to meet the <5 and <10 % recommendations, and adults >30 years were more likely to meet the <10 % recommendation when adhering to ‘takeaway foods and alcohol’.
Table 5 Associations between dietary patterns and meeting the <5 % TE and <10 % TE WHO free sugars intake recommendations
TE, total energy; NZEO, New Zealand European and other; SSB, sugar-sweetened beverages.
All bold values were significantly positively or negatively associated with meeting the <5 or <10 % TE recommendation (P < 0·05).
* Prioritised ethnicity used for all analyses by ethnicity.
† Males used as the reference category.
‡ NZEO used as the reference category.
Adherence to the ‘contemporary’ pattern was neither positively nor negatively associated with meeting the <5 % (1·07; 95 % CI 0·90, 1·26) or <10 % (1·06; 95 % CI 0·97, 1·16) WHO guidelines for the total population. However, males adhering to the ‘contemporary’ pattern were 17 % (1·17; 95 % CI 1·04, 1·31) more likely to meet the <10 % recommendation.
Adherence to the ‘breakfast foods’ and ‘fast foods, SSB and dessert’ patterns was negatively associated with meeting the <5 and <10 % WHO guidelines for the total population and for all sex, age and ethnic groups. In the total population, a 1 sd increase in ‘breakfast foods’ component score was associated with a 51 % (0·49; 95 % CI 0·41, 0·58) and 47 % (0·53; 95 % CI 0·47, 0·59) reduction in the likelihood of meeting the <5 and <10 % guidelines, respectively. Similarly, in the total population, a 1 sd increase in ‘fast foods, SSB and dessert’ component score was associated with a 62 % (0·38; 95 % CI 0·32, 0·44) and 67 % (0·33; 95 % CI 0·29, 0·38) reduction in the likelihood of meeting the <5 and <10 % guidelines, respectively.
For the total population, adherence to the ‘traditional’ pattern was associated with a 20 % (0·80; 95 % CI 0·69, 0·93) and 11 % (0·89; 95 % CI 0·81, 0·98) reduction in the likelihood of meeting the <5 and <10 % guidelines, respectively. The association with the <5 % guideline persisted for females, adults >30 years and NZEO. The association with the <10 % guideline persisted for females, adults ≤30 years and NZEO.
Adherence to the ‘sandwich’ pattern was negatively associated with meeting the <5 % recommendation for the total population (0·77; 95 % CI 0·66, 0·90) but neither positively nor negatively associated with meeting the <10 % recommendation (0·93; 95 % CI 0·84, 1·02). The association with the <5 % recommendation persisted for males, both age groups and NZEO. Similarly, for the total population, adherence to the ‘snack foods’ pattern was negatively associated with meeting the <5 % recommendation (0·80; 95 % CI 0·70, 0·92) but neither positively nor negatively associated with meeting the <10 % recommendation (0·96; 95 % CI 0·86, 1·06). The association with the <5 % guideline persisted for males, adults >30 years and NZEO. Converse to the total population, females were less likely to meet the <10 % guideline when adhering to the ‘snack foods’ pattern.
Conversely, for the total population, adherence to the ‘saturated fats and sugar’ pattern was neither positively nor negatively associated with meeting the <5 % recommendation (0·89; 95 % CI 0·76, 1·05) but negatively associated with the <10 % recommendation (0·88; 95 % CI 0·81, 0·97). The neutral association with the <5 % guideline persisted for all subgroups except for males, while the negative association with the <10 % guideline persisted for males, adults >30 years and NZEO.
The ‘takeaway foods and alcohol’ pattern was more strongly associated with meeting the <10 % WHO guideline than the <5 % guideline. The ‘sandwich’, ‘traditional’, ‘breakfast foods’ and ‘snack foods’ patterns were more strongly negatively associated with meeting the <5 % guideline than with the <10 % guideline. Conversely, the ‘fast foods, SSB and dessert’ and ‘saturated fats and sugar’ patterns were more strongly negatively associated with meeting the <10 % guideline than with the <5 % guideline.
Discussion
As far as we are aware, this is the first NZ study – and the second globally – to examine adults’ dietary patterns specifically associated with meeting the WHO free sugars guideline(Reference Nocella and Srinivasan33). Dietary patterns were derived using a representative sample of the NZ adult population. The eight unique dietary patterns identified were termed ‘sandwich’, ‘fast foods, SSB and dessert’, ‘traditional’, ‘takeaway foods and alcohol’, ‘breakfast foods’, ‘snack foods’, ‘saturated fats and sugar’ and ‘contemporary’. The ‘takeaway foods and alcohol’ pattern was positively associated with meeting both the <5 and <10 % free sugars guidelines. The ‘contemporary’ pattern was neither positively nor negatively associated with the guideline in the total population, but was associated with the <10 % guideline in males only. The ‘fast foods, SSB and dessert’, ‘traditional’ and ‘breakfast foods’ patterns were negatively associated with both the <5 and <10 % guidelines. The ‘sandwich’ and ‘snack foods’ patterns were negatively associated with the <5 % guideline only, while the ‘saturated fats and sugar’ pattern was negatively associated with the <10 % guideline only.
The ‘takeaway foods and alcohol’ pattern was characterised by fish and seafood, potato products, takeaway foods and alcoholic beverages. The fish and seafood food group, containing battered, fried and crumbed fish, and the potato products food group, containing hot chips and wedges, are commonly purchased together from takeaway stores as ‘fish and chips’ in NZ(Reference Holloway34). While this dietary pattern was low in free sugars, it was likely high in energy, saturated fat and Na(Reference Eyles, Jiang and Blakely35). A 2019 analysis of the UK National Diet and Nutrition Survey using latent class analysis found that ‘prudent eaters’ and ‘high fat consumers’ similarly met the WHO free sugars guideline(Reference Nocella and Srinivasan33). Prudent eaters consumed the highest proportion of alcohol and fish as well as fat spreads and fruit, while high fat consumers had the highest intakes of meat and dairy but lowest fish intakes(Reference Nocella and Srinivasan33). Comparable with the present findings, neither pattern met the WHO saturated fat or Na intake guideline(Reference Nocella and Srinivasan33). These findings indicate that it is possible to meet the WHO free sugars guideline while consuming an energy-dense, nutrient-poor dietary pattern, and that prevalent groups across populations are consuming such diets. These diets high in saturated fats, Na and alcohol are similar to diets high in free sugars – they are associated with poor health outcomes(Reference Forouzanfar, Alexander and Bachman26).
The ‘fast foods, SSB and desserts’ and ‘saturated fats and sugar’ patterns were characterised by the consumption of energy-dense food groups and food groups proportionally high in free sugars. The ‘sandwich’, ‘traditional’, ‘breakfast foods’ and ‘snack foods’ patterns were positively characterised by food groups high in free sugars and nutrient-dense (e.g., fruit and vegetables) food groups. The ‘fast foods, SSB and desserts’, ‘breakfast foods’ and ‘saturated fats and sugar’ patterns were additionally characterised by low intakes of nutrient-dense food groups. Nonetheless, all four patterns were negatively associated with meeting the free sugars guideline. Similarly, the aforementioned UK study found a ‘high sugar/high fat consumers’ group consuming high free sugars and nutrient-dense food groups (cereals, vegetables and potatoes), and a ‘junk food eaters’ group lacking nutrient-dense food groups (fruit) and consuming high free sugars (confectionary and potentially non-alcoholic beverages)(Reference Nocella and Srinivasan33). The current study did not distinguish between low-sugar and SSB in their non-alcoholic beverage food group, so it is unknown whether beverages contributed to the group not meeting the WHO guideline. Two studies conducted on children in high-income countries have likewise found associations between dietary patterns and high free sugars intake(Reference Farajian, Risvas and Panagiotakos36,Reference Ambrosini, Johns and Northstone37) . Ambrosini et al. (Reference Ambrosini, Johns and Northstone37) identified an ‘energy-dense’ pattern in English children characterised by the consumption of food groups high in sugars (confectionary, cakes and biscuits and SSB) and low intakes of nutrient-dense food groups (fruit, vegetables and high-fibre breads and cereals). Ambrosini et al. (Reference Ambrosini, Johns and Northstone37) also identified a ‘non-energy-dense pattern’ characterised by the consumption of food groups high in sugar (SSB, fruit juices and breakfast cereals) and low intakes of milk, margarines and oils, cheese and crisps(Reference Ambrosini, Johns and Northstone37). Farajian et al. (Reference Farajian, Risvas and Panagiotakos36) similarly identified ‘pattern one’ characterised by the consumption of refined carbohydrates (sweets, fast foods and SSB) and ‘pattern 2’ characterised by the consumption of food groups high in sugar (SSB, fruit juices and sweet spreads) and nutrient-dense food groups (vegetables and legumes). Comparable to the present findings, previously identified dietary patterns associated with high free sugars intake were characterised by the consumption of energy-dense food groups, food groups proportionally high in free sugars and nutrient-dense food groups. This evidence suggests that consuming an overall dietary pattern dense in free sugars or frequently consuming individual foods high in free sugars may lead individuals to exceed the WHO free sugars guideline.
With regard to beverage intake profiles, associations between the ‘fast foods, SSB and desserts’ and ‘contemporary’ dietary patterns and the WHO free sugars guideline were consistent with prior studies. The ‘fast foods, SSB and desserts’ dietary pattern, which was negatively associated with the WHO guideline, was characterised by high intakes of SSB and low intakes of low-sugar beverages. The ‘contemporary’ pattern, which was positively associated with meeting the <10 % WHO guideline for males, was characterised by high intakes of low-sugar beverages. High intakes of SSB or fruit juice were common to all aforementioned dietary patterns associated with high free sugars intake identified by Ambrosini et al. (Reference Ambrosini, Johns and Northstone37) and Farajian et al. (Reference Farajian, Risvas and Panagiotakos36). An analysis of British adults’ beverage consumption found that those who solely consumed low-calorie beverages were nine times less likely to exceed <5 % TE from free sugars than those who solely consumed SSB(Reference Patel, Alicandro and La Vecchia38). A dietary pattern characterised by an unhealthy beverage profile may be somewhat predictive of not meeting the WHO guideline as SSB have a low satiety value, in addition to being dense in sugars(Reference Pan and Hu39). Consequently, SSB consumption has been linked with weight gain as the energy consumed through SSB is not wholly compensated for by reduced energy intake from other foods and beverages(Reference Pan and Hu39).
The majority of the most prevalent dietary patterns that explained the largest amount of variance in NZ adults’ diets were associated with not meeting the WHO free sugars guideline. The ‘fast foods, SSB and dessert’ and ‘breakfast foods’ patterns were associated with not meeting both guidelines. The ‘sandwich’ and ‘snack foods’ patterns were associated with not meeting the <5 % guideline only, and the ‘saturated fats and sugar’ pattern was associated with not meeting the <10 % guideline only. To date, studies identifying dietary patterns comprising similar food groups have reported stronger associations with short-term chronic disease risk factors than with longer-term disease. A ‘fast foods/dessert’ dietary pattern was associated with higher energy, fat and saturated fat intakes and metabolic syndrome in Lebanese adults(Reference Naja, Nasreddine and Itani40). A ‘fast energy’ dietary pattern was also associated with increased risk of metabolic syndrome in Swedish adults(Reference Berg, Lappas and Strandhagen41). A ‘high fat/sugar/takeaway’ pattern was associated with shorter maternal gestation and infant birth length in Australian women(Reference Grieger, Grzeskowiak and Clifton42). A ‘high sugar/high fat consumers’ pattern was associated with high free sugars, total fat, and saturated fat and low fruit and vegetables and dietary fibre intakes(Reference Nocella and Srinivasan33). A ‘bread and butter’ pattern was associated with a higher risk of type 2 diabetes in Native Canadians(Reference Gittelsohn, Wolever and Harris43), and a ‘white bread’ pattern was inversely associated with HDL-cholesterol in American men(Reference Newby, Muller and Tucker44). No association was found between a ‘high-white bread’ or ‘high-salty snacks’ pattern and adenocarcinoma of the oesophagus and distal stomach in Nebraskan adults(Reference Chen, Ward and Graubard45). Similarly, no significant association was found between a ‘Western breakfast’ pattern and stomach cancer in Japanese men(Reference Masaki, Sugimori and Nakamura46), but a ‘breakfast foods’ pattern was associated with a lower risk of impaired glucose tolerance in Hispanic elders(Reference Lin, Bermudez and Tucker47). In contrast to the present findings, Farajian et al. (Reference Farajian, Risvas and Panagiotakos36) reported that consuming breakfast more frequently or eating a greater number of meals and snacks was associated with lower free sugars intake in Greek children. It is, therefore, highly plausible that consuming breakfast and snacking are not inherently negatively associated with meeting the WHO guideline, but that it was the breakfast or snack foods and beverages selected by NZ adults that led to higher free sugars intake.
The ‘traditional’ pattern, characterised by foods traditional to NZ culture, including red meats, starchy and non-starchy vegetables, savoury sauces and condiments, puddings and desserts, and cakes and muffins, was also negatively associated with meeting the WHO free sugars guideline. Studies identifying traditional patterns that comprise similar food groups have found inconsistent associations with health outcomes, including higher risks of gastric cancer in Italians(Reference Palli, Russo and Decarli48), raised total and HDL-cholesterol, glucose and systolic blood pressure in Dutch adults(Reference Van Dam, Grievink and Ocké49), but no association with high blood pressure in European women(Reference Schulze, Hoffmann and Kroke50) or prostate cancer in American men(Reference Tseng, Breslow and DeVellis51). Studies have also reported associations with both higher BMI(Reference Greenwood, Cade and Draper52,Reference Beck, Jones and Ullah53) and lower BMI(Reference Pryer, Cook and Shetty54,Reference Sichieri55) in comparison to other derived patterns. These inconsistent findings may be due to the slight variations between countries in what is incorporated in a traditional diet. However, a similar ‘traditional’ pattern previously identified in NZ adults was positively characterised by starchy vegetables, other vegetables, red and other meats, sugars and preserves, cream, regular milk (2·5–4·0 % fat), coffee and tea, and negatively characterised by takeaway foods. This pattern was positively associated with BMI and waist circumference in some but not all NZ adults(Reference Beck, Jones and Ullah53).
A strength of the current study was the use of a large (n 4721) nationally representative sample. Oversampling of Māori, Pacific, and younger and older age groups allowed sufficient statistical power to make comparisons by sex, age and ethnicity. The NZANS additionally collected repeat 24-h dietary recall data. Singular 24-h dietary recalls were designed to quantitatively assess actual dietary intake over the past 24 h and are, therefore, not representative of individuals’ usual intake(Reference Gibson56). However, repeat NZANS recall data allowed dietary intake to be adjusted for intraindividual variation to estimate usual intake using the web-based programme MSM. MSM requires at least two independent days of dietary intake data and has previously been shown to be effective, even for food groups with high proportions of non-consumers(Reference Haubrock, Nöthlings and Volatier57). FFQ data, further days of dietary intake data and a large sample size all lead to better estimates of usual intake(Reference Haubrock, Nöthlings and Volatier57). Repeat recall data was collected for 25 % of NZANS participants, but an FFQ was not conducted in the NZANS. However, NZANS remains the most appropriate data source as it is the most recent and largest nationally representative dietary survey for NZ.
A limitation of the diet recall method is its use of retrospective questioning, which relies on participants’ memory and thus provides the opportunity for misreporting food and beverage intake(Reference Gibson56). Gemming et al. (Reference Gemming, Jiang and Swinburn14) reported that 25 % of women and 21 % of men in NZANS were low-energy reporters, with higher proportions of overweight, obese, Pacific and adults over 65 years reporting low energy intakes. Underreporting may have been exacerbated for food groups dense in free sugars due to social desirability bias(Reference Poppitt, Swann and Black58). Consequently, the proportion of participants meeting the WHO free sugars guideline in NZ may have been overestimated. The underreporting of specific energy-dense food groups may have produced some correlated measurement error by increasing or decreasing correlations between energy-dense and other food groups and, subsequently, distorting the patterns produced(Reference Michels and Schulze30). NZ adults’ dietary patterns may have also changed since 2008/2009. Additionally, the earlier estimation of free sugars in foods introduced some subjectivity(Reference Kibblewhite, Nettleton and McLean13). However, 92 % of these food composition estimates were able to be made using objective methods, which reduced the potential for bias(Reference Kibblewhite, Nettleton and McLean13). Despite the inherent limitations of diet recalls, they are an appropriate population-based dietary assessment method(Reference Gibson56).
A literature review of the strengths and limitations of a posteriori dietary pattern derivation methods indicated that no one method was better than another(Reference Michels and Schulze30,Reference Newby, Muller and Tucker44,Reference Reedy, Wirfalt and Flood59,Reference Newby and Tucker60) . In contrast to cluster analysis, PCA aggregates foods rather than participants, which was advantageous for the purposes of the current study. However, PCA did require some subjective decisions to be made, such as the grouping of foods. Due to the design of NZANS, some foods, such as chocolate nut spreads and other nut butters, could not be disaggregated from foods they were originally grouped with, which had similar ingredients but different nutrient compositions. Grouping foods was largely up to the authors’ discretion, though. The additional disaggregation of food groups in the current study, such as low-sugar beverages and SSB, led to patterns that could not be more easily and accurately interpreted than previous papers of a similar nature. Additional subjective decisions included the number of components to retain, method of rotation and the naming of dietary patterns. For example, the ‘takeaway foods and alcohol’ dietary pattern was partially named as such based on the correlation between the ‘fish and seafood’ and ‘potato products’ food groups and the assumption that these were purchased as fish and chips from takeaway stores. Furthermore, the ‘traditional’ pattern could alternatively have been named ‘Western’. To reduce this subjectivity, critical decisions were made based on recommendations in the literature and following discussion between co-authors. More objective measures, such as Kaiser’s criterion and scree plots, were used where possible. Additionally, the present dietary patterns only explained 34 % of the total variance in dietary intake. However, this is similar or higher than that explained by other studies(Reference Beck, Jones and Ullah53,Reference Lennon, Papacosta and Wannamethee61-Reference Howe, Black and Wong63) .
Nonetheless, the investigation of dietary patterns was in itself a strength, as free sugars and foods high in free sugars are not consumed in isolation but as part of meals and snacks to form a complete diet(Reference Kant64). The presented results provide an insight into the ways in which NZ adults commonly combine foods and beverages to form diets that might or might not meet the WHO free sugars guideline. The patterns presently derived are specific to NZ adults as dietary patterns can differ between cultures and geographic locations. However, similar high-income populations with a comparable food supply could also see such associations with the WHO guideline if they consumed the presently derived dietary patterns. The use of data-driven a posteriori methods, as opposed to theoretically driven a priori methods, was a further strength, as the derived dietary patterns were not limited by current nutrition knowledge or the selected definition of a ‘healthy diet’. Moreover, the dietary patterns were formed using pre-existing correlations between food groups in NZ adults’ diets and thus, although largely negatively associated with meeting the WHO guideline, were inherently feasible to achieve. By way of considering food groups as a whole rather than specific foods or beverages, low- or high-cost versions of dietary patterns could also be adopted. For example, non-alcoholic beverages within the ‘contemporary’ pattern could consist of cheap municipal tap water or more expensive barista-made coffees.
Conclusions
The current study provided insights into the dietary patterns of NZ adults, which may be used in the design and implementation of public health policies and interventions aimed at reducing free sugars intakes in both NZ and other high-income countries with similar dietary patterns. Results showed that the majority of NZ adults’ dietary patterns do not meet the WHO free sugars guideline. All eight dietary patterns differed in composition, but all needed to be altered to varying degrees to reflect a healthy diet that would meet WHO free sugars recommendations and other nutrient recommendations. The ‘takeaway foods and alcohol’ dietary pattern, which was associated with meeting both WHO free sugars guidelines, showed that it is possible to meet the free sugars guideline while consuming an energy-dense, nutrient-poor diet. A ‘contemporary’ pattern, associated with meeting the <10 % guideline in males, did instead include fewer energy-dense food groups and more nutrient-dense food groups. Efforts to reduce free sugars intake would, therefore, benefit from promoting more overall healthy diets rich in sources of whole grains, lean protein, PUFA and MUFA and unsweetened beverages – a message consistent with the current NZ dietary guidelines. Simultaneously implementing evidence-based policies to reduce the consumption of specific foods high in free sugars, saturated fats and Na, and healthier reformulation of processed foods would provide the greatest population health benefits; the latter is an advantageous adjunct to promoting behaviour changes because it requires little to no participant agency. Further research is warranted to quantify the potential health and financial gains that may be achieved by reducing free sugars intake to <10 % TE as well as the most effective interventions and policies to do so.
Acknowledgements
Acknowledgements: Data from the 2008/2009 NZANS was supplied by the University of Otago’s Life in New Zealand staff (Blakey, Smith and Parnell, personal communication). Kibblewhite and Nettleton at the Department of Human Nutrition, University of Otago added free sugars to the New Zealand Food Composition Database. The NZ Ministry of Health funded the 2008/2009 NZANS. The New Zealand Crown is the owner of the copyright for the survey data. The results presented in this paper are the work of the authors conducted as part of the requirements of a Master of Dietetics at the University of Otago. Financial support: This work was supported by the Health Research Council of New Zealand (grant number 13/724, 16/443). The Health Research Council of New Zealand had no role in the design, analysis or writing of this article. Conflict of interest: None. Authorship: H.E. and C.N.M. conceived of the research idea and acquired funding; C.S. obtained data, performed the PCA, analysed the data and drafted the manuscript; H.E., L.T.M. and C.C. assisted with methodological development decisions and supervised C.S.’s Master of Dietetics thesis (C.C. was the primary supervisor); all authors reviewed the manuscript. Ethics of human subject participation: The current study was conducted according to the guidelines laid down in the Declaration of Helsinki, and all procedures involving human subjects were approved by the New Zealand Health and Disability Multi-Region Ethics Committee. Written informed consent was obtained from all subjects.


