Iodine deficiency disorders (IDD) are a group of diseases caused by long-term iodine deficiency among residents in iodine deficiency areas. The most common type of IDD is endemic goitre, which is a compensatory response due to iodine deficiency in the thyroid(Reference Zimmermann1). The thyroid goitre rate (TGR) reflects the long-term iodine intake of the population and therefore the WHO recommended that when the TGR of school-age children (6–12 years) in an area is below 5 %, this area should be considered to have no IDD prevalence(2).
The assessment of whether the thyroid is enlarged usually needs to compare the thyroid volume (TVOL) with a reference standard, which requires an accurate method of measuring TVOL and an appropriate TVOL reference standard. As a safe, non-invasive technique, thyroid ultrasound can provide more accurate results than palpation and comparable results than CT(Reference Brahmbhatt, Brahmbhatt and Boyages3,Reference Kaniuka-Jakubowska, Piskunowicz and Zapasnik4) ; therefore, it is currently considered the best method for detecting TVOL in epidemiological studies(5).
WHO has established an international TVOL reference standard based on Zimmermann’s survey of 3529 children in six sites worldwide, which is classified by age-sex or body surface area (BSA)-sex(Reference Zimmermann, Hess and Molinari6). However, the applicability of international TVOL reference values in different countries is controversial. International standards could be applied to children in countries such as Geneva and Switzerland(Reference Marchie, Oyobere and Eze7), whereas it could not be applied in Iran, Spain, Japan and China(Reference Moradi, Hashemipour and Akbari8–Reference Mo, Lou and Mao11). After considering the differences in genetic, environmental and dietary factors, WHO suggests that population-specific references in countries with adequate iodine intake may be more accurate than a single international standard(2).
Although TVOL reference values classified by age-sex and BSA-sex were recommended for countries with stunted growth in children due to malnutrition(2), they may not applicable in countries with a high prevalence of childhood obesity and overweight, as neither age nor BSA can eliminate the differences of TVOL by BMI grouping(Reference De Angelis, Bagnasco and Moleti12). Meanwhile, from 1995 to 2014, the average prevalence of overweight and obesity among children aged 7–18 years in China has increased from 5·3 % to 20·5 % and the average height of urban and rural children has increased by 3·2–4·5 cm(Reference Dong, Jan and Ma13). The increased prevalence of obesity and overweight, as well as the increased height, suggests that China is no longer among countries with stunted growth in children due to malnutrition, which indicates that the present way of classifying TVOL reference standards needs to be re-evaluated for adapting current situation.
Considering the influence of growth and development factors such as height, weight, BSA and BMI on TVOL(Reference Semiz, Senol and Bircan14–Reference Licenziati, Valerio and Vetrani16), correction methods for TVOL based on these factors should be taken into account. Five correction methods for TVOL have been introduced in China as follows: Body Surface Area corrected Volume (BSAV), Body Mass Indicator corrected Volume (BMIV), Weight and Height corrected Volume Indicator (WHVI), Height corrected Volume Indicator 1 (HVI1) and Height corrected Volume Indicator 2 (HVI2). Currently, whether five existed correction methods could be applied to correct TVOL remains unclear, in terms of Chinese children’s increased growth and development trends, among them which one is the best, and its reference value is still unknown. Therefore, aims of this study are to analyse whether the five correction methods could eliminate differences in TVOL caused by growth and developmental factors, to choose the best one and to establish the reference values for the corresponding correction methods.
Materials and methods
Data sources
School-age children monitored data from 2009 Iodine Nutrition and Thyroid Function Survey and 2019 National IDD Survey in China were adopted in this research. In the 2009 China Iodine Nutrition and Thyroid Function Survey, three sites (two urban and one rural) with > 90 % coverage rate of iodised salt were selected in each of southern, central and northern China, with fifty students aged 8–10 years randomly selected from urban sites and thirty students aged 8–10 years from rural site. In 2019 National IDD Survey, all counties (except counties under 90 % coverage rate of iodised salt and counties with high water iodine concentration) in China were incorporated and a primary school was randomly selected from each side of the county’s East, South, West, North and Central, with forty students aged 8–10 years were randomly selected from each school. The children of each school were stratified by age to ensure that the final ratio of children aged 8, 9 and 10 years was close to 1:1:1.
Anthropometry
Uniform standardised procedure was used to measure height and weight to the nearest mm and 100 g, respectively. BSA, expressed as m2, was calculated with the formula: weight0·425 ×height0·725 × 71·84 × 10–4. BMI as kg/m2 was calculated using the formula: weight (kg)/height2 (m). The height for age Z-score (HAZ), weight for age Z-score (WAZ) and BMI for age Z-score (BMIZ) were calculated for each child using children of 2019 National IDD Survey as the reference population with the formula: [(height, weight or BMI) - (median height, weight or BMI of reference population)]/(standard deviation of height, weight or BMI for reference population). Children’s developmental level was assessed according to the methodology of the Chinese Health Standard WS/T 612-2018(17); three levels for both height and weight: inferior (< median – standard deviation), medium (within median ± standard deviation) and superior (> median + standard deviation). Height developmental level cut-off points were 130·0 (sd 6·1) cm at the age of 8, 135·0 (sd 6·4) cm at 9 and 140·0 (sd 7·0) cm at 10; weight developmental level cut-off points were 26·0 (sd 5·1) kg at the age of 8, 29·0 (sd 6·0) kg at 9 and 32·0 (sd 6·8) kg at 10.
Serum thyroid function
Serum thyroid stimulating hormone (TSH), free thyroxine (FT4) and free triiodothyronine (FT3) concentrations of 2009 children were measured using an automatic Chemiluminescence Immunoassay (Bayer ADVIA Centaur System). Serum thyroglobulin, thyroid microsomal antibody and thyroglobulin antibody were measured by RIA. Thyroid function indicators were compared with the reference ranges mentioned by Chen et al (Reference Chen, Zhang and Hao18): TSH within 0·3–5 mIU/l, FT3 within 4·78–6·96 pmol/l and FT4 within 13·4–20·6 pmol/l. Thyroglobulin was compared with the reference value mentioned by WHO(2), within 4–40 µg/l. Diagnostic criteria for thyroid disorders are defined as follows: subclinical hypothyroidism as TSH > 5 mIU/l with normal FT3 and FT4; hypothyroidism as TSH > 5 mIU/l with FT3 < 4·78 pmol/l or FT4 < 13·4 pmol/l; subclinical hyperthyroidism as TSH < 0·3 mIU/l with normal FT3 and FT4; hyperthyroidism as TSH < 0·3 mIU/l with FT3 > 6·96 pmol/l or FT4 > 20·6 pmol/l. Students with thyroid microsomal antibody greater than 20 % and thyroglobulin antibody greater than 30 % were considered to be thyroid antibodies positive.
Urine iodine concentration
The modified acid digestion method, As3+-Ce4+ catalytic spectrophotometry, was used to determine urinary iodine concentrations of children. The average of three random urinary iodine concentrations was calculated for children surveyed in 2009, whereas children in 2019 only had a single random urinary iodine concentration. For assessing iodine nutrition of school-age children, the median urinary iodine concentration (MUIC), recommended by WHO, was used as an epidemiological criterion; the MUIC between 100–299 µg/l was defined as sufficient (adequate or above requirements) iodine intake(2).
Thyroid volume
The operators of thyroid ultrasound were trained by national experts or nationally accredited provincial professionals. For thyroid detection, both lobes of thyroid were measured by portable ultrasonic machine with probe frequency 7·5 MHz or above, without taking isthmus into account. The volume was calculated by the WHO criteria using the formula of ellipsoid correction as follows:
volume of each lobe = 0·479 × L × W × D/1000, where L, W and D represent the maximum length, width and thickness of thyroid lateral lobe, respectively. The total TVOL of two lobes was compared with the reference value of TVOL established by China according to children’s age; thyroid with TVOL > 4·5 ml at the age of 8, > 5 ml at 9 or > 6 ml at 10 was considered to be enlarged.
The five correction methods for TVOL were as follows:
BSAV (ml/m2) = TVOL/BSA; BMIV (ml/(kg × cm–2)) = 10× TVOL/BMI; WHVI (ml/(kg × cm)) = TVOL/ (Weight × Height) × 1000; HVI1 (ml/cm) = TVOL/Height × 100; HVI2 (ml/cm2) = TVOL/Height2 × 1000.
Statistical analysis
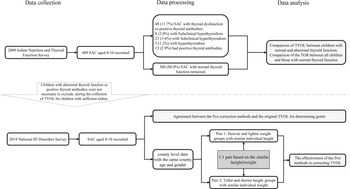
Figure 1 describes the flow chart of data processing and analyses. Whether thyroid dysfunction or thyroid positive antibodies cause alterations in TVOL will be explained by comparing the differences in TVOL between normal and abnormal children. For the 2009 Iodine Nutrition and Thyroid Function Survey, we classified the included school-age children aged 8–10 years into normal group and group with thyroid dysfunction or positive thyroid antibodies (abnormal). Data from the 2019 survey were used to compare five corrected methods for TVOL and to establish their reference values. For the 2019 National IDD Survey, children were first matched based on the same county, age and sex. Random pairing method of 1:1 was used to match survey subjects according to the similar height (the difference of height is less than 0·1 cm) in pair 1. Then we classify the light subject of each pair into group 1 and the heavy subject into group 2. In pair 2, the 1:1 pairing condition was replaced by the similar weight (the difference of weight is less than 0·1 kg) and the grouping condition was replaced by the different height.

Fig. 1. Flow chart of paired data analysis.
Continuous variables with Gaussian distribution were presented as mean values and standard deviation (height and weight), while median and inter-quartile range were used to describe skewed distribution (TVOL, five corrected volumes and thyroid function indicators). Variables’ differences between normal and abnormal thyroid function, normal thyroid function and all children were analysed by t test, Wilcoxon rank sum test and χ 2 test. For data obtained after pairing and matching, paired samples t test or Wilcoxon signed-rank test was used to compare the difference of data with Gaussian or skewed distribution. The fitted receiver operating characteristic curves and area under the receiver operating characteristic curve (AUC) were used to compare the agreement between the five corrected volumes and the original TVOL in determining children with goitre. The better the agreement, the closer the AUC is near to 1·0. An AUC greater than 0·9 was defined as high agreement and the Delong test was used to detect differences in AUC. Quantile regression models were used to estimate the relationship between TVOL (or corrected volumes) at each percentile and age, height and weight. All covariates were placed together in a quantile regression model with TVOL or corrected volume, and six regression models were created in total. Scatter plots were created to analyse the volume trends of the five corrected methods for different factors. All statistical tests of our hypothesis were two-sided and performed at the 0·05 significance level. SPSS 22 (Polar Engineering and Consulting) was used to calculate the data difference and establish the scatter plot.
This study was conducted according to the guidelines laid down in the Declaration of Helsinki, and all surveys were approved by the National Health and Family Planning Commission of the People’s Republic of China and the Harbin Medical University. Written informed consent was obtained from guardians of children.
Results
Table 1 presented the basic information of sample size, MUIC, TGR and volumes calculated by each correction method for the 2019 IDD surveillance. Indicators of thyroid function, thyroid antibodies and TVOL of children with different states surveyed in 2009 are summarised in Table 2. The MUIC and TGR for children surveyed in 2009 were 256·1 (178·3–333·5) μg/l and 3·63 %, and for children surveyed in 2019 were 192·6 (132·0–271·3) μg/l and 1·54 %, respectively.
Table 1. Basic information on sample size, urinary iodine and TVOL for IDD surveillance in 2019

MUIC, median of urinary iodine concentration; TGR, thyroid goitre rate; TVOL, thyroid volume; BSAV, Body Surface Area corrected Volume; BMIV, Body Mass Indicator corrected Volume; WHVI, Weight and Height corrected Volume Indicator; HVI1, Height corrected Volume Indicator 1; HVI2, Height corrected Volume Indicator 2.
* P < 0·05 compared with boys of the same age.
Table 2. TVOL and indicators of thyroid function and antibodies of children from the 2009 Iodine Nutrition and Thyroid Function Survey

TG, thyroglobulin; FT3, free triiodothyronine; FT4, free thyroxine; TSH, thyroid stimulating hormone; TgAb, thyroglobulin antibody; TMAb, thyroid microsomal antibody; TVOL, thyroid volume.
* P < 0·05 compared with normal children.
Thyroid function and volume of children surveyed in 2009
As shown in Table 2, among the 409 children surveyed, 360 were identified as thyroid function normal. The thyroglobulin concentrations for normal children, abnormal children and all children surveyed were 5·47 (4·53–6·88) ng/ml, 6·00 (4·46–7·89) ng/ml and 5·51 (4·53–7·00) ng/ml, respectively. Children of 0·2 % had Tg concentration above 40 ng/ml. No significant differences were found in thyroid function indicators, thyroid antibody positivity, TVOL, MUIC and TGR between normal and all surveyed children.
The FT4 and TSH in children with hyperthyroidism, 20·99 (18·72–21·50) pmol/l and 0·49 (0·04–0·96) mIU/l, were significantly different than those in normal children, 16·68 (15·49–17·82) pmol/l and 3·00 (2·12–3·87) mIU/l, whereas FT3 shown no difference. Besides, thyroglobulin antibody and thyroid microsomal antibody being significantly higher in children with positive thyroid antibodies, 37·88 (21·95–62·45) % and 30·93 (23·82–46·14) %, than in normal children 2·05 (1·39–3·12) % and 1·78 (1·19–2·56) %, there was also a significant increase in thyroglobulin, 8·41 (6·34–9·37) ng/ml vs. 5·47 (4·53–6·88) ng/ml. Abnormal group had significantly higher FT4, thyroglobulin antibody and thyroid microsomal antibody than normal children, but no significant differences were observed in TVOL and TGR.
Agreement between corrected volumes and thyroid volume for determining goitre
As shown in Fig. 2, the receiver operating characteristic curves and AUC for five corrected volumes were used to determine children aged 8, 9 and 10 years with goitre, using TVOL as a criterion. In the determination of goitre children, HVI1, HVI2, BSAV and BMIV all showed high agreement with TVOL, while the AUC of WHVI was relatively low for children aged 8 (AUC = 0·8993) and 9 (AUC = 0·8866) years. HVI1 had the highest agreement with TVOL for children with goitre in all age groups, followed by HVI2, BSAV, BMIV and WHVI.

Fig. 2. ROC curves and AUC for five corrected volumes in determining children aged 8, 9 and 10 years with goitre, using TVOL as a criterion. (a) ROC curves and AUC for five corrected volumes in children aged 8 years; (b) ROC curves and AUC for five corrected volumes in children aged 9 years; (c) ROC curves and AUC for five corrected volumes in children aged 10 years. The AUC for HVI1, HVI2, BSAV, BMIV and WHVI were all found statistically different (P < 0·001) compared with each other. ROC, receiver operating characteristic; TVOL, thyroid volume; BSAV, Body Surface Area corrected Volume; BMIV, Body Mass Indicator corrected Volume; WHVI, Weight and Height corrected Volume Indicator; HVI1, Height corrected Volume Indicator 1; HVI2, Height corrected Volume Indicator 2. Purple curve, HVI1; green curve, HVI2; red curve, BSAV; yellow curve, BMIV; blue curve, WHVI. ●, the cut-off value closest to the upper left-hand corner of the ROC curve, HVI1 > 3·12, 3·27 and 3·79 ml/cm; HVI2 > 2·16, 2·28 and 2·41 ml/cm2; BSAV > 3·82, 3·75 and 4·06 ml/m2; BMIV > 2·16, 2·19 and 2·53 ml/(kg × cm–2); WHIV > 0·88, 0·82 and 0·83 ml/(kg × cm) for children aged 8, 9 and 10 years, respectively.
Ability of correcting height or weight for five correction methods
In pair 1 of Table 3, children from the 2019 survey were classified into nine levels, according their height (inferior, medium and superior) and ages (8, 9 and 10). Children of each level were 1:1 matched according to similar height, and two children in each pair were divided into light and heavy weight groups according to their weight. The TVOL and corrected TVOL between light and heavy weight groups were compared. Regardless of height level, the median TVOL, BMIV, WHVI, HVI1 and HVI2 of children were significantly different between light and heavy weight groups (P < 0·05). However, except the children aged 10 years in the medium height level and children aged 8 and 10 years in the superior height level, there were no significant differences found in BSAV between light and heavy weight children across ages.
Table 3. Height, weight, TVOL and corrected volumes of light and heavy weight children under the similar height matching conditions

TVOL, thyroid volume; BSAV, Body Surface Area corrected Volume; BMIV, Body Mass Indicator corrected Volume; WHVI, Weight and Height corrected Volume Indicator; HVI1, Height corrected Volume Indicator 1; HVI2, Height corrected Volume Indicator.
* P < 0·05 between light and heavy weight children.
In pair 2 of Table 4, children of similar weight from the 2019 survey were divided into short and tall height groups. Regardless of weight level, the median BMIV and HVI2 of children were significantly different between short and tall height groups (P < 0·05). There was no significant difference in median TVOL between the short and tall height groups in children with inferior weight level and children aged 8 years with superior weight level. Only the median BSAV of children aged 9 and 10 years in the medium weight level was statistically different between the short and tall height groups (P < 0·05). The median WHVI and HVI1 of children in the middle weight level and in the inferior weight level aged 10 years were statistically different between the short and tall height groups (P < 0·05).
Table 4. Height, weight, TVOL and corrected volumes of short and tall height children under the similar weight matching conditions†

† TVOL, thyroid volume; BSAV, Body Surface Area corrected Volume; BMIV, Body Mass Indicator corrected Volume; WHVI, Weight and Height corrected Volume Indicator; HVI1, Height corrected Volume Indicator 1; HVI2, Height corrected Volume Indicator 2.
* P < 0·05 between short and tall height children.
In the quantile regression models for TVOL and corrected volumes (Fig. 3), the regression coefficients and their CI for age, height and weight did not intersect with the y = 0 axis, indicating that the effects of age, height and weight on TVOL or corrected volumes were univariate. After excluding the interaction effects of age, height and weight, the predictive ability of height or weight for BSAV and WHVI was relatively low (regression coefficient curves were closer to y = 0) compared with other quantile regression models.
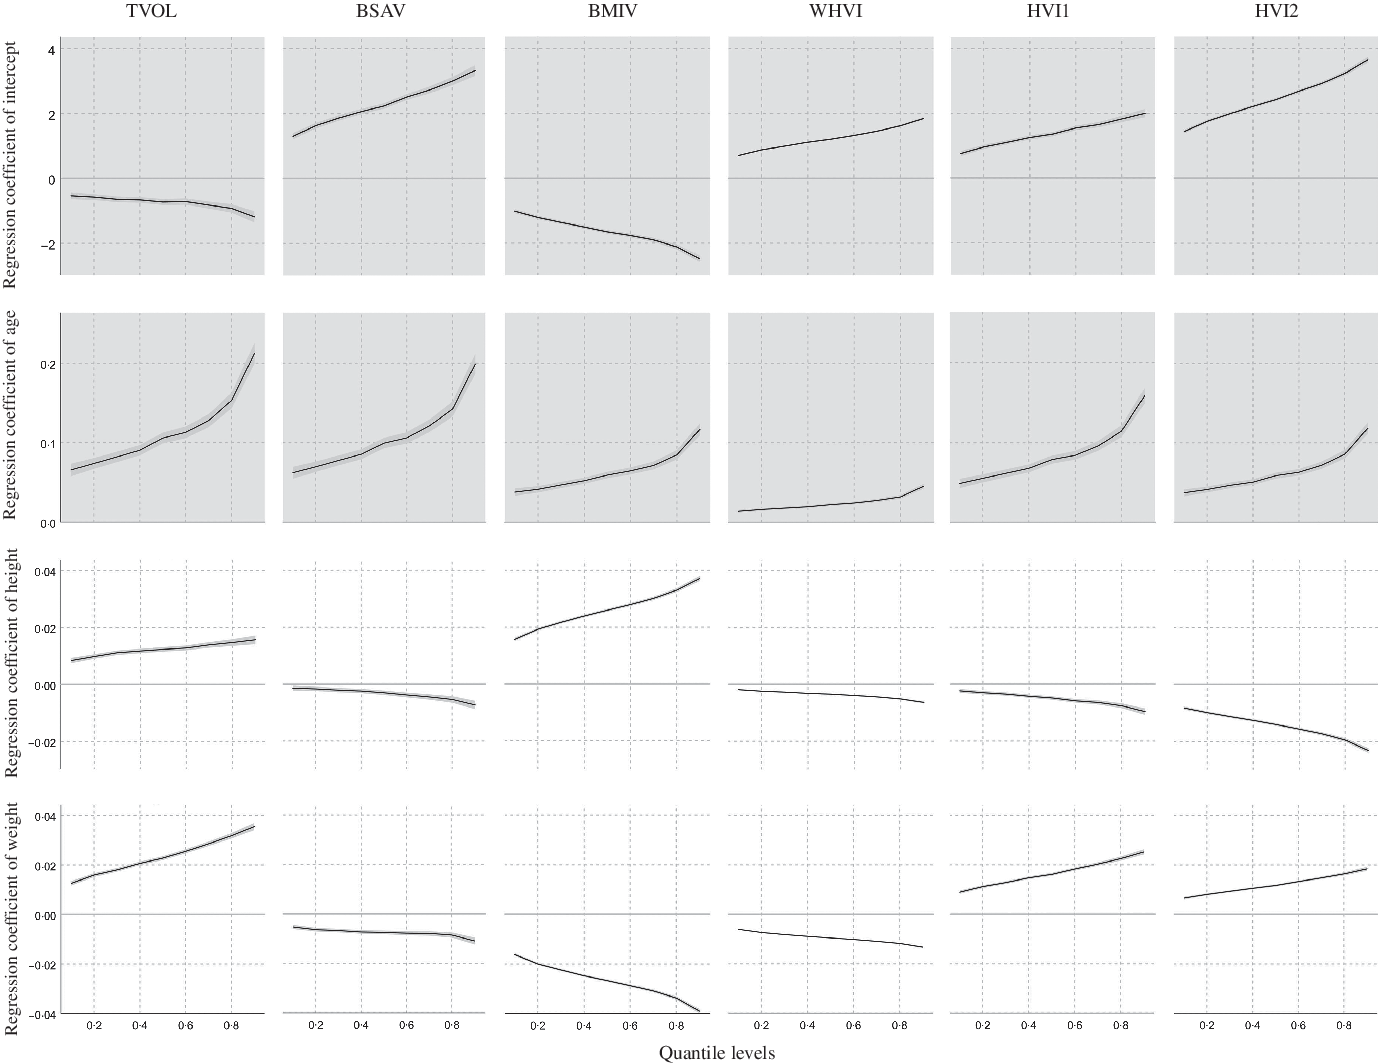
Fig. 3. Trend of regression coefficients for each factor of the TVOL, BSAV, BMIV, WHVI, HVI1 and HVI2 quantile regression models. TVOL, thyroid volume; BSAV, Body Surface Area corrected Volume; BMIV, Body Mass Indicator corrected Volume; WHVI, Weight and Height corrected Volume Indicator; HVI1, Height corrected Volume Indicator 1; HVI2, Height corrected Volume Indicator 2; —, regression coefficients and CI at the different regression quantiles.
Trends of five correction volumes
The median of TVOL, BSAV, BMIV, WHVI, HVI1 and HVI2 in different HAZ, WAZ, BMIZ and BSA groups is shown in Fig. 4. With the increase of HAZ, WAZ, BMIZ and BSA, the median of TVOL and HVI1 showed an increasing trend, whereas the median of BSAV and WHVI showed a decreasing trend. The median BMIV increased with HAZ and decreased with WAZ and BMIZ; the median HVI2, opposite to BMIV, decreased with HAZ and increased with WAZ and BMIZ. The trends of TVOL, BSAV, BMIV, WHVI, HVI1 and HVI2 with the co-increase of height and weight were, respectively, shown in online Supplementary Figures S1–S6. The different trends among different correction methods identified the correction extent of five correction methods since they may be over-correction or under-correction with downward or upward slope along with the height and weight increase.

Fig. 4. Median of TVOL and five corrected volumes for the HAZ, WAZ, BMIZ and BSA groups in 2019. (a) Median of TVOL and five corrected volumes for the HAZ group; (b) median of TVOL and five corrected volumes for the WAZ group; (c) median of TVOL and five corrected volumes for the BMIZ group; (d) median of TVOL and five corrected volumes for the BSA group. TVOL, thyroid volume; HAZ, height for age Z-score; WAZ, weight for age Z-score; BMIZ, BMI for age Z-score; ○, median TVOL; ●, median BSAV; ![]() , median BMIV; ▲, median WHVI;
, median BMIV; ▲, median WHVI; ![]() , median HVI2; ■, median HVI1.
, median HVI2; ■, median HVI1.
Age-specific reference median and 97th percentile of five correction volumes
In Table 5, the median and P97 (97th percentile) volumes of five correction methods for specific ages (8–10 years) were presented by sex. With the median of TVOL, girls had significant differences in TVOL, BSAV, BMIV, WHVI and HVI1 compared with boys, except for HVI2 aged below 9 years (P < 0·05).
Table 5. Median and 97th percentile (P97) values for TVOL and corrected volumes according to sex and age

TVOL, thyroid volume; BSAV, Body Surface Area corrected Volume; BMIV, Body Mass Indicator corrected Volume; WHVI, Weight and Height corrected Volume Indicator; HVI1, Height corrected Volume Indicator 1; HVI2, Height corrected Volume Indicator 2.
Discussion
In this article, we attempted to answer the question of whether five correction methods for TVOL by B-ultrasound can eliminate TVOL differences caused by growth and developmental factors and to establish reference values for the corresponding correction methods. We compared TVOL in children with different thyroid function status and used paired analysis, receiver operating characteristic curves, quantile regression and scatter plots to compare the ability of each correction method and the effect of several factors on them. Finally, reference values were established for correcting TVOL in Chinese children aged 8–10 years by sex.
Similar to the MUIC as an indicator to assess the iodine nutritional status of a population, thyroglobulin had shown a U-shaped relationship with iodine intake in different populations(Reference Farebrother, Zimmermann and Assey19,Reference Zimmermann, Aeberli and Andersson20) . A negative correlation was found between urinary iodine concentration and thyroglobulin concentration when the MUIC of the population was less than 300 µg/l(Reference Bilek, Cerovska and Zamrazil21). Zimmermann recommended that population with median thyroglobulin less than 13 ng/ml or less than 3 % have thyroglobulin concentrations greater than 40 ng/ml as an indicator of adequate iodine nutrition in the population(Reference Zimmermann, Aeberli and Andersson20). The median thyroglobulin concentration of the children surveyed in 2009 in this study was 5·50 ng/ml and only 0·2 % children had a thyroglobulin concentration above 40 ng/ml. Combined with the MUIC, it is reasonable to assume that the iodine intake of the children surveyed in 2009 was sufficient.
The TVOL is associated with the status of thyroid function or thyroid antibodies. Allan et al. found that hypothyroidism patients had a significantly smaller TVOL than normal persons(Reference Carle, Pedersen and Knudsen22); in patients with subclinical hypothyroidism, there were 2·6 times more people with an enlarged thyroid than people with a small thyroid(Reference Bulow Pedersen, Laurberg and Knudsen23). Enlarged TVOL was also found to be a risk factor for positive thyroid antibodies and its positive correlation with TPOAb was mediated through TSH(Reference Bulow Pedersen, Laurberg and Knudsen23,Reference Yan, Gao and Zeng24) . However, these studies above were all conducted in adults and the iodine nutritional status of the population was unknown. Under conditions of sufficient iodine intake in children in this study, no significant differences in TVOL were found between normal and thyroid abnormal or antibody-positive children, and similarly there were no significant differences in TGR between all children and normal children. Our findings accordingly suggest that during the collection of TVOL among iodine sufficient children, it was not necessary to exclude children with abnormal thyroid function or positive thyroid antibodies.
Physiological factors such as height, weight, BSA and BMI showed significant correlations with TVOL(Reference Hegedus, Perrild and Poulsen25–Reference Zou, Ding and Lou27). Taking the obvious co-linearity of BSA and BMI with height and weight into account, BSA was frequently used to study the relationship between physiological factors and TVOL, since the correlation between BSA and TVOL was relatively strong(Reference Majstorov, Miladinova and Kuzmanovska28). Few studies have compared the magnitude of the effect of height and weight on TVOL, like our previous study reported that the effect of height on TVOL may be expressed through factors such as age and weight(Reference Liu, Liu and Li29). In this study, after excluding the interaction between height and weight, the TVOL of heavy weight children was significantly larger than that of light weight children in different age groups across all three height levels, whereas the TVOL of tall height children did not differ from that of short height children in the inferior weight level and superior weight level at age 8. The above results suggest that differences in TVOL were more likely to occur when the population was grouped by weight rather than height, that is, the weight perhaps has greater influence on TVOL than height.
An additional important finding of this study was that TVOL, grouped by age only, still differed between children of different heights or weights, especially as we excluded the interaction between height and weight. Similar to the present study, Simona et al. found that the current reference standards grouped by age and BSA did not eliminate differences in TVOL between overweight, obese and appropriate weight children, consequently leading to an overestimation of TGR in overweight and obese children(Reference De Angelis, Bagnasco and Moleti12). Leptin may explain why obese children have greater TVOL, as a significant correlation between TVOL and BMI and leptin has been reported in obese individuals, and they decrease significantly after weight loss(Reference Eray, Sari and Ozdem30). Another possible cause of greater TVOL in obese people is inflammatory factors, as obese people were more likely to secrete inflammatory factors and there was a significant positive correlation between inflammatory factors, TVOL and TSH(Reference Chen, Zhang and Tang26). Leptin and inflammatory factors were generally recognised as having an effect on the thyroid by regulating TSH(Reference Licenziati, Valerio and Vetrani16,Reference Gomez, Maravall and Gomez31) .
High agreement between the correction volumes and the original TVOL for determining goitre except WHVI at age 8 and 9 was found in this study, suggesting that all correction methods except WHVI were well enough at distinguishing thyroid-enlarged children. TVOL, BSAV, WHVI and HVI1 showed stable trends among the different subgroups, while the trend for BMIV and HVI2 was unexpectedly irregular. The increasing trend of BMIV in the HAZ group and the decreasing trend in the WAZ or BMIZ groups may be explained by the excessive dependence of BMIV on weight; the opposite trend of HVI2 in these groups compared with BMIV may be explained by the excessive dependence of HVI2 on height.
WHVI had been suggested to be overcorrected as it decreases with age, even though no differences in WHVI were found between children of different heights and weight groups(Reference Wang, Liu and Zhao32). The results of this study show that WHVI does had a decreasing trend with age, whereas other correction methods do not, similarly suggesting that WHVI was a method with overcorrection power.
HVI2 was previously considered the best correction for TVOL due to the closest match between 1·7 HVI2(Reference Liu, Wang and Zhao33) and the theoretical TVOL, and studies have shown no significant difference in HVI2 between the tall and short, slim and fat groups(Reference Zhou, Huang and Zhu34). However, after excluding interaction between height and weight and increasing the observed sample size, this study did find differences in HVI2 between all light and heavy weight groups.
BSA and BMI, which are both calculated from height and weight, give different results when corrected for TVOL. In contrast to BMIV, BSAV did not find in previous studies to be significantly correlated with either height or weight(Reference Wang, Liu and Zhao32,Reference Wang, Ni and Fu35) . In this study, only BSAV was able to eliminate most of the significant differences in TVOL between height and weight groups. Opposite to BSAV, it was found that some of the differences in TVOL between short and tall height groups were not significant, but these differences turned to be significant when TVOL was calculated into BMIV, WHVI, HVI1 and HVI2. Furthermore, height and weight had a relatively low association on BSAV compared with other quantile regression models. Based on the above results, it is believed that BSAV may be the optimal method of TVOL correction since it is stable and can correct the difference of volumes in different height or weight groups.
The median and 97 % quantiles of TVOL and corrected volumes for children aged 8–10 years were presented by sex, as there were significant differences in TVOL and corrected volumes between boys and girls. Some studies do suggest that girls of school age have higher TVOL than boys(Reference Zimmermann, Hess and Molinari6,Reference Garcia-Ascaso, Ares Segura and Ros Perez9,Reference Mo, Lou and Mao11,Reference Suzuki, Midorikawa and Fukushima36) , but other studies do not(Reference Kaloumenou, Alevizaki and Ladopoulos37,Reference Chen, Zhang and Wu38) . Our finding of inconsistent sex differences in median and 97 % quantiles of TVOL suggests that boys and girls do differ in TVOL due to inconsistent development, but it is hard to identify the age cut point at which the difference becomes significant.
The applicability of the international thyroid reference values in different countries was controversial; specifically, Moradi et al. showed that the median and 97th percentile of TVOL in Isfahan children were smaller than the international thyroid reference values(Reference Moradi, Hashemipour and Akbari8), whereas the other study concluded that the 97th percentile of TVOL in Spanish children classified by age and sex was higher than the international thyroid reference values(Reference Garcia-Ascaso, Ares Segura and Ros Perez9). The 97 % percentile of TVOL for children aged 8–10 years in this study was similar to the Chinese thyroid reference value, and similar to the results of studies in China and Japan(Reference Fuse, Saito and Tsuchiya10,Reference Mo, Lou and Mao11) , which are both Asian countries, but higher than the international thyroid reference values. The iodine nutritional status of children in above studies and the present study is all sufficient, and the differences in TVOL could be explained by genes, environment and diet(Reference Zimmermann, Hess and Molinari6). Considering that the developmental status of children in China varies from that in other countries, whereas the TVOL reference of Chinese children is higher than the international reference values, it is recommended to establish different corrected TVOL reference values for different regions, as height and weight might have different influences on TVOL in different regions or ethnic groups.
The strength of this study is that data from the National IDD Survey were used to analyse the corrected TVOL, and when differences in TVOL between groups disappeared, it showed that the correction method was feasible under the large sample condition. Whereas, this study has two limitations: first, only children aged 8–10 years were analysed, and other age groups are expected in future studies; second, most references of the TVOL correction method came from China, as other countries have rarely researched on this issue, adding the limitation of the discussion.
In conclusion, it is found that BSAV was the best method of TVOL correction in this research. Reference values have been established for corrected TVOL in Chinese children aged 8–10 years by sex.
Acknowledgements
The authors appreciate the participants of this study. We also thank the provincial Centres for Disease Control and Prevention and the Centres for Endemic Disease Control in thirty-one provinces and Xinjiang construction corps.
This research was supported by the National Natural Science Foundation (NSFC81773370), Harbin Medical University Marshal Initiative Funding (HMUMIF-21015) and Heilongjiang Provincial Natural Science Foundation of China (LH2021H015). Author contributions were L. L. and P. L. conceived and designed the study. L. L., F. M., X. L., M. L., T. Q., R. S. and Y. D. did the statistical analysis. L. L., P. L. and L. F. drafted the manuscript. All authors revised the manuscript and approved the final version before submission.
No competing financial interests exist.
Supplementary material
For supplementary material referred to in this article, please visit https://doi.org/10.1017/S0007114522001003