
47 results
Experimental measurement of spatio-temporally resolved energy dissipation rate in turbulent Rayleigh–Bénard convection
-
- Journal:
- Journal of Fluid Mechanics / Volume 984 / 10 April 2024
- Published online by Cambridge University Press:
- 27 March 2024, A8
-
- Article
- Export citation
-
We report a home-built velocity-gradient-tensor-resolved particle image velocimetry (VGTR-PIV) system which spatio-temporally resolves all components of the velocity gradient tensor. This technique is applied to the paradigmatic turbulent Rayleigh–Bénard convection system in a cylindrical cell at three representative positions, i.e. centre, side and bottom regions. The VGTR-PIV system allows us to directly measure, for the first time, the spatio-temporally resolved energy dissipation rate and enstrophy in turbulent thermal convection. In the experiment, the Rayleigh number
 $Ra$ varied in the range
 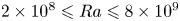 $2 \times 10^8 \leqslant Ra \leqslant 8 \times 10^9$ and the Prandtl number
  $Pr$ was fixed at
  $Pr = 4.34$. Compared with the fully resolved energy dissipation rate
  $\varepsilon$, the pseudo-dissipation provides the best estimate within
  $3\,\%$, the planar (two-dimensional) surrogate has a larger relative error and the one-dimensional surrogate leads to the largest error. The power-law scalings of the time-averaged energy dissipation rate with the Rayleigh number follow
  $\langle \varepsilon _c \rangle _t / (\nu ^3 H^{-4}) = 9.86 \times 10^{-6} Ra^{1.54 \pm 0.02}$,
  $\langle \varepsilon _s \rangle _t / (\nu ^3 H^{-4}) = 9.26 \times 10^{-3} Ra^{1.25 \pm 0.02}$ and
  $\langle \varepsilon _b \rangle _t / (\nu ^3 H^{-4}) = 2.70 \times 10^{-2} Ra^{1.23 \pm 0.02}$ in the centre, side and bottom regions, respectively where
  $\nu$ is dynamic viscosity and
  $H$ is cell height. These scaling relations, along with our earlier measured time-averaged energy dissipation rate at the bottom wall surface
  $\langle \varepsilon _w \rangle _t / (\nu ^3 H^{-4}) = 9.65 \times 10^{-2} Ra^{1.25 \pm 0.02}$ (J. Fluid Mech., vol. 947, 2022, A15), provide important constraints against which theoretical models may be tested. For the centre and side locations in the convection cell, the probability density functions (p.d.f.s) of the energy dissipation rate and enstrophy both follow a stretched exponential distribution. For the bottom region, the p.d.f.s of dissipation and enstrophy exhibit a stretched exponential distribution outside the viscous boundary layer and an exponential distribution inside the viscous boundary layer. It is also found that extreme events with high dissipation are the most intermittent in the side region, whereas the bottom region is less intermittent than the cell centre.


Upregulation of miR-21-5p rescues the inhibition of cardiomyocyte proliferation induced by high glucose through negative regulation of Rhob
-
- Journal:
- Journal of Developmental Origins of Health and Disease / Volume 14 / Issue 5 / October 2023
- Published online by Cambridge University Press:
- 11 December 2023, pp. 670-677
-
- Article
- Export citation
Effects of the geothermal gradient on the convective dissolution in CO2 sequestration
-
- Journal:
- Journal of Fluid Mechanics / Volume 963 / 25 May 2023
- Published online by Cambridge University Press:
- 19 May 2023, A23
-
- Article
- Export citation
-
Convective dissolution is an important mechanism for long-term CO
 $_2$ sequestration in deep saline aquifers. The presence of an unstable geothermal gradient can affect the process of dissolution. In this paper, we present direct numerical simulations in a three-dimensional porous medium at three different concentration Rayleigh numbers
  $Ra_S$ with a set of thermal Rayleigh numbers
  $Ra_T$. Simulations reveal that the flow structures alter when
  ${\textit {Ra}}_T$ increases for a fixed
  ${\textit {Ra}}_S$. Strong thermal gradient can yield large-scale convection rolls which change the horizontal distribution and motions of concentration fingers. The time evolution of fluxes also has different responses to different
  ${\textit {Ra}}_T$. A theoretical model is developed and successfully describes the evolution of concentration flux and volume averaged concentration during the final shutdown stage. We further calculate the dissolved CO
 $_2$ into the interior over time, which shows non-monotonic variations as
  ${\textit {Ra}}_T$ increases. At the end of our simulations, the maximum increment of dissolved CO
 $_2$ occurs when density ratio is around unity for all three concentration Rayleigh numbers we have explored. We apply our results to a typical geological reservoir and discuss their implications.


Measurement of electron beam transverse slice emittance using a focused beamline
- Part of
-
- Journal:
- High Power Laser Science and Engineering / Volume 11 / 2023
- Published online by Cambridge University Press:
- 13 March 2023, e36
-
- Article
-
- You have access
- Open access
- HTML
- Export citation
Peripartum women’s perspectives on research study participation in the OneFlorida Clinical Research Consortium during COVID-19 pandemic
-
- Journal:
- Journal of Clinical and Translational Science / Volume 7 / Issue 1 / 2023
- Published online by Cambridge University Press:
- 10 October 2022, e24
-
- Article
-
- You have access
- Open access
- HTML
- Export citation
Three-dimensional properties of the viscous boundary layer in turbulent Rayleigh–Bénard convection
-
- Journal:
- Journal of Fluid Mechanics / Volume 947 / 25 September 2022
- Published online by Cambridge University Press:
- 22 August 2022, A15
-
- Article
- Export citation
-
We report an experimental study of the viscous boundary layer (BL) properties of turbulent Rayleigh–Bénard convection in a cylindrical cell. The velocity profile with all three components was measured from the centre of the bottom plate by an integrated home-made particle image velocimetry system. The Rayleigh number
 $Ra$ varied in the range
  $1.82 \times 10^8 \le Ra \le 5.26 \times 10^9$ and the Prandtl number
  $Pr$ was fixed at
  $Pr = 4.34$. The probability density function of the wall-shear stress indicates that using the velocity component in the mean large-scale circulation (LSC) plane alone may not be sufficient to characterise the viscous BL. Based on a dynamic wall-shear frame, we propose a method to reconstruct the measured full velocity profile which eliminates the effects of complex dynamics of the LSC. Various BL properties including the eddy viscosity are then obtained and analysed. It is found that, in the dynamic wall-shear frame, the eddy viscosity profiles along the centre line of the convection cell at different
  $Ra$ all collapse on a single master curve described by
 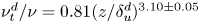 $\nu _t^d / \nu = 0.81 (z / \delta _u^d) ^{3.10 \pm 0.05}$. The Rayleigh number dependencies of several BL quantities are also determined in the dynamic frame, including the BL thickness
  $\delta _u^d$ (
 ${\sim } Ra^{-0.21}$), the Reynolds number
  $Re^d$ (
 ${\sim }Ra^{-0.46}$) and the shear Reynolds number
  $Re_s^d$ (
 ${\sim } Ra^{0.24}$). Within the experimental uncertainty, these scaling exponents are the same as those obtained in the static laboratory frame. Finally, with the measured full velocity profile, we obtain the energy dissipation rate at the centre of the bottom plate
  $\varepsilon _{w}$, which is found to follow
 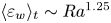 $\langle \varepsilon _{w} \rangle _t \sim Ra^{1.25}$.


Epidemiologic characteristics and influencing factors of cluster infection of COVID-19 in Jiangsu Province
-
- Journal:
- Epidemiology & Infection / Volume 149 / 2021
- Published online by Cambridge University Press:
- 10 February 2021, e48
-
- Article
-
- You have access
- Open access
- HTML
- Export citation
Temperature and humidity associated with increases in tuberculosis notifications: a time-series study in Hong Kong
-
- Journal:
- Epidemiology & Infection / Volume 149 / 2021
- Published online by Cambridge University Press:
- 28 December 2020, e8
-
- Article
-
- You have access
- Open access
- HTML
- Export citation
Effects of resistant starch on glycaemic control: a systematic review and meta-analysis
-
- Journal:
- British Journal of Nutrition / Volume 125 / Issue 11 / 14 June 2021
- Published online by Cambridge University Press:
- 22 September 2020, pp. 1260-1269
- Print publication:
- 14 June 2021
-
- Article
-
- You have access
- HTML
- Export citation
Evaluation of gray matter reduction in patients with typhoon-related posttraumatic stress disorder using causal network analysis of structural MRI
-
- Journal:
- Psychological Medicine / Volume 52 / Issue 8 / June 2022
- Published online by Cambridge University Press:
- 17 September 2020, pp. 1481-1490
-
- Article
- Export citation
Increased vegetable and fruit intake is associated with reduced failure rate of tuberculosis treatment: a hospital-based cohort study in China
-
- Journal:
- British Journal of Nutrition / Volume 125 / Issue 8 / 28 April 2021
- Published online by Cambridge University Press:
- 02 September 2020, pp. 926-933
- Print publication:
- 28 April 2021
-
- Article
-
- You have access
- HTML
- Export citation
Associations of early-life exposure to famine with abdominal fat accumulation are independent of family history of diabetes and physical activity
-
- Journal:
- British Journal of Nutrition / Volume 125 / Issue 8 / 28 April 2021
- Published online by Cambridge University Press:
- 02 September 2020, pp. 943-950
- Print publication:
- 28 April 2021
-
- Article
-
- You have access
- HTML
- Export citation
Selective catalytic reduction of NOx with NH3 over cerium–tungsten–titanium mixed oxide catalyst: Synergistic promotional effect of H2O2 and Ce4+
-
- Journal:
- Journal of Materials Research / Volume 35 / Issue 16 / 28 August 2020
- Published online by Cambridge University Press:
- 06 August 2020, pp. 2218-2229
- Print publication:
- 28 August 2020
-
- Article
- Export citation
-
A highly active catalyst of cerium–tungsten–titanium mixed oxide was synthesized by introducing Ce4+ and H2O2 in the base sample of Ce20W10Ti100Oz–Ce3+. As a consequence, the NH3-SCR activity of Ce20W10Ti100Oz–Ce3+ is significantly improved as the additives of Ce4+ and H2O2 enlarge the Brunauer–Emmett–Teller (BET) surface area by refining its pore size. Meanwhile, the introduction of Ce4+ increases the Lewis acid sites of Ce20W10Ti100Oz–Ce3+ and decreases its low-temperature Brønsted acid sites. The further addition of H2O2 improves the Brønsted acid sites and dispersion of cerium/tungsten species, and thereby enhances the concentrations of the adsorbed oxygen (Oα) and the adsorbed oxygen
 $\lpar {\rm {O}^{\prime}}_{\rm \alpha} \rpar$ due to the activation of chemisorbed water on the surface of the catalyst. The addition of Ce4+ and H2O2 shows a synergistic promotional effect, which is due to the largest BET surface area and the highest concentrations of Oα or/and
  ${\rm {O}^{\prime}}_{\rm \alpha}$. Ce20W10Ti100Oz–Ce3+:Ce4+ = 17.5:2.5 + H2O2 exhibits the highest catalytic activity compared with the conventional ones (Fig. 5).


In-situ Observation of Magnetic Skyrmion Crystal Growth from the Conical Phase
-
- Journal:
- Microscopy and Microanalysis / Volume 26 / Issue S2 / August 2020
- Published online by Cambridge University Press:
- 30 July 2020, pp. 1764-1765
- Print publication:
- August 2020
-
- Article
-
- You have access
- Export citation
Damage behavior of heterogeneous magnesium matrix nanocomposites
-
- Journal:
- MRS Communications / Volume 10 / Issue 2 / June 2020
- Published online by Cambridge University Press:
- 15 May 2020, pp. 359-364
- Print publication:
- June 2020
-
- Article
- Export citation
Materials Data Science for Microstructural Characterization of Archaeological Concrete
-
- Journal:
- MRS Advances / Volume 5 / Issue 7 / 2020
- Published online by Cambridge University Press:
- 24 February 2020, pp. 305-318
- Print publication:
- 2020
-
- Article
- Export citation
Influenza activity prediction using meteorological factors in a warm temperate to subtropical transitional zone, Eastern China
-
- Journal:
- Epidemiology & Infection / Volume 147 / 2019
- Published online by Cambridge University Press:
- 20 December 2019, e325
-
- Article
-
- You have access
- Open access
- HTML
- Export citation
Multilocus sequence typing and clonal population genetic structure of Cyclospora cayetanensis in humans
-
- Journal:
- Parasitology / Volume 144 / Issue 14 / December 2017
- Published online by Cambridge University Press:
- 12 July 2017, pp. 1890-1897
-
- Article
- Export citation
