
272 results
Induced Thermoluminescence of some Clay Minerals
-
- Journal:
- Clays and Clay Minerals / Volume 30 / Issue 4 / August 1982
- Published online by Cambridge University Press:
- 02 April 2024, pp. 311-314
-
- Article
- Export citation
Head and Neck Cancer: United Kingdom National Multidisciplinary Guidelines, Sixth Edition
-
- Journal:
- The Journal of Laryngology & Otology / Volume 138 / Issue S1 / April 2024
- Published online by Cambridge University Press:
- 14 March 2024, pp. S1-S224
- Print publication:
- April 2024
-
- Article
-
- You have access
- Open access
- HTML
- Export citation
Length of antibiotic therapy among adults hospitalized with uncomplicated community-acquired pneumonia, 2013–2020
-
- Journal:
- Infection Control & Hospital Epidemiology / Volume 45 / Issue 6 / June 2024
- Published online by Cambridge University Press:
- 14 February 2024, pp. 726-732
- Print publication:
- June 2024
-
- Article
- Export citation
Empowering the Participant Voice (EPV): Design and implementation of collaborative infrastructure to collect research participant experience feedback at scale
-
- Journal:
- Journal of Clinical and Translational Science / Volume 8 / Issue 1 / 2024
- Published online by Cambridge University Press:
- 06 February 2024, e40
-
- Article
-
- You have access
- Open access
- HTML
- Export citation
The probiotic Lacticaseibacillus rhamnosus HN001 influences the architecture and gene expression of small intestine tissue in a piglet model
-
- Journal:
- British Journal of Nutrition / Volume 131 / Issue 8 / 28 April 2024
- Published online by Cambridge University Press:
- 06 December 2023, pp. 1289-1297
- Print publication:
- 28 April 2024
-
- Article
-
- You have access
- Open access
- HTML
- Export citation

God and the Problems of Love
-
- Published online:
- 27 November 2023
- Print publication:
- 21 December 2023
-
- Element
-
- You have access
- Open access
- HTML
- Export citation
Length of antibiotic therapy among adults aged ≥65 years hospitalized with uncomplicated community-acquired pneumonia, 2013-2020
-
- Journal:
- Antimicrobial Stewardship & Healthcare Epidemiology / Volume 3 / Issue S2 / June 2023
- Published online by Cambridge University Press:
- 29 September 2023, p. s26
-
- Article
-
- You have access
- Open access
- Export citation
-
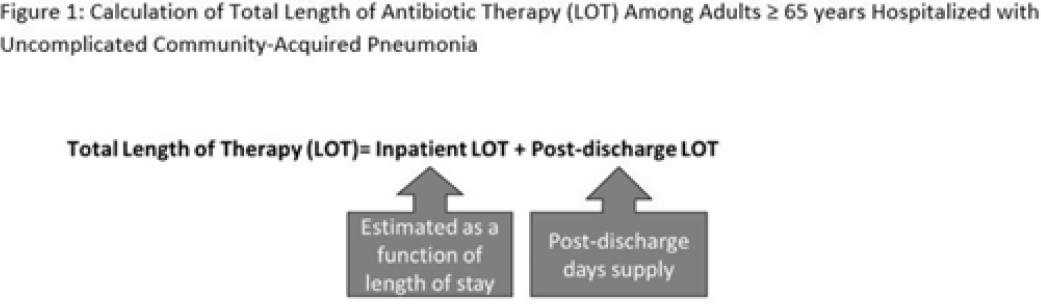
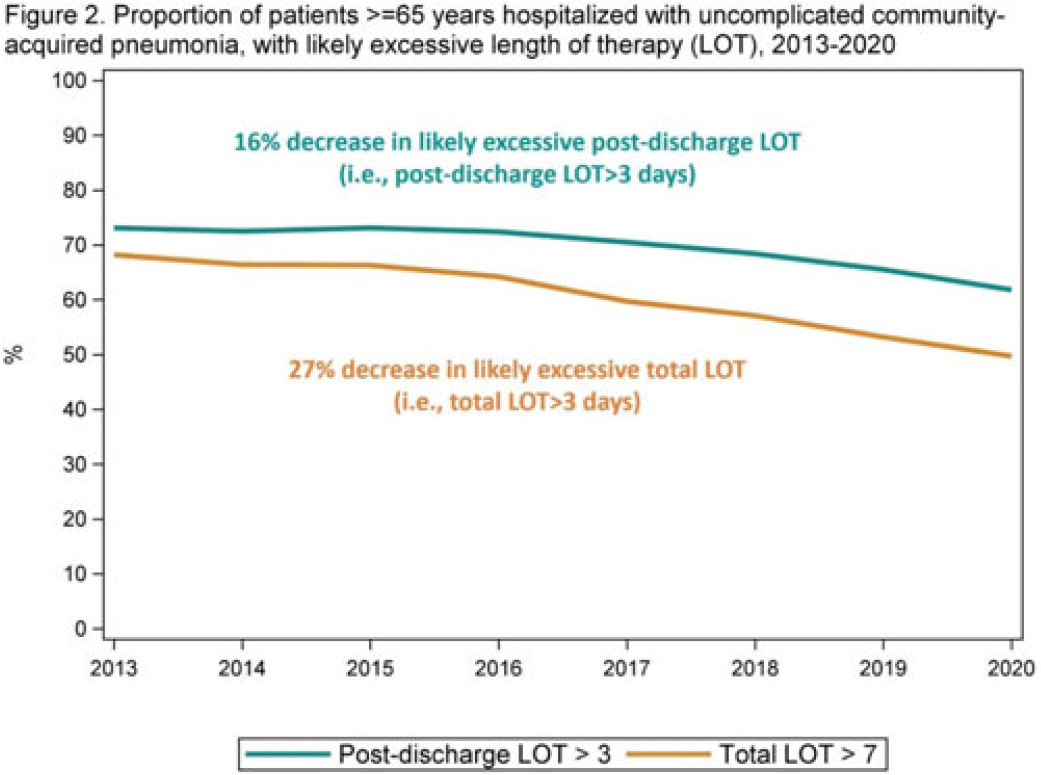
Background: The 2014 US National Strategy for Combating Antibiotic-Resistant Bacteria aimed to reduce inappropriate inpatient antibiotic use by 20% for monitored conditions, such as community-acquired pneumonia (CAP), by 2020. Clinical guidelines recommend treating uncomplicated CAP with a minimum of 5 days of antibiotic therapy. Total length of therapy (LOT) >7 days or >3 days after clinical improvement is rarely necessary. In a previous study estimating LOT in uncomplicated CAP patients, 71% of patients ≥65 years exceeded recommended duration of antibiotics in 2012–2013 (Yi et al, 2018). We evaluated annual trends in LOT in adults ≥65 years hospitalized with uncomplicated CAP from 2013 to 2020. Methods: We conducted a retrospective cohort study among patients in the CMS database with a primary diagnosis of bacterial or unspecified pneumonia using International Classification of Diseases 9th and 10th Revision codes, length of stay (LOS) of 2–10 days, discharged home with self-care, and not rehospitalized in the 3 days following discharge. Discharge home was used as a surrogate for clinical improvement. Because inpatient LOT is not available in CMS data, we used linear regression to model inpatient LOT as a function of LOS using data on CAP patients ≥65 years from the PINC AI healthcare database. Postdischarge LOT was based on prescriptions filled following discharge. Total LOT was calculated by summing estimated inpatient LOT and actual postdischarge LOT (Fig. 1). Total LOT >7 days and postdischarge LOT >3 days were considered indicators of likely excessive LOT. We reported trends in the proportion of patients with likely excessive LOT during the study period. Results: From 2013 through 2020, there were 400,928 uncomplicated CAP hospitalizations among patients aged ≥65 years. Patients were more likely to be female (55%), and they had a median age of 76 years and a median LOS of 3 days. The median total LOT decreased from 9.5 days in 2013 to 7.7 days in 2020. The proportion of patients with total LOT >7 days decreased from 68% in 2013 to 50% in 2020 (% change, −27%); the proportion with postdischarge LOT >3 days decreased from 73% in 2013 to 62% in 2020 (% change, −16%) (Fig. 2). Conclusions: Likely excessive total LOT for adults ≥65 years hospitalized with uncomplicated CAP decreased by 27% in 2020, a considerable improvement from 2013. However, the high proportion of patients with likely excessive postdischarge LOT in 2020 (62%) demonstrates the need for antibiotic stewardship to optimize prescribing at hospital discharge.
Disclosures: None


338 The Alabama Genomic Health Initiative: Integrating Genomic Medicine into Primary Care
- Part of
-
- Journal:
- Journal of Clinical and Translational Science / Volume 7 / Issue s1 / April 2023
- Published online by Cambridge University Press:
- 24 April 2023, pp. 100-101
-
- Article
-
- You have access
- Open access
- Export citation
Embedding community-engaged research principles in implementation science: The implementation science center for cancer control equity
-
- Journal:
- Journal of Clinical and Translational Science / Volume 7 / Issue 1 / 2023
- Published online by Cambridge University Press:
- 10 March 2023, e82
-
- Article
-
- You have access
- Open access
- HTML
- Export citation
Nicolaus Mameranus: Poetry and Politics at the Court of Mary Tudor. By Matthew Tibble. Studies in Medieval and Reformation Traditions 220. Leiden and Boston: Brill, 2000. Xii + 389pp. €157 cloth.
-
- Journal:
- Church History / Volume 92 / Issue 1 / March 2023
- Published online by Cambridge University Press:
- 28 July 2023, pp. 182-184
- Print publication:
- March 2023
-
- Article
- Export citation
Severe acute respiratory coronavirus virus 2 (SARS-CoV-2) outbreaks in nursing homes involving residents who had completed a primary coronavirus disease 2019 (COVID-19) vaccine series—13 US jurisdictions, July–November 2021
-
- Journal:
- Infection Control & Hospital Epidemiology / Volume 44 / Issue 6 / June 2023
- Published online by Cambridge University Press:
- 16 January 2023, pp. 1005-1009
- Print publication:
- June 2023
-
- Article
- Export citation
Eilish Gregory. Catholics during the English Revolution, 1642–1660: Politics, Sequestration and Loyalty. Woodbridge: Boydell Press, 2021. Pp. 248. $115.00 (cloth).
-
- Journal:
- Journal of British Studies / Volume 62 / Issue 1 / January 2023
- Published online by Cambridge University Press:
- 03 March 2023, pp. 240-241
- Print publication:
- January 2023
-
- Article
- Export citation
Temporal trends in urine-culture rates in the US acute-care hospitals, 2017–2020
-
- Journal:
- Antimicrobial Stewardship & Healthcare Epidemiology / Volume 2 / Issue S1 / July 2022
- Published online by Cambridge University Press:
- 16 May 2022, p. s12
-
- Article
-
- You have access
- Open access
- Export citation
-
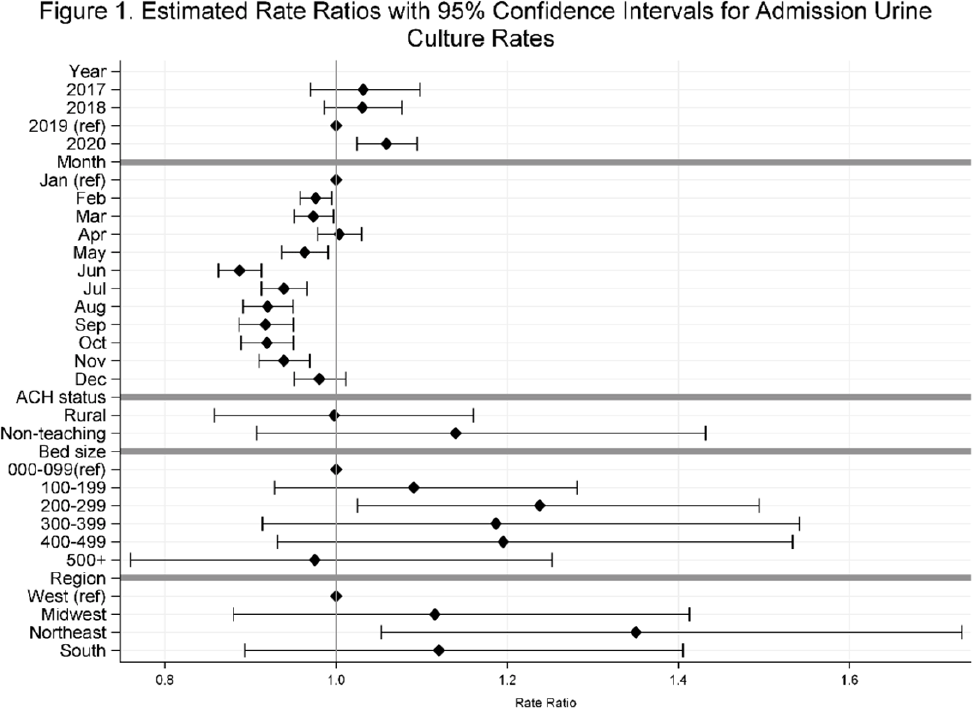
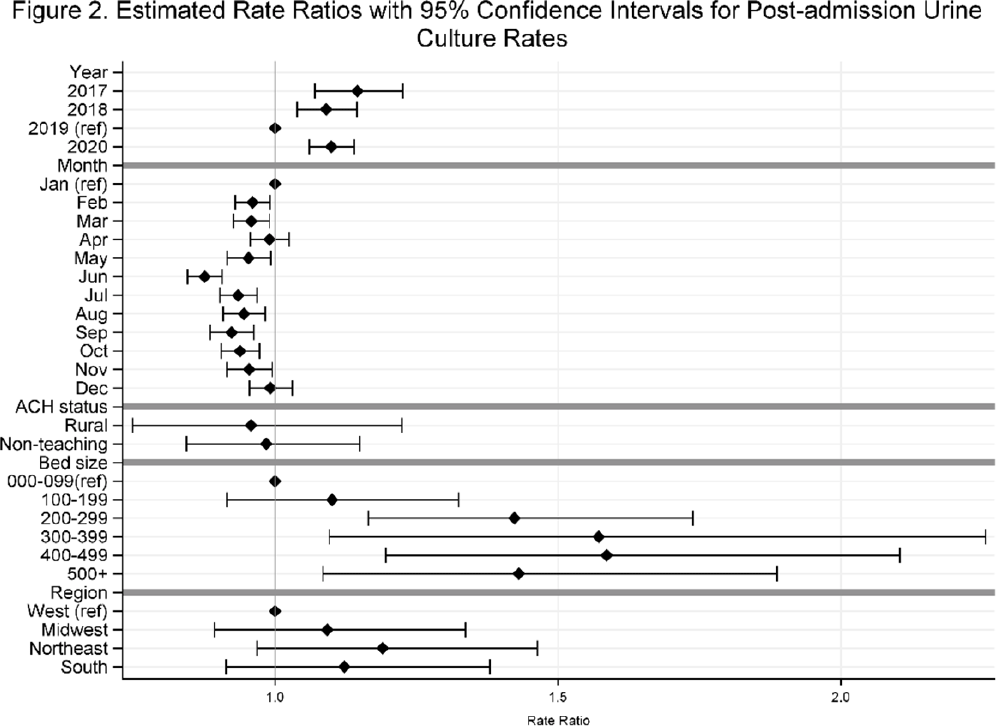
Background: Previously, we reported decreasing postadmission urine-culture rates in hospitalized patients between 2012 and 2017, indicating a possible decrease in hospital-onset urinary tract infections or changes in diagnostic practices in acute-care hospitals (ACHs). In this study, we re-evaluated the trends using more recent data from 2017–2020 to assess whether new trends in hospital urine-culturing practices had emerged. Method: We conducted a longitudinal analysis of monthly urine-culture rates using microbiology data from 355 ACHs participating in the Premier Healthcare Database in 2017–2020. All cultures from the urinary tract collected on or before day 3 were defined as admission urine cultures and those collected on day 4 or later were defined as postadmission urine cultures. We included discharges from months where a hospital reported at least 1 urine culture with microbiology and antimicrobial susceptibility test results. Annual estimates of rates of admission culture and postadmission urine-culture rates were assessed using general estimating equation models with a negative binomial distribution accounting for hospital-level clustering and adjusting for hospital bed size, teaching status, urban–rural designation, discharge month, and census division. Estimated rate for each year (2018, 2019, and 2020) was compared to previous year’s estimated rate using rate ratios (RRs) and 95% confidence intervals (CIs) generated through the multivariable GEE models. Results: From 2017 to 2020, we included 8.7 million discharges and 1,943,540 urine cultures, of which 299,013 (15.4%) were postadmission urine cultures. In 2017–2020, unadjusted admission culture rates were 20.0, 19.6, 17.9, and 18.2 per 100 discharges respectively; similarly, unadjusted postadmission urine-culture rates were 8.6, 7.8, 7.0, and 7.5 per 1,000 patient days. In the multivariable analysis, adjusting for hospital characteristics, no significant changes in admission urine-culture rates were detected during 2017–2019; however, in 2020, admission urine-culture rates increased 6% compared to 2019 (RR, 1.06; 95% CI, 1.02–1.09) (Fig. 1). Postadmission urine-culture rates decreased 4% in 2018 compared to 2017 (RR, 0.96; 95% CI, 0.91–0.99) and 8% in 2019 compared to 2018 (RR, 0.92; 95% CI, 0.87–0.96). In 2020, postadmission urine-culture rates increased 10% compared to 2019 (RR, 1.10; 95% CI, 1.06–1.14) (Fig. 2). Factors significantly associated with postadmission urine-culture rates included discharge month and hospital bed size. For admission urine cultures, discharge month was the only significant factor. Conclusions: Between 2017–2019, postadmission urine-culture rates continued a decreasing trend, while admission culture rates remained unchanged. However, in 2020 both admission and postadmission urine culture rates increased significantly in comparison to 2019.
Funding: None
Disclosures: None


A New Radiocarbon Database for the Lower 48 States
-
- Journal:
- American Antiquity / Volume 87 / Issue 3 / July 2022
- Published online by Cambridge University Press:
- 07 February 2022, pp. 581-590
- Print publication:
- July 2022
-
- Article
-
- You have access
- Open access
- HTML
- Export citation
Part 1 - Creating and Maintaining Identities
-
- Book:
- British and Irish Religious Orders in Europe, 1560-1800
- Published by:
- Boydell & Brewer
- Published online:
- 07 October 2022
- Print publication:
- 21 January 2022, pp 19-20
-
- Chapter
- Export citation
Frontmatter
-
- Book:
- British and Irish Religious Orders in Europe, 1560-1800
- Published by:
- Boydell & Brewer
- Published online:
- 07 October 2022
- Print publication:
- 21 January 2022, pp i-iv
-
- Chapter
- Export citation
List of Illustrations
-
- Book:
- British and Irish Religious Orders in Europe, 1560-1800
- Published by:
- Boydell & Brewer
- Published online:
- 07 October 2022
- Print publication:
- 21 January 2022, pp vii-vii
-
- Chapter
- Export citation
Notes on Contributors
-
- Book:
- British and Irish Religious Orders in Europe, 1560-1800
- Published by:
- Boydell & Brewer
- Published online:
- 07 October 2022
- Print publication:
- 21 January 2022, pp viii-x
-
- Chapter
- Export citation

British and Irish Religious Orders in Europe, 1560-1800
- Conventuals, Mendicants and Monastics in Motion
-
- Published by:
- Boydell & Brewer
- Published online:
- 07 October 2022
- Print publication:
- 21 January 2022
Part 4 - Intellectual Movements
-
- Book:
- British and Irish Religious Orders in Europe, 1560-1800
- Published by:
- Boydell & Brewer
- Published online:
- 07 October 2022
- Print publication:
- 21 January 2022, pp 201-202
-
- Chapter
- Export citation
