


Introduction
In the course of several oceanographic projects in the Ross Sea over the past two decades, we have had occasion to observe the position of the seaward edge of the Ross Ice Shelf. This “Great Icy Barrier”, discovered by Ross in January 1841 (Fig. 1), prevented his ships Erebus and Terror from proceeding south of about lat. 78° S. The ice shelves ceased to be obstacles to southward exploration around the beginning of this century, and the sources of their nourishment have since been identified and measured. The primary wastage terms, iceberg calving and in-situ melting into the ocean, remain less well known.

Fig. 1. From Ross (1847), reprinted in 1969 by A.M. Kelley, New York.
The characteristic tabular icebergs of the Southern Ocean are commonly believed to come from the large ice shelves. As in Ross’s account, we were initially puzzled by the lack of icebergs near the Ross Ice Shelf. “It was very remarkable we had not seen one [iceberg] during a run of 160 miles along the barrier, from which, no doubt, some must occasionally break away” (Reference RossRoss, 1847). Upon reflection, the obvious explanation was that, during an observation period of only several days, the probability was not high for encountering even a moderate-sized iceberg, derived from many years accumulation over a large area. We did note that small-scale wastage of the ice front seemed to be an ongoing process during the austral summer (December–February), with small chunks of ice frequently tumbling into the open sea. Perhaps this was consistent with the attrition of 7–23 m a–1 reported by Reference CraryCrary and Chapman (1963).
The ice front appeared to be advancing northward during the period of our observations, which were carried out at irregular intervals from January 1968 through February 1985. This advance was consistent with reports, estimates, and measurements of generally northward flow along the northern edge of the ice shelf (e.g. Reference DavidDavid, 1914; Reference MeckingMecking, 1928; Reference DorrerDorrer and others, 1969; Reference RobinRobin, 1975; Reference ThomasThomas and others, 1985). In addition, it is generally appreciated that “some segments of an ice shelf may yield icebergs at a more or less constant rate over a period of a few years, while other parts of the same shelf may experience only a single breakout in a decade or longer”(Reference SwithinbankSwithinbank and Reference ZumbergeZumberge, 1965). However, it did not seem that northward motion was being balanced by significant iceberg calving along most of the 750 km ice front. Spurred by reports of recent changes in the positions of other ice fronts (Kohnen, 1982; Reference DoakeDoake, 1985; Lange and Reference KohnenKohnen, 1985), we analyzed available Ross Ice Shelf data.
In this report we document positions of the northern terminus of the Ross Ice Shelf obtained from ships during the period 1968-85. Those positions are compared with historical locations dating back to 1841, and with satellite imagery from 1973–74 (ERTS₋1) and 1986 (NOAA-6). Apparent northward advance of the ice front is compared with independent measurements of ice velocity. Basal melting near the ice front is considered in relation to the mass budget of the ice shelf, and calving versus iceberg inventories in the Southern Ocean.
Data and Methods
We have occupied numerous océanographie stations within sight or radar range of the Ross Ice Shelf while engaged in research programs aboard USNS Eltanin and the U.S. Coast Guard icebreakers Northwind, Burton Island, Glacier, Polar Sea, and Polar Star. Radar ranges and bearings to the ice were made by the ships’ officers and crews at the start and end of station work or at regular intervals along the ice front. Ship positions were determined by satellite navigation, supplemented as necessary by dead reckoning, Approximately 150 ice-front positions were obtained at an average spacing of 5 km between long. 170°E. and 159°W. during 3 week periods in January-February 1983, 1984, and 1985. Additional detail was pro-vided in 1983 by Glacier personnel who sketched the ice front between radar positions. Scattered positions were obtained from more widely spaced fixes in January 1968, December 1976, January 1978, and February 1979.
We estimate the derived ice-front positions to be accurate to ±500 m. That is an order of magnitude less than the potential accuracy of the satellite navigation sets in use (U.S. Navy AN/SRN-9, Magnavox DDP-516, Magnavox 1107). However, it is consistent with the accuracy of ship-board position determinations (Taiwan! and others, 1966), and of similar ice-front measurements reported by Lange (in press). The relatively low accuracy results in part from errors introduced by the dead reckoning necessary between satellite fixes on a moving (sometimes manouvering) ship in a moderate current and usually strong winds. In addition, the accuracy of the Raytheon AN/SPS radars was 20–50 m, depending upon range to the ice. The times of radar ranging and satellite fixing were rarely coincident. On the positive side, up to three satellite positions are available each hour to a receiver near lat. 78 °S. Random errors not edited from the closely spaced fixes should have little influence on the averaged data sets. To reduce the noise from navigational and data-reduction errors, minor calving or large zonal motions, we discarded apparent changes more than one standard deviation from the mean.
Our error bars are of the same order as calculations of annual movement along the eastern section of the ice edge (e.g. Reference WexlerWexler, 1960). The data are thus of marginal quality for precise monitoring of year-to-year position changes in one locality. The potential value of the data lies in its use for investigating longer-term changes over regional areas.
Historical Data
We have digitized several historical maps that show the northern extremity of the Ross Ice Shelf, for comparison with the recent observations. Further caveats are needed here, since the accuracy of the earlier charts can be difficult to evaluate. Sections of the ice front charted by Ross (1847) were done from distances of up to 50 km. Some charts illustrate the ice front as a relatively wide band (a 1.5 km strip on U.S. Navy H.O. Chart 6636), perhaps to indicate its height above the sea surface. For consistency, we have digitized the northern edge of those bands. The widely used 1962 profile is to be preferred to an anomalous 1963 Edisto report in the Sailing directions for Antarctica (U.S. Naval Oceanographic Office, 1960, 1970 change) and to a 1956 ice front between long. 170° and 177°E. in Zumberge (1964), from U.S. Navy H.O. Chart 16384₋10. Position data we derived from small-scale reproductions of charts will be less accurate than the originals, some of which display “reconaissance only” warnings. The 1973–74 ice-front profile west of long. 173° W. was digitized from a map compiled from ERTS₋1 satellite imagery (U.S. Geological Survey, 1975).
Recent Advance
The ice-front profile for early February 1985 is shown in Figure 2, along with the ERTS₋1 1973–74 profile and scattered positions obtained in the austral summers of 1967–38, 1976–77, 1977–78, and 1978–79. From the reference position (U.S. Naval Océanographie Office, 1966[b]), it is clear that the entire ice front was considerably farther north in 1985 than in 1962. The minimum advance between 1962 and 1985 averaged 19.3 km, based upon the north-south distance between profiles at each half degree of longitude (~12 km). That is a minimum or apparent advance because it does not account for calving and other attrition at the north wall of the ice shelf. Also, we only measured the northward component of motion, which may be more or less than the actual advance in some other direction.

Fig. 2. Positions of the seaward ice front of the Ross Ice Shelf logged from ships in 1985 (solid line, from Polar Star). 1979 (square near long. 174° W„ from Glacier,), 1978 (triangles, from Burton Island). 1976 (open circles, from Northwind, and 1968 (solid circles, from Eltanin). The 1962 position (dashed line) is from chart No. H.O. 6636 (U.S. Naval Oceanographie Office, 1966[bJ). The 1973-74 position is from a satellite-image map (U.S. Geological Survey, 1975). Polar stenographic projection.
Apparent northward motion since 1962 has been greatest along the central part of the ice front (average of 24.7 km between long. 178° E. and 173° W.), and least along the western edge (average of 13.9 km between long. 170 E. and 178° E.). The general trend of the ice front, including major indentations like the Bay of Whales (~long. 164° W.) and “Coast Guard Bay” (~long. 174° E.), has been preserved over the past two decades. The Bay of Whales has under-gone large changes in configuration and orientation since the turn of the century (Reference ByrdByrd, 1930; U.S. Naval Oceano-graphie Office, 1960; Reference SwithinbankSwithinbank and Reference ZumbergeZumberge, 1965; Reference BertrandBertrand, 1971, 1971) but a report of its total disappearance (Defense Mapping Agency, 1985) may have been premature. The Bay of Whales is not well defined by our data but its westward orientation on the 1985 profile is supported by the 08 January 1986 AVHRR satellite image (Fig. 3). Kainan Bay, the small inlet near long. 162 °W. on the 1962 profile (Fig. 2) is missing or poorly defined on the 1983–85 profiles, but an indentation appears nears its expected location on the 08 January 1986 satellite image (Fig. 3).

Fig. 3. A NOAA-6 AVHRR (advanced very high resolution radiometer) satellite photoprint of the Ross Sea for 08 January 1986. The ice front closely resembles the 1985 profile in Figure 2. indicating little calving during the intervening year. The parallel black and white lines that extend south-west from the ice front are an artifact of satellite reception/data reduction that persisted throughout this period (personal communication from W. Poust. 1986).
The 1973–74 ERTS satellite profile from Ross Island to long. 179° E., and the 1968, 1977, 1978, and 1979 sightings generally fall between the 1962 and 1985 profiles (Fig. 2). The 1968 (Eltanin) position near long. 175° E. appears too far south, and the 1976 (Northwind) position near long. 178 °E. (reported in Jacobs and Haines (1982)) is too far north. The single 1979 (Glacier) position near long. 174 °W. is a poignant one, marking the site of a current meter deployed in 1978, not recovered in 1979, and beneath the ice shelf by the time of our next visit in 1983. That is not the only time capsule we have unintentionally deposited beneath the Ross Ice Shelf (see Reference BruchhausenBruchhausen and others, 1979).
Apparent northward movement is also discernible between the 1983, 1984, and 1985 profiles (Fig. 4), in spite of the problems inherent in utilizing these data over short periods. The average advance between 1983 and 1984 (0.6 km), and between 1984 and 1985 (1.2 km), is generally consistent with the movement between 1962 and 1985 (0.84 km a–1). Standard errors of the mean for these calculations were 0.2 km (1984–83), 0.1 km (1985–84), and 0.5 km (1985–62). An ostensibly smoother 1985 profile is the result of observations made while the ship was under way between Ross Island and long. 160° W., during which time its average range to the ice was ~15 km. The rougher 1983 and 1984 profiles were derived from data acquired during the occupation of océanographie stations nearer to the ice front.

Fig. 4. Positions of the seaward ice front of the Ross Ice Shelf logged from ships in 1985 (Polar Star J. 1984 (polar Sea J. and 1983 (Glacier). The 1962 position is from chart No. H.O. 6636 (U.S. Naval Océanographie Office. 1966[b]). Polar stereographic projection.
Historic Advance
Profiles derived from historical maps add some perspective to the recent changes in the ice-front position (Fig. 5). The shaded band in this figure represents the 1962-85 advance, from Figure 2. The data in Figure 5 show that the ice-front position has remained relatively stable over the past 144 years. The most southerly position of the ice front was recorded in 1902. “When our positions were plotted we fully realized the significance of the fact that our course throughout had been to the southward of Ross’s barrier and that we had sailed continuously over ground which in his day had been covered with a solid ice sheet” (Reference RossScott, 1905). A similar observation had been made in 1900 by Borchgrevink, who noted that the ice front in the Bay of Whales region had receded 30–50 km toward the south since Ross’s expedition (Reference BarkovBarkov, 1971). Ross’s coordinates for Cape Crozier at the eastern end of Ross Island place it about 25 km north-west of its position on a recent chart (U.S. Geological Survey, 1970). Reference MarkovMarkov and others (1968) interpreted a similar anomaly, by another navigator, as sufficient grounds to question Ross’s ice-front position, and its subsequent retreat between 1840 and 1902.

Fig. 5. Position of the rose ice shelf front (barrier) in 1841 –42 (Rose, 1847),1902 (Soctt, 1905),1911 (Reference PriestleyPriestley 1923),1948, and 1954–55 (New Zealand and Survey Dep., 1957, [note off set near long. 172° W]). The shaded band represent the 1962-85 (or 1984) advance from Figure 2. Polar stereographic Projection.
The most northerly reported position of the ice front east of ~long. 170° W. was in 1841–42 (Reference RossRoss, 1847) and west of ~long. 179° W. was in 1985 (Fig. 5). Ross combined observations in two successive years to produce the eastern section of his profile, where pack ice and icebergs are perennial obstacles to shipboard work. Allowing for probable uncertainties in Ross’s data, the most significant position change may thus be the most recent one, i.e. the record northward advance between Ross Island and long. 178° E. At long. 170°30’ E., the ice front had reached the latitude of Cape Bird (lat. 77° 10’ S.) at the northern end of Ross Island by February 1985. While the inlets near 171° E. and 174° E. suggest instabilities along this section of the ice front, “Coast Guard Bay” has persisted for at least 23 years.
The Bay of Whales may be the south-west-trending inlet near long. 163° W. on the 1842 profile (Fig. 5). The bay was entered in 1900 by Borchgrevink, whose ship (Southern Cross) reached a position of lat. 78°32’37 “S., long. 164° 32’45’ W. (personal communication from A. Reference JonesJones, 1986). A Norwegian chart of its shape in 1911 (redrawn in Reference HuntfordHuntford (1980)) shows somewhat greater detail than is portrayed here for the same date.
A map published by the New Zealand Lands and Survey Dept. (1957) shows a 40 km north-south offset between a 1948 profile west of long. 172° W., and a 1954–55 ice front east of that meridian (Fig. 5). These offset profiles also appear on a 1:6 000 000 scale map prepared by the American Geographical Society (1956), and on an undated chart accompanying the Sailing directions for Antarctica (U.S. Naval Océanographie Office, 1960). These maps indicate that major calving occurred between long. 178° E. and 172° W. at some time after 1948 and before the 1962 reference profile. West of long. 178° E., apparent northward motion between 1948 and 1962 slightly exceeded the 0.6 km a–1 recorded between 1962 and 1985. East of long. 172° W., apparent northward motion of 1.6 km a–1 between 1955 and 1962 seems rather high, perhaps due to the scale of the 1957 map, but it shows that general advance without major calving has prevailed there for at least 30 years.
We have not reproduced profiles from maps in publica-tions related to the Byrd Expeditions (Reference ByrdByrd, 1930; Reference JoergJoerg, 1930), due to the small scale and lack of exact dates Tor the ice front. Those maps, attributed to the National Geo-graphic Society and American Geographical Society, seem to locate the ice front too far south in the central sector. U.S. Navy Hydrographic Office Chart No. 6654 (first edition, 1946) shows the ice front at some unspecified time during the 1928–41 period. These charts alt show that Discovery Inlet persisted until at least 1930. Additional useful information may tie available in various archives and from photographs and flights made during the U.S. Antarctic Service Expedition, 1939–41, and Operation Hi-Jump, 1946–17 (Reference BertrandBertrand, 1971, 1971).
The 1902 and 1911 ice-front positions are from the work of the British Antarctic Expeditions aboard Discovery and Terra Nova. Discovery Inlet appears on both profiles and may be the north–south feature that Ross (1847) mapped near long. 169° W. Debenham calculated a minimum rate of movement of 1.3 km a–1 between long. 179° E. and 173 °W. from the 1902 and 1911 profiles (Reference SwithinbankSwithinbank and Reference ZumbergeZumberge, 1965), only slightly larger than our 1.1 km a–1 advance for this sector between 1962 and 1985. The near coincidence of the 1911 and 1962 profiles between long. 170° W. and 178° W. requires at least one calving event there during the interim. West of long. 178° E., apparent advance rates from 1911 to 1948 and from 1948 to 1962 are near 1.0 km a–1, versus 0.6 km a–1 from 1962 to 1985. This suggests minor calving since 1962 if velocity has been constant, and shows that major calving has not occurred along the western section of the ice shelf for at least 75 years.
Ice Velocity, Volume Flux, and Basal Melting
The apparent rate of advance of the Ross Ice Shelf front during the 1962–85 period agrees reasonably well with ice velocities obtained from glaciological data (Fig. 6). The measurements shown by vectors on Figure 6b are generally consistent with the velocity contours on Figure 6a, derived from earlier data. The average velocity along the ice front is 0.8 km a–1, based upon 1° longitude interpolations of the Figure 6a data, using 325 m a–1 east of long. 165° W. and a maximum of 1040 ma–1 near long. 179° W. Reference ThomasThomas and others (1984) reported a higher velocity (see below) near the ice front north-east of Roosevelt Island, and a lower velocity (1007 m a–1) in the central sector. Given the un-certainties involved, the 0.8 km a–1 average (the same as obtained by Reference MarkovMarkov and others (1968)) is fortuitously close to our 0.84 km a–1 advance. The comparison is less good between long. 171° E. and 177° E., where Figure 6a shows 0.9 km a–1 velocity versus our 0.6 km a–1 apparent advance. That also suggests some calving since 1962, but the east-west velocity gradients are high in that sector and recent velocity measurements are few (Fig. 6b). Between long. Figure 6 178° E. and 173° W., the 1.1 km a–1 advance we calculated from the shipboard observations agrees with the Figure 6 data and indicates little calving since 1962 along the central sector.

Fig. 6. Parts of Ross Ice Shelf velocity maps compiled by (a) Scott Polar Research Institute (unpublished [b]), (b) Reference ThomasThomas and others (1984). Some m a–1 contours in (a) were extrapolated from data obtained at a considerable distance from the (1962) ice front (see Reference RobinRobin, 1975).
East of long. 165°W., our apparent northward advance of 0.84 km a–1 is considerably higher than previous observa-tions (Fig. 6). Reference WexlerWexler (1960) calculated generally north-west motion of 0.32–0.46 km a–1 between 1911 and 1957 for several sites around long. 163° W., while Reference ThomasThomas and others (1984) reported a speed of 511 ma-1 toward 315° at long. 162° 13’ W. A north-west velocity of 511 ma–1 along this north-east-trending coastline would look like a northward advance of 723 m a–1. This illustrates the necessity of correcting for flow direction in any more detailed analysis than we are undertaking here.
Northward advance is most rapid along the central sector of the ice front, but that area has generally remained farthest south. While the Roosevelt Island pinning point no doubt exerts considerable influence, it might be expected that the full east-west profile of the ice front would be convex rather than concave to the north. The Filchner and Ronne Ice Shelves have northward-convex profiles (Reference RobinRobin and others, 1983; Lange and Reference KohnenKohnen, 1985). Icebergs may calve at more frequent intervals along the central Ross Ice Shelf as a consequence of the higher ice velocity there and enhanced basal melting. Water flowing under the Ross Ice Shelf is warmest in the central sector (Jacobs and others, 1979; Pillsbury and Reference JacobsJacobs, 1985) and is also warmer than water flowing beneath the Filchner and Ronne Ice Shelves (Reference JacobsJacobs, 1985). High basal melting rates could contribute to greater local calving by removing the less brittle lower layers of ice (Reference MacAyealMacAyeal and Reference ThomasThomas, 1986), thus rendering it more susceptible to fracture along existing rifts (Reference ShabtaieShabtaie and Bentley, 1982).
The volume of ice that remains since its advance beyond the 1962 ice-front position can be roughly estimated by referring to ice-thickness maps by the Scott Polar Research Institute (unpublished [a]) and by Bentley and others (1979). The thickness patterns in Figure 7a and b differ most near the ice front in the east longitudes near Ross Island. There the south-north thickness gradients are high and few control points (shown in Figure 7b only) extend to the ice front. Figure 7a shows a minimum thickness of <100 m, while the Figure 7b contours stop at 220 m. Thicknesses towards the lower end of this range appear in Shabtaie and Bentley (1982) and in Reference McCraeMcCrae (1984). Whatever thickness patterns existed when the observations were made, they are not likely to illustrate present conditions near the ice front if basal melting has been active and calving has been minimal in the interim. We have therefore used the simpler Figure 7a grid and contours to obtain a mean thickness of 240 m for the 20 km band nearest the ice front. That is slightly more than half the average Ross Ice Shelf thickness of 427 m (Reference DrewryDrewry, 1983).

Fig. 7. Parts of Ross lee Shelf thickness maps compiled by (a) Scott Polar Research Institute (unpublished [a]), (b) Bentley and others (1979). See caption to Figure 6.
Ice input to the Ross Ice Shelf drainage basin, including precipitation on the ice shelf, has been estimated at 300 km3 a–1 (Reference ZotikovZotikov and others, 1974), 327 km3 a–1 (Reference DoakeDoake, 1985), and 248 ± 40 km3 a–1 (Bentley, 1985). From our ice-front advance data, the area of the Ross Ice Shelf increased by ~14140 km2 between 1962 and 1985. At an average thickness of 240 m, that is equivalent to 3400 km3 of ice, or 148 km3 a–1. For comparison, Reference DoakeDoake (1985) calculated an ice output of 150 km3 a–1, while Reference BentleyBentley (1985) obtained 173 ± 17 km3 a–1 across about lat. 79° S. The difference between ice input and calving will be mostly accounted for by bottom melting, which oceanographic considerations place in the vicinity of 130 km3 a–1 (Reference JacobsJacobs and others, 1985). Contrary to most previous reports (e.g. table 3 in Reference MeierMeier, 1983), basal melting would thus appear capable of removing about as much ice as calving.
In the absence of appreciable iceberg calving, the surface accumulation, ice thickness, and spreading and ice-advance rates can be used to estimate basal melting. Near the ice front, surface accumulation is around 0.25 m a–1 (Reference ThomasThomas and others, 1984), observed advance is 0.84 km a–1, thinning by ice-shelf deformation is roughly 0.35 m a–1 (Reference ThomasThomas and others, 1984), and the thickness gradient is near 4 m km–1 where the contours are closest (Fig. 7). These numbers correspond to a basal melting rate of 3.26 m a–1, a value that is sensitive to the velocity and in particular to the thickness gradients, which appear to vary considerably along the ice front (Figs 6 and 7).
It has long been appreciated that basal melting is highest near the ice front (e.g. Reference WexlerWexler, 1960; Reference CraryCrary, 1961, Reference ZumbergeZumberge, 1964). Océanographie data suggest there will be variability due to east–west differences in ocean-heat content and current velocity. However, the thinnest ice in Figure 7, near the ice front east of Ross Island, probably results from a relatively long residence time near the ice front, rather than more rapid melting in that sector. Detailed calculations of mass balance near the Ross Ice Shelf front at long. 162°13’ W. (Reference CraryCrary and Chapman, 1963) resulted in a bottom-melting value of only 0.6 m a–1. On the other hand, Kohnen (1982) has estimated bottom melting of 3.2 m a–1 at 20 km south-west of the Ronne Ice Shelf front at long. 50° W. Lewis and Perkin (in press) suggest a potential melting rate above 5 m a–1, driven solely by the pressure dependence of the freezing temperature of sea-water near the McMurdo Ice Shelf edge in McMurdo Sound.
If 3 m a–1 were a representative rate for melting, the 50 km band along the entire length of the ice front, that would account for about 120 km3 of ice, the major part of the melting estimated for the entire Ross Ice Shelf base. A melting rate of that magnitude, in combination with a long residence time, implies that radio echo-sounding profiles at decadal intervals should reveal measurable thickness changes. The combined data indicate the importance of basal melting but are as yet inadequate to determine whether the ice shelf is in a state of mass balance.
Recent Behavior of Other Antarctic Ice Shelves
Like the Ross Ice Shelf, some other ice shelves have been advancing over the last two decades. Lange (in press), and Lange and Reference KohnenKohnen (1985) have reported a general advance of three West Antarctic ice shelves between long. 06°W. and 61°W. since 1956. Apparent advance rates from 1980 to 1984 ranged up to 1.7 km a–1 near the center of the Ronne Ice Shelf. Since long-term (1967–84) apparent advance rates were 20-40% less than 1980-84 rates, Lange and Reference KohnenKohnen (1985) suggested that some calving had occurred along the Ronne Ice Shelf since 1957. However, constant ice velocity may not be a safe assumption. Reference ZakharovZakharov and Kotlyakov (1980) indicated increased velocities and advance rates of ice edges after the calving of large icebergs. Reference SimmonsSimmons and Rouse (1984) have documented an acceleration from 430 m a–1 to 740 m a–1 in the rate of flow during the 1968–83 period at Halley Station near long. 27 °W. on the Brunt Ice Shelf. Reference McCraeMcCrae (1984) has tabulated recent velocity changes on the McMurdo Ice Shelf, south of Ross Island.
In contrast to the large ice shelves, several smaller ones have exhibited recent ice-front retreats. Reference DoakeDoake (1985) showed that the ice fronts of the Wordie and George VI Ice Shelves (long. 67–69°W.) have receded in the 1974 (or 1949) to 1979 period. The Amery Ice Shelf front experienced major calving in 1963–64 but considerable uncertainty exists about several of its reported positions (Reference HoldsworthHoldsworth, 1985). Several of the large glacier tongues have advanced during the past two decades (e.g. the Drygalski Ice Tongue and the Erebus Glacier tongue in the western Ross Sea), while others have receded via calving (e.g. Trolltunga near long. 01°W.) (Reference HoldsworthHoldsworth, 1974, 1985; Reference McClainMcClain, 1978). The Trolltunga calving resulted in one of the largest modern icebergs (~3325 km2 from data in Reference HoldsworthHoldsworth (1985)). On the longer term, the Bellingshausen (Fimbul?) and Larsen Ice Shelf fronts (˜long, 03 °W. to 17 °E.) receded an average of 70–80 km between about 1820 and 1960 (Reference BarkovBarkov, 1971).
Iceberg Inventories
If the Antarctic ice sheet is in a state of mass balance, the low rate of iceberg production along the major ice shelves may be at odds with recent calculations of iceberg volume in the Southern Ocean. Reference OrheimOrheim (1985) has reported preliminary results from an on-going project to census Antarctic icebergs from ships of opportunity. Extrapolating 1977-84 observations of over 30000 size-classified icebergs to the area of the Southern Ocean and applying a 4 year half-life resulted in a mean calving rate of 2.3 – 103 km3a–1. That value exceeds most estimates of iceberg calving (0.6–1.7 – 103 km3 a–1 in Reference OrheimOrheim (1985) and Reference MarkovMarkov and others (1968)), and is about the same as recent accumulation figures (2.2–2.7 – 103 km3 a–1 in Giovinetto and Reference BentleyBentley (1985) and Reference DoakeDoake (1985)). If basal melting of the ice shelves were added to the Reference OrheimOrheim (1985) calving figure, then the mass budget of the ice sheet would be negative by several hundred km3 a–1, contrary to practically all estimates (e.g. Reference MeierMeier, 1983; Bentley, 1985). Furthermore, iceberg counts appear to be yielding high calving rates during a period when the major ice shelves have not been very productive (see also Lange, in press). In recent years, many of the observed icebergs may have been coming from the smaller ice shelves and that 51% of the Antarctic coastline (Reference DrewryDrewry, 1983) fringed by outlet glaciers, ice streams, and grounded ice walls (e.g. Reference KeysKeys, 1985).
The large Antarctic ice shelves may not be contributing much to present-day iceberg volumes but presumably they have done so in the past. Reference BurrowsBurrows, (1976) summarized extreme northerly iceberg sightings in the Southern Ocean from 1770 through 1970. Reference JonesJones (1985) has tabulated iceberg sightings between 1828 and 1870, primarily in the South Pacific Ocean. Avoiding speculation about relationships between icebergs at low latitudes and exceptional calving of Antarctic ice, Reference BurrowsBurrows, (1976) commented that “the presence of some very large tabular bergs suggests that there may have been an element of abnormality in the 1850’s, 1890’s, 1904–10 and 1927–33”. The historical ice-front data provide a qualitative means to determine whether those unusual “irruptions” of icebergs were related to major calving episodes of the large ice shelves.
Positions of the Ross Ice Shelf front from 1841 to 1985 at long. 171° 30’W. and 170°30’E. are plotted in Figure 8. The 171°30’W. longitude represents the central sector of the ice shelf, east of the 1948–54 offset but west of Discovery Inlet. The 170° 30’E. meridian is where the ice-shelf front is now at its most northerly location. Observed ice-front positions (from Figures 2, 4, and other data) are connected by heavy lines, with lighter solid-line extrapolations at slopes corresponding to ice-shelf velocities at each longitude (from Fig. 6). The 1928–30 Byrd Expedition position (three dots in parentheses) at long. 171°30’W., from a map in Reference JoergJoerg (1930), is probably anomalous. It seems unlikely that the ice front at long. 171° 30’W. could have calved the volume of ice necessary to re-attain its 1902–11 position without eliminating Discovery Inlet at long. 170°–171°W. The 1935 positions (single dots in parentheses) are approximated from the following: “The 1935 survey [by Lt. English on Bear of Oakland] showed a general advance of about 12 miles during the intervening 24 years … [0.9 km a–1]. The contour irregularities in the face of the barrier … were in very close agreement with the results obtained in 1911” (U.S. Naval Oceanographic Office, 1960). Horizontal dotted lines from 1928–41 reflect uncertainty about the date of the ice front shown on H.O. Chart 6654 (U.S. Navy Hydrographic Office, 1946[b]).

Fig. 8. Low-latitude iceberg sightings in the Pacific (long. 90°W.–180°) and Australian (long. 90°E.–180°) quadrants of the Southern Ocean (black bars at center, from table 1 in Reference BurrowsBurrows, (1976)) in relation to possible retreats (dashed lines) of the northern edge of the Ross Ice Shelf at long. 171°30’W. (top) and 170°30’E. (bottom) between 1840 and 1985. Slopes of the solid lines (ice-shelf advance), except between observed positions (open circles), are taken from ice-shelf velocities shown in Figure 6. The 1928–41 observations (in parentheses) are discussed in the text.
Icebergs produced along the Ross Ice Shelf seem most likely to drift into the Pacific (long. 90°W.–180°) and Australian (long. 90°E.–180°) quadrants (e.g. Reference TcherniaTchernia and Jeannin, 1983). Low-latitude iceberg sightings in those two quadrants (from table 1 in Reference BurrowsBurrows, (1976)) are indicated in Figure 8. Vertical dashed lines have been placed at the beginning of each Pacific quadrant iceberg irruption reported to extend over more than 1 year. From several possible cycles of ice-shelf advance and retreat, the scenarios that minimize north–south excursions of the ice front are highlighted. If any periodicity exists in these data, it would appear to be longer than the 15–30 years quoted by Reference ZakharovZakharov and Kotlyakov (1980) for calving from the Filchner, Ronne, and Larsen Ice Shelves.
The hypothetical advance and retreat of the Ross Ice Shelf illustrated by Figure 8 must be interpreted with caution. There are large gaps in the data sets. Some of the iceberg observations can be related to the possible times of ice-shelf retreat, but a lag of several years might be expected between calving events and low-latitude iceberg sightings (e.g. Reference McClainMcClain, 1978). Calving episodes that are simultaneous along the entire ice front may not occur, but some regions may be susceptible to a step-wise recession over several years and other areas to abrupt 40–50 km break-outs. The lower apparent advance rate between 1962 and 1974 along long. 170° 30’ E. again suggests a minor retreat during that time. Reference McCraeMcCrae (1984) has considered the evidence for a relationship between ice break-outs and velocity fluctuations on the adjacent McMurdo Ice Shelf during the same period.
The 1904–10 abnormal period cited by Reference BurrowsBurrows, (1976) would not seem to implicate the Ross Ice Shelf, although there may have been contributions from the Bay of Whales vicinity and from long. 172°–178° E. (Fig. 5). The 1935 Bear of Oakland observations cited above suggest that most of the Ross Ice Shelf continued its northward advance from 1927 to 1933. Northern iceberg concentrations during that period might be accounted for by a recession of the Filchner Ice Shelf (Reference BurrowsBurrows, 1976; Reference DeaconDeacon, 1984).
Parts of the Ross Ice Shelf front may now be at or beyond latitudes where calving has occurred historically (Fig. 8). While the ice shelf has made an impressive advance over the past few decades, that is probably of less significance than its apparent longer-term stability. Indeed, Thomas and Reference MacAyealMacAyeal (1982) and Reference BentleyBentley (1985) believed that the ice shelf and its ice streams have been in approximate steady state for the past 1500–2500 years. A saw-tooth cycle, i.e. slow advance and rapid retreat of the ice front, within the range displayed over the past century and a half, should not have a major influence on the ocean circulation. Some minor impacts might be expected on bottom-dwelling organisms near the ice front, and melting should leave most basal debris beneath the ice shelf. The data reported here are inadequate to answer important questions of periodicity or climatic forcing of ice-shelf advance and retreat. It will be of interest, however, to monitor the ice shelves’ response to a warmer ocean and to increased precipitation on the continent, if those are the direct outcomes of a projected warming of the atmosphere.
Summary
-
Over the past 24 years, the front of the Ross Ice Shelf has advanced northward at an average rate of 0.8 km a –1 without major calving episodes. In the east longitudes near Ross Island that advance has persisted for at least 75 years, with the ice front now (January 1986) at the most northerly reported position since its discovery in 1841.
-
On time periods of a few decades or less, low iceberg-calving rates may be typical for this and other ice-shelf fronts. Long intervals of steady advance and minor attrition may be interspersed with relatively brief recessions. Some evidence for these latter events may exist in historical records of sightings of unusually large numbers of icebergs at low latitudes in the Southern Ocean.
-
The unexpectedly long residence time of shelf ice near its seaward front (barrier) enhances the role of basal melting versus iceberg calving in attrition of the ice shelf. Melting (and freezing) may redistribute ice on the ice-shelf base via a cycle driven by the pressure depend-ence of the freezing temperature. Basal melting thins and weakens the ice, increasing its susceptibility to fracture along existing faults (crevasses), and may thereby influence the timing of calving events. Thinner ice at some longitudes along an ice front may signify enhanced ocean heat flux or longer ice-residence time near the front.
-
Existing data on the Ross Ice Shelf advance, thickness, spreading, and surface-accumulation rates imply basal melting around 3 m a–1 near the ice front. That is not inconsistent with oceanographic data, which suggest that basal melting must be nearly as large a factor as iceberg calving in maintaining the ice-shelf mass balance. Rough melting estimates might be refined considerably by repeated radio echo-sounding profiles across the ice front. Measurements of ice-shelf fronts and thicknesses (elevations) will be necessary to monitor ice-shelf mass balance by satellite.
-
Ice shelves encompass 44% of the Antarctic coastline (Reference DrewryDrewry, 1983) and drain about 60% of the Antarctic ice sheet (Reference MarkovMarkov and others, 1968). Infrequent (>decadal) calving intervals along the ice shelves implies that ship or satellite iceberg censusing for mass-budget studies may be a long-term project. A recent estimate of (negative) ice-sheet mass balance (Reference OrheimOrheim, 1985) was based on iceberg observations from ships during a several-year period when the major ice shelves were relatively inactive sources. Significant basal melting added to that projection would imply a more negative budget.
-
In the future, the fringes of the Antarctic ice sheet may best be monitored via altimeters aboard polar-orbiting satellites, particularly those scheduled for launch in 1990 as part of the ERS–1 and NROSS programs (Reference ThomasThomas and others, 1983, 1985; Reference WilliamsWilliams, 1985; Reference ThomasThomas, 1986). Those platforms will extend coverage to lat. 82 S., versus the Landsat/Geosat limits of lat. 72°S. However, repeated circum-polar surveys of the ice-sheet margin from ships equipped with highly accurate Global Positioning System (GPS) satellite navigation would provide valuable base-line and ground-truth information.
Maps
American Geographical Society. 1930. Map of the region from the Ross Sea to the South Pole. Scale 1:6,000,000. (In Joerg, 1930.)
American Geographical Society. 1956. Antarctica. Scale 1:6,000,000. (In Antarctica in the International Geophysical Year. Washington, DC, American Geophysical Union. (Geophysical Monograph 1.))
Note Added in Proof
In the foregoing paper we observed that the major Antarctic ice shelves have been advancing over the past two decades without significant iceberg calving. Several recent developments have changed that picture. In the western Weddell Sea, a large protuberance that had existed on the Larsen Ice Shelf at least since 1947 (Reference HoldsworthHoldsworth, 1985) spawned a giant iceberg between mid-January and early March 1986 (Fig. 9a and b). That iceberg moved northward along the ice-shelf front, perhaps contributing via collision to the calving of a smaller iceberg, and broke into two or more pieces by the time it had reached lat. 65 °S. in early September 1986. According to dimensions reported by the U.S. Naval Polar Oceanography Center, the biggest Larsen iceberg would initially have been around 9 – 103 km2, much larger than Trolltunga iceberg of 1967–78 (McClain, 1978; Reference HoldsworthHoldsworth, 1985). Indeed, it was larger than the States of Delaware and Rhode Island combined.
In the southern Weddell Sea, the Filchner Ice Shelf developed major fractures during June 1986 (Fig. 9a and c). By 21 September 1986 three large (≈50 km on a side) icebergs had separated from the ice shelf (personal communication from D. Barnett). The total area of the Filchner and Larsen icebergs implies a volume roughly thrice the annual accumulation on the Antarctic continent. The calving of these very large icebergs presents opportunities for measuring the important parameters of new ice fronts. Subsequent long-term monitoring of surface accumulation, ocean heat flux, ice-shelf profile, and thickness should improve our knowledge of basal mass balance and advance rates after break-outs.

Fig. 9a. a. Large icebergs have recently calved from the Larsen and Filchner Ice Shelves at the locations shown by fracture lines. The dashed line shows the track of the primary Larsen iceberg through early September 1986. (Modified from a chart distributed in early August 1986 by the U.S. Naval Polar Oceanography Center. Suitland. Maryland.)
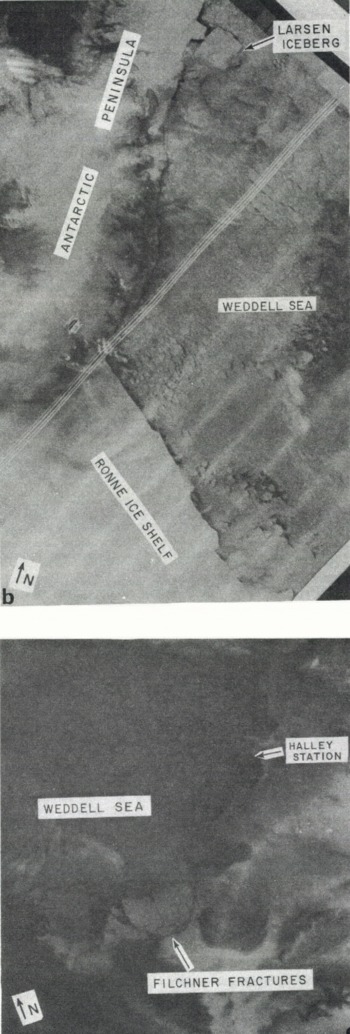
Fig. 9b. b. Part of a NOAA-6 AVHRR satellite photoprint for 05 March 1986. The largest Larsen iceberg has calved and is rotating northward around a projection that later also separated from the ice shelf. (Image from U.S. NOAA Satellite Data Service. Camp Springs. Maryland.) c. Part of a NOAA-9 AVHRR satellite photoprint for 02 August 1986, showing the fractures that are depicted in Figure 9a. The resulting icebergs caused a recession of the Filchner Ice Shelf front of about 50 km. (Image from U.S. NOAA Satellite Data Service, Camp Springs, Maryland.)
Acknowledgements
W. Haines and S. Rennie assisted with map digitizing and programming; and B. Caterina with typing. P. Hofman (CIRES) and R. Smith (National Archives) assisted in locating published charts. Many people helped to obtain, process, and evaluate the navigation and ranging data. A. Gordon, G. Kukla, C. Bentley, A.G.E. Jones, E.L. Lewis, and an anonymous referee made helpful comments on earlier drafts of the paper. This work was supported by grants DPP-81₋19863 and DPP-85₋12540 from the U.S. National Science Foundation, with assistance from the Department of Energy through Interagency Agreement DE-A101-84ER60201. This is Lamont-Doherty Geological Observatory contribution 4012.


