


Iodine deficiency is of public health concern because iodine is an essential component of the thyroid hormones, thyroxine and tri-iodothyronine, that are required for brain and neurological development of the fetus( Reference Zimmermann 1 ). Recent UK evidence suggests that even mild-to-moderate iodine deficiency during early pregnancy is associated with impaired child cognition, with lower intelligence quotient (IQ) and reading scores in the offspring of iodine-deficient pregnant women( Reference Bath, Steer and Golding 2 ).There is concern that pregnant women( Reference Bath and Rayman 3 ) and teenage girls( Reference Vanderpump, Lazarus and Smyth 4 ) in the UK are mildly-to-moderately iodine deficient. Indeed, the ‘Global Scorecard of Iodine Nutrition’ classifies UK pregnant women as iodine deficient, although school-aged children are classified as iodine sufficient( 5 ).
Cows’ milk is a rich source of iodine in many countries, its high iodine content being a result of dairy-farming practices( Reference Phillips 6 ). The use of iodine-fortified concentrates given to cattle (particularly in the winter months) and iodine-containing disinfectants (iodophors) increase the natural iodine concentration of milk( Reference Phillips 6 ). Though iodophor disinfectants have been replaced by other disinfectants in some countries (e.g. in New Zealand( Reference Thomson 7 ) and Australia( Reference Li, Waite and Ma 8 )), they are still permitted( 9 ) and used in the UK. The iodine concentration of UK milk (median 300 μg/kg from the 2008 Food Standards Agency survey)( 10 ) is higher than that of other countries, for example Australia (median 195 μg/l (≡189 μg/kg assuming a specific gravity of 1·03( 11 )))( Reference Li, Waite and Ma 8 ), Spain (mean 259 μg/l (≡251 μg/kg))( Reference Soriguer, Gutierrez-Repiso and Gonzalez-Romero 12 ) and Denmark (mean 120 μg/l (≡117 μg/kg))( Reference Rasmussen, Carle and Jorgensen 13 ). Furthermore, as the UK has no programme of iodine fortification and the availability of iodised salt is low( Reference Bath, Button and Rayman 14 ), the UK is heavily reliant on dairy products for iodine intake. Indeed, milk and dairy products are the principal source of dietary iodine in the UK, accounting for approximately 33 % of the intake in adults (19–64 years) and 40 % in adolescents (11–18 years)( Reference Bates, Lennox and Prentice 15 ). Consumption of cows’ milk has been positively associated with iodine status in UK pregnant women( Reference Bath, Walter and Taylor 16 ), women of childbearing age( Reference Bath, Sleeth and McKenna 17 ), adolescent girls( Reference Vanderpump, Lazarus and Smyth 4 ) and 8–10-year-old children( Reference Bath, Combet and Scully 18 ).
Though milk consumption has remained relatively steady in recent years, there has been a decline since the 1950s( 19 ). Meanwhile, plant-based drinks, particularly soya drinks, have increasingly been used as substitutes for cows’ milk( 20 ). Consumers may choose these cows’ milk alternatives if they cannot tolerate dairy products, for example, as a result of milk allergy or lactose intolerance( Reference Meyer 21 ). Alternatively, they are chosen for cultural, ethical, environmental, or perceived health reasons.
There has been a surge in the number of milk alternatives on the UK market in recent years, with companies launching various nut, rice, coconut and oat drinks. Though milk-alternative drinks have a relatively small share of the total milk market (2 % share by volume)( 22 ), the sector has experienced rapid growth in recent years( 20 , 22 ). From 2011 to 2013, the volume of milk alternatives sold (including soya and rice drinks) increased by 155 % from 36 to 92 million litres/year( 20 ). These drinks are increasingly a part of mainstream shopping habits, for example, soya (and, more recently, coconut) is offered as a milk substitute in many UK cafés and coffee chains. Almond drinks have risen in popularity and are outselling soya drinks in some UK supermarkets( 23 ). It is reported that 10 % of UK consumers have used soya drinks and 7 % have used almond drinks( 24 ); consumers of these drinks are not necessarily using them exclusively, with an estimated 6–8 % of cows’ milk consumers also using plant-based alternative drinks( 24 ).
It is important to understand how the shift away from iodine-rich dairy products to these milk alternatives may affect iodine status in the UK, given the major contribution of milk and dairy products to iodine intake( Reference Bates, Lennox and Prentice 15 ). Although there are data on the iodine concentration of a limited number of milk-alternative drinks from the USA( Reference Ma, He and Braverman 25 ), there is no information on the iodine concentration of such drinks available in the UK; the McCance and Widdowson UK food tables only provide an iodine value for soya drinks( 11 ). We therefore aimed to compare the iodine content of available milk-alternative drinks with that of UK cows’ milk. Our hypothesis was that these drinks were an inadequate replacement for cows’ milk with respect to dietary iodine.
Methods
Selection of samples for laboratory analysis
We first surveyed the consumer market between October 2013 and February 2014 to establish the range of milk-alternative products available for purchase in the UK and the extent of iodine fortification( Reference Bath, Nezianya and Rayman 26 ). That survey included twenty grocery chains (including a health-food shop), and identified twenty-eight brands (including supermarket own-brands) that produced milk-alternative drinks( Reference Bath, Nezianya and Rayman 26 ).
In November 2015, the results of the 2013–2014 survey( 11 ) were reviewed and updated (online Supplementary Table S1), omitting flavoured drinks and those only available in health-food shops and online. Several products had been discontinued (including an iodine-fortified soya drink), whereas other products had been launched. This resulted in a list of ninety drinks from twenty brands and this was then used to select samples for laboratory measurement of iodine in milk-alternative drinks.
Resources were available for the measurement of approximately fifty drink samples. As it was not possible to analyse all ninety drinks identified in the updated survey of November 2015, the following selection criteria were applied: drinks that were: (i) long-life, (ii) unsweetened (except some sweetened drinks, as explained below), (iii) unflavoured and (iv) widely available from major retail outlets (i.e. not those only available via online-only health shops). This included three drinks (soya, oat and rice) from one brand (Marks & Spencer) that were fortified with iodine (as potassium iodide) according to the product label. In addition, chilled products were included from the market leader, and some sweetened drinks where these were labelled as ‘original’ and therefore likely to be a popular choice with consumers (e.g. Alpro Original). Where possible, we also included samples of drinks that incorporated seaweed as a source of Ca as this is also a likely source of iodine. We purchased one sample of each milk-alternative drink for laboratory analysis.
Cows’ milk samples were also acquired at the same time as milk-alternative drinks (November/December 2015). Samples of supermarket own-brand fresh semi-skimmed (<2 % fat) conventional and organic milk were obtained from five leading supermarkets (total market share 77·0 %( 27 )). Semi-skimmed milk was chosen as this is the most commonly consumed milk type in the UK( 22 ). Milk-alternative drinks and cows’ milk were purchased on two occasions in the winter (November/December 2015), either online via supermarket websites or from stores in various locations in Surrey, UK. The samples were transferred to the laboratory at LGC Limited. Chilled samples were kept below 5°C until they were digested (within 48 h).
Laboratory analysis
Sample preparation and analysis were performed using a method previously validated in-house against a primary reference method, namely isotope dilution MS( Reference Santamaria-Fernadez, Evans and Wolff-Briche 28 ). In brief, the samples were first digested by mixing 0·5 g liquid (weighed to four decimal places) in a glass vial with 5 ml of 5 % tetramethylammonium hydroxide (TMAH), prepared using solid TMAH (≥97 %; Sigma Aldrich) dissolved in ultrapure water (18·2 MΩ cm; Elga PureFlex; Elga Veolia). The vial was placed in a preheated oven at 100°C for 2 h. Once cooled, 0·5 ml of internal standard (1300 ng/ml Tellurium; Romil, in 1 % TMAH) was added and the samples were made up to 50 g with 1 % TMAH. Tellurium was selected as internal standard as it has a similar ionisation energy and isotopic mass:charge ratio to iodine and has been previously demonstrated in-house to be suitable for use with food samples.
The iodine content in the digested samples was determined by inductively coupled plasma-MS (8800 ICP-QQQ-MS; Agilent Technologies) in standard analysis mode using external calibration. The stock standard solution for iodine was gravimetrically prepared in-house from high purity potassium iodide (+99·99 %; Alfa Aesar) in 5 % TMAH. The calibration standards were prepared by serial dilution of this stock, using 1 % TMAH, with the internal standard also added at the same level as in the samples.
The relative measurement uncertainty (±10 %) was calculated using in-house validated ISO/IEC 17025 accredited procedures and in accordance with the Guide to the Expression of Uncertainty in Measurement (GUM, JCGM 100:2008). The method accuracy was monitored using ERM-BD150 Skimmed Milk Powder certified reference material (LGC Standards) with a certified iodine content of 1730 (sd 140) μg/kg (dry weight basis). The recovery of the certified reference material was 92 % (n 4, dry weight basis) which is within the uncertainty of the certified reference material and the accredited measurement uncertainty. In addition, four samples were spiked using the calibration standard stock and showed recoveries in the range 95–99 % (relative sd ±2 %). The limit of quantification (LOQ) was 3·6 µg/kg.
Statistical analysis
A minimum sample size of two was required to detect a difference in iodine concentration of at least 275 μg/kg between the milk-alternative drinks (not fortified with iodine) and conventional cows’ milk( 11 ), with 80 % power and 5 % significance (two-sided test). These calculations are based on mean and standard deviation values from the literature for both conventional cows’ milk( 10 ) and milk-alternative drinks( Reference Ma, He and Braverman 25 ).
The number of samples for each matrix was small (n<14) and as the iodine concentration results were not normally distributed, the medians and 25th, 75th percentiles (where possible) are reported. The results for the three drinks that were fortified with potassium iodide are reported separately to the unfortified milk-alternative drinks.
The non-parametric Mann–Whitney U test was used to compare the difference in iodine concentration between conventional cows’ milk and firstly, all matrices of milk-alternative drinks, and secondly, organic cows’ milk.
The iodine concentration was calculated as a percentage of that of conventional cows’ milk in three ways: (i) of winter cows’ milk samples collected and analysed for the current study; (ii) of summer cows’ milk samples (from a previous study that analysed eighty samples collected in 2009 with the same method, in the same laboratory( Reference Bath, Button and Rayman 29 )); and (iii) as an average of the summer and winter cows’ milk values to give an all-seasons percentage value.
Results
Iodine concentration of milk-alternative drinks
In all, forty-seven milk-alternative drinks from twenty brands were selected for laboratory analysis, that is 51·1 % of the ninety drinks available in November 2015 (online Supplementary Table S1). We included samples from all twenty brands which amounted to fourteen soya, eleven almond, six coconut, six oat, five rice, three hazelnut and two hemp drinks. We analysed between 30·4 (for soya) and 100 % (for hazelnut and hemp) of available drinks within each matrix (online Supplementary Table S1).
The majority of the samples were long-life (n 40, 85·1 %) but seven samples (14·9 %) were chilled (online Supplementary Table S1). Though most samples were non-organic (80·9 %), nine organic samples (19·1 %), at least one from each matrix, were included in the sample selection (online Supplementary Table S1).
The unfortified milk-alternative drinks had a low iodine concentration (Table 1; Fig. 1); the median for all milk-alternative drinks that were not fortified with iodine (n 44) was 7·3 µg/kg (25th, 75th percentile: 4·6, 13·4; Table 1). The median iodine concentrations for the different matrices ranged from 4·1 to 21·7 µg/kg and the results are detailed in Table 1. A considerable number of samples (n 13; 27·7 %) had an iodine concentration that was below the LOQ for the assay (3·6 µg/kg). One brand of oat drink had a relatively high iodine concentration (63·1 μg/kg) compared with other oat-based drinks so an additional sample was analysed in the second laboratory run to check the value. It was again found to be high (73·4 μg/kg); the two results were averaged.

Fig. 1 Iodine concentration (μg/kg) in milk-alternative drinks in the UK in comparison with all-season conventional (344 μg/kg) and all-season organic cows’ milk (234 μg/kg); values for both conventional and organic milk averaged from the median values from summer samples (from our previous publication( Reference Bath, Button and Rayman 29 )), and winter samples (from Table 2). Values are medians, and 25th, 75th percentiles represented as error bars. Hatched bars represent milk-alternative drinks fortified with iodine. Error bars are not shown for hazelnut, hemp or iodine-fortified drinks as a result of the small sample size (n≤3). For information on the number of samples, statistical significance and further details see Table 1.
Table 1 Iodine concentration of unfortified and iodine-fortified milk-alternative drinks in the UK, by matrix, and iodine concentration, as a percentage of that of conventional cows’ milk (Medians and 25th, 75th percentiles)
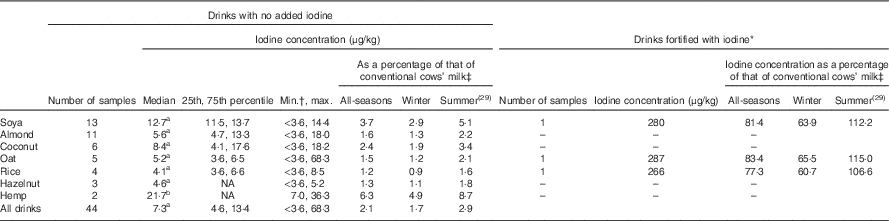
NA, not possible to compute as a result of the small sample size.
a Significantly lower than conventional milk (P<0·05; Mann–Whitney test); b lower than conventional cows’ milk (P=0·051).
* Iodine listed in ingredient list on product label.
† The limit of quantification for the assay was 3·6 μg/kg; the value was set to 3·6 μg/kg for any samples with a concentration below the limit.
‡ Values are the percentage of all-seasons conventional cows’ milk and the percentage of winter (i.e. Table 2) and summer milk (from our previous study( Reference Bath, Button and Rayman 29 )). The value for all seasons was taken as taken as 344 μg/kg, an average of the median values from winter (from Table 2) and summer milk samples (from our previous study( Reference Bath, Button and Rayman 29 )).
One brand (Marks & Spencer) fortified three (soya, oat and rice) of their five milk-alternative drinks with iodine; according to the product labels, the drinks were fortified to give an iodine concentration of 225, 289 and 307 µg/l for the soya, oat and rice drinks, respectively. The laboratory results for these three fortified drinks were 280, 287, and 266 µg/kg for the soya, oat and rice, respectively (Table 1); the iodine concentration was considerably higher than in the unfortified drinks of the same matrix (Fig. 1). Assuming a density of 1 g/ml for these drinks, the measured values are within ± 0–20 % of the values reported on the labels.
Iodine concentration of cows’ milk and comparison with milk-alternative drinks
The conventional cows’ milk samples had a median concentration of 438 μg/kg, a value that was higher than all the unfortified milk-alternative matrices. The unfortified milk-alternative drinks had an iodine concentration that was 1·7 % (range 0·9–4·9; Table 1) of the cows’-milk value.
The median iodine concentration of the organic-milk samples (324 μg/kg) was 26 % lower than that of the conventional-milk samples, a difference that was statistically significant (Mann–Whitney U test: P=0·009, Table 2). The iodine concentration of the milk-alternative drinks was considerably lower than the calculated year-round values for conventional and organic cows’ milk (344 and 234 µg/kg, respectively) (Fig. 1).
Table 2 Iodine concentration organic and conventional cows’ milk samples collected in the winter (November/December 2015) (Medians and 25th, 75th percentiles)
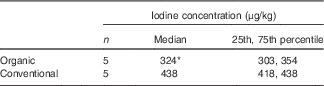
* Significantly lower than conventional milk (P=0·009; Mann–Whitney U test).
Effect of seaweed ingredient on iodine concentration
Two of the samples that were analysed – an almond drink and a hemp drink – contained a red seaweed, Lithothamnium calcareum, as a source of Ca. The iodine concentration of the hemp drink with Lithothamnium calcareum was considerably higher than that of the other hemp sample (36·3 v. 7·0 μg/kg), whereas the iodine content of the almond sample with added seaweed (18·0 μg/kg) was not vastly different from that of the other almond drinks (range<3·6 (i.e. the LOQ) – 17·6 μg/kg).
Discussion
The natural iodine content of milk-alternative drinks was found to be low, with more than a quarter of samples below the LOQ (<3·6 µg/kg). The median iodine concentration of all unfortified drinks was 2·1 % (range 1·2–6·3 for the seven matrices) of that of conventional cows’ milk (using the year-round value of 344 µg/kg). A portion (200 g) of the unfortified milk-alternative drinks would give from 0·9 to 4·3 μg of iodine which is a negligible proportion of the adult iodine intake recommendation of 150 μg/d( 30 , 31 ).
At the time of our study, just one brand – Marks & Spencer – fortified its products with iodine. The product label showed potassium iodide as an ingredient and iodine was included in the table of nutritional information. However, only three (soya, oat and rice) of the five matrices sold by Marks & Spencer were iodine -fortified (coconut and almond drinks were not fortified). The fortified products had a measured iodine concentration that was 77·3–83·4 % of that of year-round cows’ milk (344 μg/kg). A portion (200 g) of fortified soya, oat and rice drinks would provide 45·0, 57·8 and 61·4 μg of iodine – approximately 30–41 % of the adult iodine recommendation (150 μg/d( 30 , 31 )) and thus could be considered as a reasonable substitute for cows’ milk, in terms of iodine content.
To our knowledge this is the largest systematic study of milk-alternative drinks and the first to report on the iodine concentration of oat and hazelnut drinks. A recent study by Ma and Braverman in Boston, USA, analysed thirty-one milk-alternative drinks and, in support of our findings, found that the mean iodine concentration of the drinks (12·4 μg/l) was low in comparison with US cows’ milk (387 μg/l)( Reference Ma, He and Braverman 25 ). Ma and Braverman included drinks that were not available on the UK market at the time of our study (e.g. walnut and pistachio drinks) and had smaller numbers of rice, soya and hemp drinks than we did. They did not report the iodine concentration for each different matrix but by using the values provided in their paper, and assuming a density of 1 g/ml, the median iodine concentration was similar to our result for soya drinks (12·7 v. 11·6 μg/kg), slightly higher for almond drinks (8·4 v. 5·6 μg/kg) and slightly lower for coconut drinks (5·4 v. 8·4 μg/kg). Iodine concentration was measured in one sample of a rice drink (iodine concentration: 29 μg/l) and four samples of a soya drink (iodine concentration range: 15–27 μg/l) in Australia( Reference Crawford, Cowell and Emder 32 ); the iodine concentration values were slightly higher than ours but the sample size was very small. The iodine concentration given for soya drink in the McCance and Widdowson food tables (6th edition)( 11 ), at 10 μg/kg, is similar to our median value for soya.
The products of the major brands of the milk-alternative market (e.g. Alpro or Dream) are not fortified with iodine (these include soya, oat, almond, rice and hazelnut drinks). It is interesting to note that many milk alternatives, including those of the market leaders, often state on the label that they are enriched with Ca (and sometimes vitamin B12) to match the profile of cows’ milk but no attempt has been made to match the iodine content. Dietitians would likely recommend that patients who follow a milk-free diet use a milk-alternative product that is fortified with Ca but they are less likely to consider the necessity of replacing the missing iodine( Reference Meyer 21 , Reference Wright, Waddell and Reeves 33 – Reference Wright 35 ). Goats’ milk is sometimes used as an alternative to cows’ milk, although it is not a suitable substitute for those with cows’ milk protein allergy( Reference Meyer 21 ); the iodine concentration of goats’ milk is higher than that of cows’ milk( 10 ). Our results suggest that the majority of individuals who switch to milk-alternative drinks will not make up the missing iodine, as the iodine-fortified drinks are not available in popular supermarket chains. Indeed, we have previously found that iodine status (as assessed by 24 h iodine excretion) was lower in consumers of soya drinks in a group of UK women of childbearing age, reflecting the negative correlation between intake of soya drinks and cows’ milk( Reference Bath, Sleeth and McKenna 17 ). However, the number of women who consumed soya drinks was small (n 5) and therefore further research would be required to confirm those findings.
Some drinks used red seaweed, Lithothamnium calcareum, for Ca fortification but our results suggest that this had little effect on their iodine concentration (although our sample size was small). The manufacturer of the hemp drink confirmed that a seaweed extract, Aquamin F, was added to the drink at 0·35 % (Good Hemp, personal communication, July 2014). Aquamin is a multi-mineral ingredient produced from the red alga, species Lithothamnion ( 36 ) with a reported iodine concentration of<9( 37 ) to 32·8 mg/kg( Reference Aslam, Kreider and Paruchuri 38 ). Thus, at 0·35 %, the Aquamin would provide 31·5–114·8 µg/kg. Food Standards Australia New Zealand has analysed the iodine concentration of drinks fortified with seaweed products, including Aquamin, and found that samples of soya (n 6) and rice drinks (n 3) had a mean iodine concentration of 40 (range 10–100) and 50 (range 40–60) µg/kg, respectively( 39 ). Though this is considerably higher than the values we found for seaweed-fortified drinks, 40–50 µg iodine/kg is still considerably lower than the 266–280 µg/kg in iodine-fortified drinks or the 438 µg/kg in cows’ milk
It is important to point out that the iodine concentration of the red seaweed extract product, Aquamin F, is relatively low in comparison with that of the brown seaweed kombu (or kelp; family name Laminariaceae), which has an approximate iodine concentration of 2400 mg/kg( 10 ). Indeed, in December 2009, Food Standards Australia New Zealand recalled batches of soya drinks that had been fortified with kombu( 40 ) as the soya-drink product had an extremely high iodine concentration (25 000 µg/l)( Reference Crawford, Cowell and Emder 32 ) and had been associated with iodine excess and iodine-induced thyroid dysfunction( Reference Crawford, Cowell and Emder 32 ); the product was subsequently reformulated and returned to market in April 2010( 41 ). This experience has highlighted the need for manufacturers to give careful consideration to the source of iodine that they use if they wish to fortify their products with iodine.
Soyabeans are a known goitrogenic food as they contain isoflavones that can inhibit the thyroid peroxidase enzyme that is required for thyroid hormone synthesis( Reference Zimmermann 1 ). In iodine-replete individuals, soya intake has little effect on thyroid function( Reference Messina and Redmond 42 ). However, individuals who consume high quantities of soya drinks (and hence goitrogenic isoflavones) against the background of a low iodine intake (as may be the case in consumers of milk-alternative drinks), may theoretically be at risk of thyroid dysfunction; data are needed in this area.
Organic v. conventional milk
As in our previous work( Reference Bath, Button and Rayman 29 ), we found that samples of organically-produced milk had a lower iodine concentration than conventional milk. The percentage difference between organic and conventional milk in the current study, conducted in the winter months, was smaller than in our previous study (26 v. 42 %( Reference Bath, Button and Rayman 29 )), where samples were collected in the summer months( Reference Bath, Button and Rayman 29 ). Another UK study, conducted in the winter of 2014, found that organic milk was 32·2–35·5 % lower in iodine( Reference Payling, Juniper and Drake 43 ). These values might suggest that the difference between organic and conventional milk has reduced over time. Indeed, the Organic Milk Suppliers Co-operative (OMSCo), which represents 65 % of UK organic-milk producers, issued a press release in February 2016 that stated that the iodine concentration in organic milk was now comparable to that of conventional milk( 44 ). However, as that report is not published nor available to the public, it is not possible to review either the milk-sampling methodology or the accuracy of the iodine-concentration measurements. In fact, data from other studies also showed a smaller difference between mean iodine concentration in organic and conventional milk in the winter than in the summer( Reference Rasmussen, Larsen and Ovesen 45 , Reference Dahl, Opsahl and Meltzer 46 ), as do data from the UK Food Standards Agency 2008 study of iodine in milk( 10 ). We conclude that our finding of lower iodine in organic milk suggests that while it is a reasonable source of iodine, it still does not match the iodine content of conventional milk. This is likely to result from restrictions on mineral-fortified concentrates in organic farming, as well as a reliance on clover as a natural nitrogen-fixer (used in place of artificial fertilisers)( 47 ); certain strains of white clover contains goitrogens that may reduce the carry-over from feed to milk by blocking the iodine transporter in the mammary gland( Reference Bath and Rayman 48 ). If the organic sector is making changes that might affect milk-iodine content (as suggested by OMSCo( 44 )), future monitoring of milk-iodine concentration will be required.
Limitations
Our survey is cross-sectional in nature and therefore the results are limited to the current market; in future years manufacturers may become more iodine-aware and begin to fortify their milk-alternative products. A second limitation is the fact that our sampling was restricted to one time-point in the year (autumn/winter). Although we do not expect milk-alternative drinks to exhibit the same large seasonal variation that is seen in cows’ milk iodine concentration( Reference Phillips 6 , 10 ), it is possible that there is variability in the iodine concentration of milk-alternative drinks as a result of seasonal variation in the crops used for their manufacture (e.g. soyabeans). However, in view of the generally low iodine concentration in plants, any variation is likely to have minimal impact on iodine intake and status. Furthermore, as we included both chilled and long-life milk-alternative drinks, with a use-by date between 1 and 11 months from the purchase date, the manufacture of the drinks is unlikely to have been from the same time as the purchase month and may therefore include some seasonal variation. As our sampling of cows’ milk was limited to the winter months in the current study, we also compared the iodine concentration of milk-alternative drinks with that of summer milk from 2009( Reference Bath, Button and Rayman 29 ), as well as an all-seasons value calculated from the iodine concentration of both winter and summer milk. We did not collect information on the geographical source of the ingredients which may have affected their iodine concentration. However, as we sampled from twenty brands that are likely to use different sources for their ingredients, we may have captured some variation in iodine concentration relating to geographical location. As the iodine concentration of most drinks was very low, any variation is unlikely to change our conclusions. Finally, sample sizes were relatively small for some drinks (e.g. hazelnut and hemp) and we only sampled one drink for each product. It is for this reason that we have reported results as an average value and an average for each matrix rather than a value for each of the products that we analysed. We therefore recommend that future surveys of nutrients in food should include a wider variety of milk alternatives to provide values for the UK food table (currently, the only milk-alternative drink in the table is soya( 11 )).
In conclusion, unfortified milk alternatives have negligible iodine content and are not suitable substitutes for cows’ milk in terms of iodine provision. Individuals who consume these products need to ensure adequate iodine intake from alternative dietary sources, such as seafood and eggs. For those who cannot, or do not, consume these iodine-rich foods, use of an iodine-containing supplement (though not kelp or seaweed owing to risk of iodine excess( Reference Zimmermann and Delange 49 )) should be considered, particularly in women of child-bearing age. Other manufacturers could consider fortifying milk-alternative drinks with iodine in order to match the profile of cows’ milk, particularly as milk is the premier source of iodine in the UK diet.
Acknowledgements
The authors thank Dr Julie-Ann Lough from the BBC for assistance with the collection of samples for their programme, ‘The Truth about Healthy Eating’.
S. C. B. was in receipt of a Medical Research Council Population Health Scientist Fellowship at the time of the study (MR/K02132X/1). The BBC and the University of Surrey covered the costs of the study (e.g. the purchase of the samples). The funders had no role in the design, analysis or writing of this article.
S. C. B. and M. P. R. designed the study, C. J. N. surveyed the UK market for milk-alternative drinks in 2013–2014; S. C. B., S. E., and M. P. R. collected the samples from retail outlets; S. H. and H. G. I. were responsible for laboratory analysis. S. E. assisted with laboratory analysis. S. C. B. wrote the manuscript and all authors reviewed and approved the final version. M. P. R. had primary responsibility for final content.
S. C. B. has received lecture fees from the Dairy Council. M. P. R. was awarded a grant from Wassen International, which partly funded a PhD studentship for S. C. B. (2009–2012).
Supplementary material
For supplementary material/s referred to in this article, please visit https://doi.org/10.1017/S0007114517002136


Target article
Iodine concentration of milk-alternative drinks available in the UK in comparison with cows’ milk
Related commentaries (1)
Invited commentary in response to the paper entitled ‘Iodine concentration of milk-alternative drinks available in the UK in comparison with cows’ milk’ by Sarah Bath and colleagues