


Scottish Dietary Goals(1) (Targets) have been monitored since 2001(Reference Wrieden, Armstrong and Sherriff2) using secondary analysis of food purchase data. To date, the area based Scottish Index of Multiple Deprivation (SIMD) has been the socio-demographic variable used to determine any associations between diet and socioeconomic status. However little is known about the association between intakes of foods and nutrients and actual household income.
Household food purchase data from 2001 to 2012, for Scotland, from the UK Living Costs and Food Survey were analysed to estimate intakes of Scottish Dietary Goal foods and nutrients by Equivalised Income. Adjustments were made to allocate the correct proportion of each food to the appropriate food group (including to composite foods), for waste(Reference Wrieden, Armstrong and Sherriff2), and for weight increase or loss due to cooking or dilution. Data were analysed using general linear models within the complex samples module of SPSS (SPSS Inc., Chicago, IL, USA) weighting to the Scottish population and taking account of sampling methods. Results are presented as population means, with 95 % confidence intervals (95 % CI), (i.e. includes consumers and non-consumers) estimated from household and eating out food purchases.
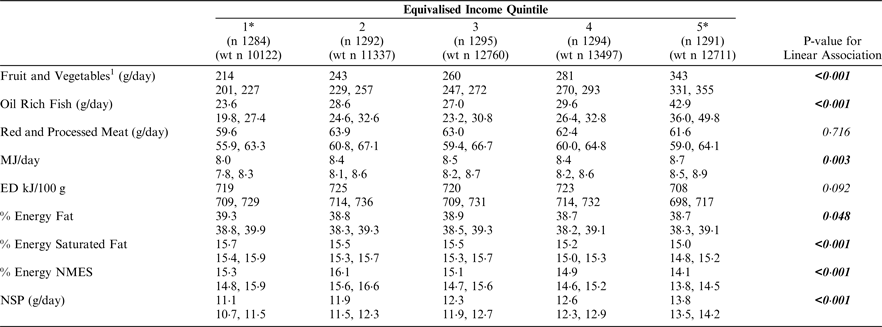
1 = Lowest Income; 5 = Highest Income; n = number of households and weighted (wt) n = weighted number of people in the sample.1Includes fruit and vegetables and baked beans.
Estimated intakes for the majority of foods and nutrients follow similar trends to those calculated by SIMD(Reference Barton, Wrieden and Sheriff4), particularly for fruit and vegetables, oil rich fish, added sugars (NMES) and fibre (NSP). However significant differences for energy, fat and saturated fat intakes have not been evident in analyses carried out by SIMD. Whilst using SIMD as a measure of socio-economic status allows for comparison with results for other studies, the income available for households to purchase foods does have to be considered and warrants further work to inform future policy to target diet and social inequalities.
Funded by Food Standards Scotland (FS424018). Data from DEFRA, SNS, ONS and the UK Data Archive.
