


In 1984, the UK Committee on Medical Aspects of Food Policy first recommended that no more than 30–35 and 10 % of dietary energy be derived from total and SFA respectively to prevent CVD and updated its advice to include the replacement of SFA with MUFA and to increase the intake of long-chain n-3 PUFA from oily fish in 1994( 1 ). More than 30 years later a meta-analysis of the clinical trials available at the time has concluded that these guidelines for dietary fat intake should never have been made( Reference Harcombe, Baker and Cooper 2 ). However, this fails to recognise that at the time the UK was experiencing a major epidemic of CHD and there was strong evidence that the intake of SFA increased serum cholesterol, which was causally involved in the atherogenic process that leads to CHD. Furthermore, reducing the intake of fat was seen to be a means of reducing SFA as leading sources of both SFA and total fat were meat and dairy products. Indeed, intakes of total fat and saturated fat and serum cholesterol have fallen in the UK as discussed elsewhere( Reference Sanders, Lewis and Goff 3 ). Furthermore, it is to be noted that CVD mortality has fallen by more than 55 % since 1997 in the UK( Reference Bajekal, Scholes and Love 4 ) for reasons that remain uncertain.
The lack of epidemiological evidence from a comprehensive meta-analysis of prospective cohort studies( Reference Chowdhury, Warnakula and Kunutsor 5 ) supporting the contention that SFA intake is associated with increased risk of death from CVD is in contrast to the findings based mainly on US data that the consumption of sugar-sweetened beverages (SSB)( Reference Fung, Malik and Rexrode 6 ) and refined carbohydrates with high glycaemic index is associated with a greater risk( Reference Jakobsen, Dethlefsen and Joensen 7 ). This has led some commentators to suggest that sugar is to blame for CVD rather than SFA( Reference Malhotra 8 ) and that it is time to end the war on fat. This has resulted in a rash of media articles suggesting that it is healthy to eat fatty meat and full-fat dairy products. However, a more recent meta-analysis including previously unpublished results from prospective cohort studies shows that individuals who select diets with a higher intake of linoleic acid and a lower intake of SFA are at lower risk of death from CHD( Reference Farvid, Ding and Pan 9 ). Further confusion is added by the divergent relationship of certain fatty foods such as red and processed meat which increase the risk of CVD. In contrast nuts, oily fish and dairy foods which are associated with a lower risk of CVD( Reference Mozaffarian, Appel and Van Horn 10 ). The adverse effects of trans fatty acids from partially hydrogenated vegetable oils have clouded the debate regarding the benefit of replacing butter with yellow-fat spreads with a lower SFA content. Furthermore, the lower risk of CVD is more strongly associated with oily fish consumption( Reference Nestel, Clifton and Colquhoun 11 ) than fish-oil supplements containing long-chain n-3 PUFA.
A note of caution, however, is needed with the interpretation of these data from prospective cohort studies because they show associations that may not be directly causal and may represent other characteristics that influence risk, including the overall dietary pattern. In most cases, intakes are based on a single dietary assessment at recruitment and make the assumption that neither individual dietary habits nor the composition of the food supply do not change in the intervening follow-up period, which will be discussed later; most used memory-based methods (most commonly a FFQ or a 24 h food recall and rarely 7-d food records). Memory-based dietary recall is subject to substantial bias particularly for food items seen to be good or bad with underreporting becoming more prevalent among those who are obese. FFQ also underestimate fat intake compared with weighed intakes( Reference Bingham, Luben and Welch 12 , Reference Brunner, Stallone and Juneja 13 ) and provide insufficient detail to accurately assess fatty acid intake particularly with regard to the intake of fats and oils used during food preparation or in commercial food processing. They are, however, more robust for the assessment of the intake of animal fat from sources such as meat and dairy products.
Is sugar the new tobacco?
The most recent guidance from WHO proposes 10 % energy as the maximum intake of ‘free sugars’; about 50 g/d and if possible intakes should be no more than 5 % energy( 14 ). Free sugars include monosaccharides and disaccharides added to foods and beverages by the manufacturer, cook or consumer, and sugars naturally present in honey, syrups, fruit juices and fruit juice concentrates and differs from the non-milk extrinsic sugars (NMES) in that they do not include 50 % of the sugars from stewed, dried or canned fruit. The UK Scientific Advisory Committee on Nutrition (SACN) report on Dietary Carbohydrates and Health( 15 ) recommended that no more than 5 % food energy be supplied from free sugars, while maintaining total carbohydrate intake from food at 50 % energy and advocating an intake of 30 g dietary fibre daily. The evidence base for this stringent limit on free sugars is based on the well-established relationship between the frequent consumption of sugar-containing foods and dental caries, particularly, in children rather that evidence relating to obesity prevention. After many years of improvements in dental health in part due to fluoridation and better dental hygiene, there has been a substantial increase in the number of children with dental caries. A recent report suggested that 27 % of 5-year olds have three to four teeth decayed, missing or filled. The risk of caries is much higher in low socioeconomic groups particularly migrants. One reason for the increase in caries may be the relatively high proportion of births (currently about 25 %) to parents born outside the UK where the practice of allowing toddlers to have trainer cups or dummies containing sugar drinks is not actively discouraged. Dental caries is caused by the fermentation of sugar by oral bacteria that accumulate as dental plaque to generate acid that erodes dental enamel. These cariogenic effects of sugar can be reduced by good oral hygiene to remove plaque, fluoride in drinking water (1 mg/l) or toothpaste, and minimising the number of sugar-containing eating occasions to no more than four times daily. Acidic sugar-containing drinks are even worse for dental health as they contribute to the erosion of dental enamel. The evidence for the 5 % free sugar target comes from data obtained more than 50 years ago and its relevance in the post-fluoride era is questionable.
Intakes of free sugars greater than 10 % energy are associated with a greater risk of obesity, especially in children. The relationship between sugar and obesity is shown with the consumption of SSB. However, under isoenergetic controlled conditions, added sugars, including SSB, are no more likely to cause weight gain than any other source of energy.
Several policy options are being considered and these include education to encourage consumption of water and other low-energy drinks (sugar swaps). Across the board reductions in added sugar in processed foods have been proposed. However, replacement of sugar with starch would have no effect on energy content and replacement with fat would increase energy density. Reformulation of fizzy drinks with intense sweeteners such as aspartame, asulfame K and sucralose has already been done but has had no effect on the inexorable rise in obesity. Indeed, people who are obese are more likely to buy diet drinks. Intense sweeteners are unable to fill the role in some food products because they lack the bulk and osmotic features of sugar. Moreover, there are limitations regarding the use of bulk sweeteners such as polyols to replace sugar because intakes greater than 20 g per serve cause gastrointestinal symptoms (bloating, osmotic diarrhoea). In the UK, the television advertising of foods of high salt, fat and sugar is prohibited in the day-time until the evening 21.00 hours watershed. However, these restrictions do not apply to print advertising or to sponsorship of sport such as football, tennis and athletics. It has been suggested that the marketing of sports drinks, which are high in sugar, is an unhealthy activity that promotes obesity. The more extreme critics( Reference Malhotra, Noakes and Phinney 16 ) even suggest that very low-carbohydrate diets are better for health and sport and that ‘you cannot outrun a bad diet’. Capewell refers to sugar as the new tobacco and the British Medical Association( Reference Torjesen 17 ) favours his suggestion of a tax on SSB and for the proceeds to be used to subsidise fruit and vegetable consumption. In the UK, SSB already attract 20 % value added tax and the proposal to increase prices by a further 20 % would add 44 % tax on the retail price of soft drinks as value added tax is calculated on the price at which the drink is sold. This could be regarded as another tax on the poor proposed by the rich, as it is the lowest income group that is the major consumer of SSB. It is uncertain what impact such taxation would have on consumption. One study( Reference Ng, Ni Mhurchu and Jebb 18 ) suggests that a 10 % increase in the price of SSB might reduce intake by 7·5 ml/head per d, i.e. <1 g sugar, which is unlikely to have any effect on weight or dental health. The proposal that revenue raised from a sugar tax could be used to subsidise healthy food is unlikely to be realised based on past policy. For example, taxation on tobacco is not earmarked to pay for the health care costs that smokers inflict upon themselves. A sugar beverage tax, besides being unpopular, might also have the unintended consequence of increasing alcohol intake if the price differential between soft drinks and alcohol is eroded. A more effective measure to reduce sugar intake might be to prohibit discounting by retailers and ‘buy one get one free’ offers for confectionery and SSB.
Changes in the UK food supply
There is good evidence to show that the intake of SFA from meat (especially lamb and beef), and the contribution from butter and margarine have fallen over time in the UK. This is well illustrated by records from the National Food Survey( 19 ). With regard to the milk intake, the consumption of milk has fallen but the proportion of skimmed milk consumed has increased. However, the fat from the skimmed milk has re-entered the food chain elsewhere. This in part explains the relatively higher contribution of saturated fat from bakery products (cake, biscuits and croissants) and compound foods such as puddings. The most marked change in fat consumption has been the increased use of vegetable oils both in domestic and industrial settings. The use of animal fats (especially beef tallow and lard) and partially hydrogenated fats with unhydrogenated vegetable oil (since about 1996 in the UK) has declined markedly. Rapeseed and sunflower seed oils are the major oils used in the UK and where higher melting point fats are required in the formulation of a food (e.g. bakery fats, margarine and ice-cream) blends containing palm oil or coconut oil are used. North America differs from Europe in that it is a major producer of soyabean oil, much of which is GM varieties, which although allowed by law in the EU are hardly used because of consumer resistance to GM crops. Global vegetable oil production has increased markedly over the past decade but only provides 173 million metric tonnes/year (about 6·5 × 1012 MJ/year) v. cereals that provide 2721 million metric tonnes/year (about 40·5 × 1012 MJ/year). The largest areas of growth are in palm oil production in South East Asia and soyabean oil in the both North and South America.
Intakes of free sugars have probably changed little over the past 50 years in the UK. The National Food Survey shows per capita purchases of packet sugar and sugar from jam were 53 and 8 g/d, respectively, in 1974; by 1998 these had fallen to 17 and 4 g/d. Some of the packet sugar was used for home baking but much was added to tea. Household tea purchases slumped in line with packet sugar according to Family Food Survey 2012( 20 ). However, this decline in packet sugar has been accompanied by increased purchases of ready prepared food and drinks containing sugar (both SSB and fruit juice). The National Diet and Nutrition Survey 2008–2012( 21 ) estimates average adult intakes of NMES to be 58·4 g/d and total sugar to be 98·5 g/d. These intakes are about 20 g lower than reported in the earlier National Diet and Nutrition Survey 2001, which used 7-d weighed intakes as opposed to 4-d food records. The major sources of free sugars in 2008–2012 National Diet and Nutrition Survey were non-alcoholic beverages (including fruit juice) 25 g/d, jam and table sugar 17 g/d, cakes and biscuits 13 g/d, alcoholic beverages 10 g/d, cakes and biscuits 13 g/d, and confectionery 9 g/d. Although, sugar was rationed in the war-time period and up until 1953, confectionery purchases increased to levels in the 1960s that were probably greater than now but SSB (other than sweetened tea) were not widely consumed. The Family Food Survey 2012 indicates average per capita purchases of SSB and confectionery as being 126 ml/d and 17 g/d, respectively. However, these are probably underestimates.
The current proportions of dietary energy from protein, alcohol and PUFA are higher and those from total fat (35 v. 42 %) and SFA are lower (12 v. 20 %), but there is little evidence to suggest any change in the proportion of energy derived from sugar when comparisons are made with data from the National Food Survey. Average adult intakes of NMES are 12 % energy according to National Diet and Nutrition Survey 2008–2012 but much higher, about 15 %, in adolescents reflecting their higher intake of SSB and confectionery. Completely avoiding SSB and confectionery would be estimated to decrease NMES intake by 34 g/d which, if not replaced by other items containing sugar, would reduce average NMES intakes to 24 g/d. The newer term free sugar that is used by WHO and SACN makes the calculation of intake easier, but free sugars are not listed in food tables. From an analytical standpoint it is currently not possible to make a distinction between free sugars and intrinsic sugars as food labels, according to the current European Commission Regulation 1169/2011, only requires a declaration of total sugar content. These vagaries regarding the difference between free sugar and other sugar in food are likely to continue to cause confusion. However, advice to replace sugar-sweetened drinks with water or other beverages that do not contain sugar and to avoid confectionery except on special occasions might be sufficient to achieve the target proposed by SACN.
Dietary fat intake and obesity
It is well known in animal nutrition that increasing the proportion of energy from fat increases the energy density of the diet and adipose tissue deposition. In human subjects, fat intakes are relatively high even at 25–35 % energy and rates of de novo lipogenesis of fat from carbohydrate are low in man( Reference McDevitt, Bott and Harding 22 ). This means that most body fat that accumulates is derived from dietary fat rather than being synthesised from carbohydrates. This is supported by the observation that the proportion of PUFA and other fatty acids that cannot be synthesised in the body is strongly correlated with the proportions found in adipose tissue. However, there is a significant amount of remodelling of SFA from the diet and from de novo synthesis in the body. Typically, palmitic acid accounts for about 25–30 % of the fatty acids in adipose tissue and MUFA, mainly oleic acid but also significant amounts of palmitoleic acid, accounts for over 50 % of the fatty acids in adipose tissue. Thus, an excess energy intake will generally result in the preferential oxidation of carbohydrate over fat and the retention of dietary fat in adipose tissue, but insulin released in response to carbohydrate intake will help promote fat storage.
Meta-analysis of trials of dietary advice to reduce fat intake in adults show weight losses of 0·51 kg/m2 in the longer-term studies( Reference Hooper, Abdelhamid and Moore 23 ). The Women's Health Initiative Study( Reference Howard, Manson and Stefanick 24 ) showed that 19 541 women allocated to a low-fat diet lost on average 2·2 kg weight in the first year compared with the 29 294 women in the control group but after 7·5 years the difference between intervention and control groups was only 0·4 kg. Importantly, there was no tendency towards weight gain in the intervention group and weight loss was greatest among women in either group who decreased their percentage of energy from fat.
Dietary fat typically provides about one-third of the energy intake in most economically developed countries( Reference Harika, Eilander and Alssema 25 ). Although only 1–2 % of the energy is required to provide the essential fatty acids, about 10–15 % energy from fat is about as low as it is possible to formulate diets with foods that people eat. Such low intakes restrict energy intakes because they increase the bulk of food needed to meet energy requirements (Fig. 1). This can be a particular problem with children under age 5 years where energy requirements are high. For this reason, WHO/FAO( 26 ) advised that a concerted effort is needed to raise fat intakes to at least 20–25 % energy. The evidence base for setting the upper limit of fat intake to 35 % is lacking and there are populations, for example Greece, where intakes are as high as 46 % energy from fat, mainly from MUFA. There is also evidence to show that dietary advice where SFA are replaced by MUFA results in a more favourable change in the total cholesterol : HDL cholesterol ratio than a reduced fat diet with a high carbohydrate intake( Reference Jebb, Lovegrove and Griffin 27 ) and does not impair insulin resistance. Similarly, there is no convincing evidence base for recommending 50 % of dietary energy should be derived from carbohydrate as recommended by SACN. This recommendation would suggest an increased carbohydrate intake from starchy foods in the UK. However, many starchy foods, even those high in fibre, have a high glycaemic index. In contrast, the US dietary guidelines specify an average macronutrient dietary range of 45–65 % of the energy intake. However, a cogent case can be made for specifying a higher proportion of energy (about 40 %) derived from healthy fats( Reference Mozaffarian and Ludwig 28 ) and a correspondingly lower proportion of energy from carbohydrate (about 40 % energy) especially if energy intake is restricted.
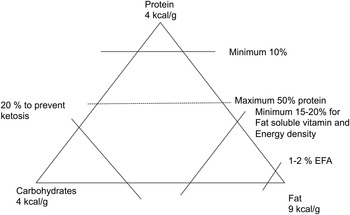
Fig. 1. Limits on the intakes of fat, protein and carbohydrates as sources of energy. EFA, essential fatty acids.
Consequently, most of the energy intake is derived from carbohydrate diets and this is why restricting energy intake from carbohydrates in addition to fat is required to prevent obesity. Reducing the intake of carbohydrate-rich foods in turn increases the proportion of energy derived from protein and fat without affecting their absolute intakes. Very low-carbohydrate diets (20–40 g/d) have been advocated by some including proponents of a Paleolithic diet. These diets induce ketosis and a metabolic acidosis and are extreme diets almost devoid of dietary fibre. High protein, low-carbohydrate diets are also globally unsustainable as the main sources of food energy are derived from cereal crops. Maize is the largest cereal crop and much of this is used to produce animal feed, starch and some to produce high fructose maize-syrup, particularly in the USA. Rice is almost entirely used for direct human consumption, whereas wheat and barley are used both for direct human consumption and for animal feed. Sugar cane and beet only provide a small fraction (172 million metric tonnes/year) of the global carbohydrate foods.
Energy reduction through restriction of carbohydrate intake v. fat intake results in similar falls in body weight( Reference de Souza, Bray and Carey 29 ). However, advice to restrict carbohydrate intake may be more effective than focusing solely on fat in practice because some of the carbohydrate-rich foods are easier to identify and many carbohydrate-rich foods contain fat (i.e. cakes, biscuits and crisps) and others are consumed with fat (e.g. bread and butter).
Fat, sugar and type 2 diabetes
The UK is experiencing an unprecedented increase in obesity-related hospital admissions which are mainly type 2 diabetes. Obesity, physical inactivity and increasing age are the major risk factors for developing type 2 diabetes. In the 1970s, the prevalence of obesity was about 6 % in women and 4 % in men; nowadays the prevalence is 26 and 24 %, respectively. The relative risks are increased 4–12-fold by being overweight or obese. Regular physical activity approximately halves the risk. As the prevalence of obesity has increased in the USA the incidence of type 2 diabetes has increased as predicted but mainly in those over age 50 years. A meta-analysis of prospective cohort studies looking at individual dietary components and risk of type 2 diabetes shows an increased relative risk of about 0·2–0·3 for high consumers of SSB( Reference Ley, Hamdy and Mohan 30 ) as well as for high consumers of white rice, processed meat and red meat and correspondingly lower risk associated with dairy products, green leafy vegetables, wholegrains, coffee and alcohol. Further analysis of soft drink consumption, which are adjusted for initial BMI, found a 0·13 increase in risk for each serving of SSB and a 0·08 increase for each serving of artificially sweetened beverage. However, the early stages of developing type 2 diabetes are characterised by increased fluid consumption. This might explain part of the association particularly that with artificially sweetened drinks. It is also well known that people who are obese are more likely to use artificial sweeteners and drinks containing them. The current epidemic of type 2 diabetes is mainly affecting the over 50-year-old age groups who are not the major consumers of SSB. However, the high consumption of SSB and increasing prevalence of obesity in younger adults suggests that SSB will contribute to type 2 diabetes in the future.
Current dietary guidelines
Foods consist of mixtures of macronutrients. Generally animal products are devoid of carbohydrates and contain variable amounts of fat, whereas most plant foods, with the exception of nuts and oil seeds, are low in fat and high in carbohydrates. Cereals, legumes and potatoes can make important contributions to protein intake whereas the contribution of refined starch, sugar and fat to intakes of other macronutrients is negligible. Dietary guidelines have been shifting away from numerical targets for macronutrients towards advocating a change in dietary pattern. There is good evidence that a Mediterranean dietary pattern( Reference Estruch, Ros and Salas-Salvado 31 ) characterised by high intakes of olive oil, plenty of vegetables, legumes and nuts and only small amounts of red meat, and the vegetarian dietary pattern, characterised by high intakes of wholegrain cereals, dairy products, fruit, nuts and vegetables have favourable effects on CVD. Dietary guidelines for CVD prevention are broadly similar in the UK, Western Europe and USA and focus in modifying the overall dietary pattern, so that food and nutrient targets are met. The nutrient targets for reduced salt, added sugar, saturated and trans fatty acid intakes, increased intakes of potassium and fibre have been translated to food-based guidelines: these include replacement of fats rich in SFA with unsaturated fatty acids (mainly MUFA), the selection of low-fat dairy products, wholegrain cereals, an increased consumption of fruit, vegetables and fish, the avoidance of fatty meat, meat products, salt and added sugar. However, few (probably <5 %) of the population follow the guidelines. The Dietary Approaches to Stop Hypertension( Reference Sacks, Svetkey and Vollmer 32 ) and Optimal Macronutrient Intake Trial to Prevent Heart Disease( Reference Appel, Sacks and Carey 33 ) in the USA showed that global changes in diet were more effective than focusing on individual components in lowering risk of CVD but were conducted in participants at above average risk. The Cardiovascular Risk Reduction Study: Supported by an Integrated Dietary Approach( Reference Reidlinger, Darzi and Hall 34 ) was a randomised controlled trial designed to compare the impact of complying with UK dietary guidelines in healthy non-smoking men and women (aged 40–70 years) at average risk of CVD compared with a traditional British diet. A strength of the study is that it used biomarkers to confirm compliance with the dietary intervention, including urinary sucrose and fructose excretion and both diets were nutritionally balanced. Most of the participants were able to meet the targets for saturated and trans fatty acid reductions (96 %), increased oily fish (80 %), increased wholegrains (80 %), fruit and vegetables (82 %) and NMES (85 %) and salt (66 %). Mean intakes of NMES were 7·3 % energy but if the contribution made by dried, tinned and stewed fruit is subtracted to give the intake of free sugars it is close to the 5 % energy target proposed by SACN (TAB Sanders, unpublished results). However, the reduction in NMES did not reduce total sugar intake as this was increased by the contribution from fruit. Compared with the control diet, the dietary guidelines diet reduced the risk factors for CVD (blood pressure, blood fats, arterial stiffness and indices of inflammation) that would be predicted to reduce risk of CVD by 30 %. These effects could mainly be attributed to changes in fat composition, salt intake and modest contribution from weight loss. Although dietary guidelines diet was well received by participants and no more expensive, it may be a greater challenge to bring about change in groups who are less health conscious.
Conclusion
The recommendation that SFA and trans fatty acids provide no more than 10 and 1 % energy from trans fatty acids appears well supported by the scientific evidence. Unrefined carbohydrate intake is to be preferred because of the contribution to fibre and the associated micronutrient intake. SSB are related to weight gain and the frequent consumption of sugar-containing foods promotes dental caries. However, restricting the intake of added sugar and advocating increased fruit and vegetable consumption does not alter total sugar intake. There is a lack of evidence supporting the upper limit of 35 % for total fat intake (42 % energy from fat might be acceptable) or for specifying that carbohydrate intake should be at least 50 % energy. It would seem sensible for protein intake to supply 10–20 % energy with the higher proportion being applied when energy intakes are low. Finally, there probably needs to be more flexibility in the specifying proportions of energy provided by healthier fats (e.g. unhydrogenated MUFA and PUFA) and carbohydrates rather than assuming one size fits all.
Acknowledgements
The author is grateful to Dr Dianne Reidlinger, Dr Julia Darzi and Dr Wendy Hall and the CRESSIDA trial team.
Financial support
The Cardiovascular Risk Reduction Study (CRESSIDA) was supported by a project grant to the author by Public Health England. The author is retired and received no financial support for writing this article.
Conflicts of interest
The author is a member of the Programme Advisory Board of the Malaysian Palm Oil Board. He has received consultancy payments from Heinz Foods Ltd, Unilever PLC, the Global Dairy Platform and Archer Daniel Midland Company. He is a scientific governor of the British Nutrition Foundation and honorary Director of Nutrition for the charity HEART UK.
Authorship
The views and opinions expressed in this article are those of the author.

