The Responsibility Deal agreements have led to salt reduction (15 % from 2001 to 2011) in the UK food supply (1). Nutrient profiling could be used to set nutrient standards and targets with food reformulation as a goal. Yet, there is limited research focusing on the potential impact of applying nutrient profiling systems for reformulation. Here, we estimate the potential of a category-specific nutrient profiling system, used as voluntary reformulation standards, to improve the energy and nutrient content of the current UK food supply. The McCance & Widdowson nutrient composition database was used to identify foods commonly consumed in the UK (2).
Foods and beverages were assessed against the Nestle Nutritional Profiling System nutrient targets (NNPS) (Reference Vlassopoulos3). Serving sizes were fixed using US reference amounts customarily consumed (RACC). Products meeting all category-specific nutrient criteria were classified NNPS “Pass”. To estimate the potential impact of the system's application on the food supply, nutrient values were set, for all nutrients failing the NNPS targets, to the NNPS targets. Average nutrient compositions per category were compared with the original averages. All analyses included NNPS food categories with at least n = 20 products.
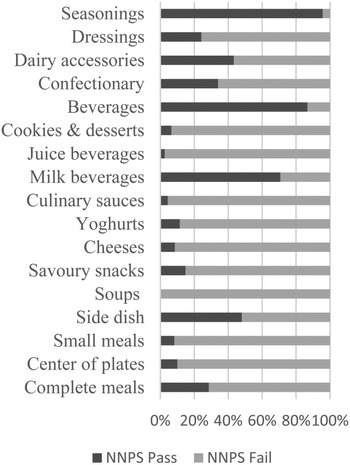
A total of n = 1443 food products were analysed. The overall ‘Pass’ rate was 25 % (356 products), with rates ranging from 0 to 96 % between categories (Fig 1). Of the products which failed, this was principally due to added sugars (87 %) or total fat (51 %) content. Replacing nutrient values exceeding thresholds in failing products with standard values led to changes of up to 25 % in average nutrient composition of each category (Fig 2). The food categories with the highest potential for improvement (based on nutrient data) were soups, juice based beverages and cookies & desserts.

Fig. 1. Proportion of NNPS Pass

Fig. 2. Average changes after reformulation
The use of nutrient profiling systems for product reformulation has the potential to drive an improvement in energy and nutrient composition of products, in turn benefitting public health. The global applicability of such systems requires to be thoroughly tested (different models, different datasets) and its potential impact on populations’ diets evaluated.