


Inflammation is integrally involved in the initiation and progression of chronic diseases such as CVD and type 2 diabetes mellitus( Reference Libby, Ridker and Maseri 1 ). Concentrations of circulating inflammatory biomarkers have been shown to be predictive of the development of these conditions in prospective and longitudinal studies( Reference Ridker, Hennekens and Buring 2 – Reference Kip, Marroquin and Shaw 5 ). The role of systemic biomarkers in appropriate prevention interventions is not yet well defined( Reference Mosca, Benjamin and Berra 6 ).
Traditional CVD risk factors include tobacco use, hypertension, dyslipidaemia, diabetes, overweight and obesity, and physical inactivity( Reference Libby, Ridker and Maseri 1 ). Dietary modification is considered a further important strategy to influence inflammatory processes and reduce CVD risk. Given the complexity of dietary habits in free-living individuals, the examination of the combinations of foods as described by dietary patterns has increasingly been employed to investigate diet–disease relationships( Reference Appel, Moore and Obarzanek 7 , Reference Howard, Van Horn and Hsia 8 ). Dietary patterns can be generated using a priori knowledge or empirically( Reference Macdonald and Hardcastle 9 , Reference Newby and Tucker 10 ). Such methods appear to consistently derive similar dietary patterns reflective of differences in diets that are nutrient poor and nutrient rich.
In large-scale cross-sectional studies, dietary patterns characterised by high intakes of fresh and dried fruit, vegetables, whole grains, insoluble fibre, and lean protein have been favourably associated with the biomarkers of inflammation( Reference Panagiotakos, Pitsavos and Stefanadis 11 – Reference Nettleton, Schulze and Jiang 18 ), serum lipid profile( Reference Fung, Rimm and Spiegelman 14 , Reference Nettleton, Schulze and Jiang 18 , Reference Newby, Muller and Tucker 19 ), intima–media thickness( Reference Nettleton, Schulze and Jiang 18 , Reference Millen, Quatromoni and Nam 20 – Reference Nettleton, Steffen and Schulze 22 ) and insulin sensitivity( Reference Fung, Rimm and Spiegelman 14 , Reference Mizoue, Yamaji and Tabata 23 , Reference Villegas, Salim and Flynn 24 ), independently of population demographics. In contrast, nutrient poor dietary patterns characterised by high intakes of refined grains, sweetened beverages, processed meats and added fats have been unfavourably associated with surrogate markers of disease risk( Reference Esmaillzadeh, Kimiagar and Mehrabi 12 – Reference Fung, Rimm and Spiegelman 14 , Reference Nettleton, Steffen and Mayer-Davis 17 , Reference Newby, Muller and Tucker 19 , Reference Millen, Quatromoni and Nam 20 , Reference Nettleton, Steffen and Schulze 22 , Reference Mizoue, Yamaji and Tabata 23 ). These associations have been confirmed in longitudinal and prospective investigations of dietary patterns in relation to incident CVD events( Reference Nettleton, Polak and Tracy 25 , Reference Horn, Tian and Neuhouser 26 ).
Factors responsible for the apparent protective role of nutrient-dense dietary patterns may include bioactive compounds found in fruits and vegetables (such as carotenoids and antioxidant vitamins)( Reference Wagner and Elmadfa 27 ). There have been no studies to date, as far as we are aware, relating dietary patterns to surrogate markers of disease risk, which have also focused on potential biomarkers of fruit and vegetable intake and serum antioxidant activity.
By employing data from a 10-year longitudinal study, we aimed to investigate the relationship between empirically derived dietary patterns (past and contemporary) and biomarkers (serum carotenoid and tocopherol concentrations) on chronic low-grade systemic inflammation (CLSI) in a large cohort of Scottish postmenopausal women.
Experimental methods
Study design and participant recruitment
Participants were postmenopausal women from the Aberdeen Prospective Osteoporosis Screening Study (APOSS) cohort selected randomly from Community Health Index records (a register of all patients in Scotland's publicly funded healthcare system) in which 5119 women had attended a baseline visit in 1990–3( Reference Barr, Macdonald and Stewart 28 ). Diet was assessed in 3237 participants by FFQ during 1997–2000, at a visit attended by a total of 3884 women. Volunteers (n 2130, mean age 66 (sd 2·2) years) returned again to the Clinical Research Facility, University of Aberdeen, UK between May 2007 and December 2011, although not all participants provided a blood sample or were prepared to complete an FFQ (Fig. 1). In the present study, we used the data from the dietary assessment in 1997–2000 (‘past’ diet) to predict the markers of CLSI in 2007–11, and examined cross-sectional associations between dietary data collected in 2007–11 (‘contemporary’ diet), serum markers measured in 2007–11 and CLSI. The study was conducted according to the guidelines laid down in the Declaration of Helsinki, and all procedures involving human subjects were approved by the East of Scotland Research Ethics Service. Written informed consent was obtained from all participants.
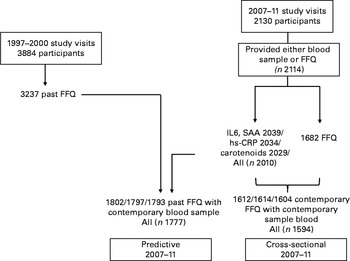
Fig. 1 Number of women attending the visits, completing the FFQ and providing the blood samples for analysis. SAA, serum amyloid A; hs-CRP, high-sensitivity C-reactive protein.
Anthropometric and blood pressure measurements
Participants were weighed on balance scales (Seca), height was measured using a stadiometer (Holtain Limited), and waist circumference was measured in a subset of participants (n 1403) at the midpoint between the lower rib margin and the iliac crest. Blood pressure was measured with an Omron 705CP sphygmomanometer (Omron) in a subset of participants (n 1409) in the supine position. The mean of two or three readings was taken as the outcome.
Biochemical analyses
Fasted (12 h overnight or 4 h for afternoon study visits) blood samples were collected and serum was prepared for storage (at − 80°C for contemporary samples and − 20°C for samples collected during 1997–2000) before analysis in a single batch. Routine biochemical analyses were conducted at the Department of Clinical Biochemistry, Aberdeen Royal Infirmary, Aberdeen, UK. Carotenoid and tocopherol analyses were conducted at the Rowett Institute of Nutrition and Health, University of Aberdeen, UK.
Analysis of lipids and inflammatory biomarkers
Total, HDL, APOA-1 and APOB100 cholesterol, TAG and high-sensitivity C-reactive protein (hs-CRP) concentrations were analysed by automated assay (ADVIA 2400 Chemistry System; Siemens). LDL-cholesterol was calculated using the Friedewald formula. IL-6, serum amyloid A (SAA) and E-selectin concentrations were determined using quantitative sandwich enzyme immunoassay kits (R&D Systems). Inter- and intra-assay CV were less than 5 % for the lipid and inflammatory biomarker assays.
Analysis of carotenoid and tocopherol concentrations
Serum concentrations of carotenoids (α- and β-carotene, β-cryptoxanthin, lutein/zeaxanthin and lycopene) were determined for the 2007–11 study visits only following isohexane and chloroform extraction by reversed-phase HPLC using fluorescence and visible detection( Reference Duthie 29 ). Concentrations of α-tocopherol, γ-tocopherol and retinol were also measured simultaneously using this method. Analyses were conducted under the round-robin scheme of the National Institute of Standards ‘Micronutrients Measurement Quality Assurance Programme’.
Assessment of diet, physical activity level and other covariates
Dietary intake (past and contemporary) was assessed with a semi-quantitative FFQ, comprising 136 questions( Reference Macdonald, New and Reid 30 ), which was validated using 7 d weighed records( Reference New 31 ). Alcohol intake for both visits was calculated using the UK Composition of Foods version 5( Reference Holland, Welch and Unwin 32 ). Physical activity levels (PAL) were obtained using the same questionnaire as that used in the Scottish Heart Health Study( Reference Tunstall-Pedoe, Smith and Crombie 33 ). Information was collected on smoking status. National deprivation category was assessed from postcode in 1997–2000, with the lowest number meaning the least deprived (most affluent)( Reference McLoone 34 ).
Statistical analyses
Power calculations (90 % power and 5 % significance level) for the detection of differences in inflammatory biomarker concentrations between the lowest and highest quintiles of dietary pattern were based on the study of Nettleton et al. ( Reference Nettleton, Schulze and Jiang 18 ). To detect a clinically meaningful difference in the serum concentrations of hs-CRP (0·5 mg/l), IL-6 (0·5 pg/ml), SAA (0·5 mg/l) and E-selectin (4·1 ng/l) would, respectively, require 2425, 1520, 2230 and 1645 participants in total.
Using SPSS for Windows software (version 20.0; SPSS, Inc.), non-normally distributed data were transformed for analysis. Food intakes were adjusted for total energy intake using the residuals method( Reference Willett, Howe and Kushi 35 ). Principal components analysis (PCA) was used to derive dietary patterns for each of the thirty-seven investigator-driven grouped food variables using previously described methodology( Reference Hardcastle, Aucott and Fraser 36 ), with the components of the PCA being equivalent to dietary patterns that are independent of one another (see online supplementary Table S1). ANOVA was used to test the relationship between the quintiles of dietary pattern scores (past and contemporary) and inflammatory biomarker concentrations, and ANCOVA was used to control for lifestyle covariates (see the footnotes of Tables 2 and 3). Serum carotenoid concentrations were similarly analysed by PCA by including all the serum carotenoid variables (α-carotene, β-carotene, β-cryptoxanthin, lutein/zeaxanthin and lycopene) and obtaining a principal component that accounted for the greatest variation in these serum markers. The relationship between the quintiles of serum carotenoid component score and inflammatory biomarker concentrations was examined using ANOVA/ANCOVA (see the footnote of Table 4). Significance threshold in the present analysis was adjusted to 0·013 to account for multiple testing of inflammatory biomarkers.
The associations between past and contemporary dietary patterns and contemporary carotenoid component scores (generated from PCA) and serum hs-CRP concentrations were examined using multiple linear regression (to determine effect sizes). Age, body weight, smoking status, PAL, national deprivation category, and serum concentrations of total, HDL, LDL, APO-A1 and APOB100 cholesterol, and TAG were entered as independent predictor variables in a stepwise manner.
Data missing were assumed to be missing completely at random as the initial analysis found no or negligible differences in characteristics (age, weight and physical activity) between participants with complete data and those with missing data.
Results
A total of 2130 participants attended the 2007–11 study visits; of these, 2114 provided a blood sample for the analysis of inflammatory biomarkers or completed dietary FFQ (n 2039 for markers; n 1682 for FFQ). Past dietary data (from the 1997–2000 study visits) were available for 3237 participants, 1797 of whom had inflammatory biomarker concentrations measured during the 2007–11 study visits (Fig. 1). Table 1 shows the characteristics of the present study cohort, including the sample of women restricted to inflammatory marker outcome (in 2007–11) and dietary assessment at each visit. In addition, we show the small differences in some characteristics between returners and non-returners (see online supplementary Table S2). The respective measurements for mean age were 54·6 and 54·9 years, for height 160·7 and 160·1 cm, and for weight 68·3 and 69·1 kg, indicating that returners were marginally younger, taller and lighter than non-returners. The differences were significant for age and height, but not for weight, and the latter were of debatable clinical significance. There were also significant differences between returners and non-returners for serum TAG (1·51 v. 1·61 mmol/l) and hs-CRP (2·8 v. 3·3 mg/l) concentrations, but not for the concentrations of other blood lipids, and there were fewer smokers in the returning group (15 v. 22 %). There were no differences between the participants who completed the FFQ and those who did not at the return visit.
Table 1 Characteristics of the study participants (Mean values and standard deviations; medians and interquartile ranges (IQR))

PAL, physical activity level.
* Estimated from FFQ.
† Serum measurements.
‡ Based on postcode classification where ‘I’ represents the most affluent and ‘VI’ represents the most deprived.
§ Waist circumference and blood pressure were measured in a subset at this visit only. Mean blood pressure was the same for subjects with the outcome only (n 1409) and with the FFQ (n 1078): systolic 143 (sd 80) mm Hg; diastolic 88 (sd 10) mm Hg. Waist circumference was 88·1 (sd 12·2) cm for the outcome only (n 1403) and 87·9 (sd 12·1) cm with the FFQ (n 1074).
PCA identified five dietary patterns accounting for 25·6 % of the variation in the diet in 1997–2001, of which two (‘prudent’ and ‘processed foods’) explained 12·6 % of the total variance in dietary intake (see online supplementary Table S1). A further minor dietary component characterised by non-oily fish, high fat/oil and bread intake explained 4·3 % of the total variance in dietary intake. Moreover, PCA identified four major contemporary dietary patterns that explained 23·3 % of the total variance in dietary intake (see online supplementary Table S1). The first contemporary diet component, a ‘prudent’ dietary pattern, showed positive loading scores for white and oily fish, fruit, vegetables, yogurt and cream, pulses, rice and pasta, and wine. The second component was a dietary pattern characterised by high loading scores for meats, potatoes, fruit juice and soft drinks. The third component was characterised by high intakes of cakes and confectionery with negative loadings for bread and fats/oils. The first two components explained 14·8 % of the total variance in diet, and the third component explained 5·7 %, making a total of 20·5 % of the total variance in diet for the first three components.
A ‘prudent’ dietary pattern in 1997–2001 predicted the biomarkers of inflammation 10 years later (Table 2), with hs-CRP concentration decreasing across the increasing quintiles of the ‘prudent’ dietary pattern (P= 0·002; ANCOVA). The reduction in IL-6 concentration across the quintiles of the ‘prudent’ dietary pattern did not meet the significance threshold (P< 0·013) for multiple testing (P= 0·014; ANCOVA), but was significant following adjustment for baseline weight, age and PAL (P= 0·001; ANCOVA). The past ‘processed foods’ dietary pattern was not associated with systemic inflammatory markers, and there were weak associations for the third minor dietary component for CRP and SAA only, which did not meet the significance threshold for multiple testing (P= 0·025 and P= 0·027, respectively; ANCOVA).
Table 2 Serum concentrations of inflammatory biomarkers (2007–11) across the quintiles (Q) of past dietary patterns (diet assessed 10 years before the measurement of inflammatory biomarkers) (Median values and interquartile ranges (IQR))

hs-CRP, high-sensitivity C-reactive protein; SAA, serum amyloid A.
* Based on ANOVA with inflammatory marker as the dependent variable (transformed using natural logarithm) and dietary pattern quintile as the fixed factor (unadjusted).
† Based on ANCOVA with adjustment for age, body weight, and physical activity level assessed at the 1997–2000 study visits (n 1797 for hsCRP, n 1802 for IL-6, SAA and E-selectin).
Table 3 shows serum biomarker concentrations across the quintiles of contemporary dietary pattern data: hs-CRP and IL-6 concentrations decreased with increasing quintiles of the ‘prudent’ dietary pattern (P= 0·030 and P= 0·006, respectively; ANCOVA-adjusted). Serum hs-CRP, IL6 and SAA concentrations increased with increasing quintiles of the ‘meat-dominated’ dietary pattern (P= 0·001, P= 0·005 and P= 0·022, respectively; ANCOVA adjusted), with the same trend for SAA (P= 0·022; ANCOVA adjusted). There were no differences in median concentrations of any of the inflammatory biomarkers across the quintiles of the third or fourth dietary component (data not shown).
Table 3 Serum concentrations of inflammatory biomarkers (2007–11) across the quintiles (Q) of contemporary dietary patterns (diet assessed at the same time as inflammatory biomarkers) (Median values and interquartile ranges (IQR))

hs-CRP, high-sensitivity C-reactive protein; SAA, serum amyloid A.
* Based on ANOVA with inflammatory marker as the dependent variable (transformed using natural logarithm) and dietary pattern quintile as the fixed factor (unadjusted).
† Based on ANCOVA with adjustment for age, body weight and physical activity level (for dietary patterns n 1608 for hsCRP, n 1604 for IL-6, SAA and E-selectin and for serum carotenoid n 1588 for hsCRP, n 1598 for IL-6, SAA and E-selectin).
The median serum concentrations of carotenoids, tocopherols and retinol are shown in Table 1. Serum carotenoid concentrations were positively associated with estimated fruit and vegetable intakes from dietary FFQ (see online supplementary Table S3), with the strongest associations between β-cryptoxanthin and estimated fruit intake (r 0·274; P< 0·001; Spearman's correlation), and between α- and β-carotene and estimated vegetable intake (r 0·216 and r 0·202, respectively; P< 0·001; Spearman's correlation).
One main carotenoid component explaining 63 % of the total variance in serum carotenoid concentration was identified from PCA for testing (see online supplementary Table S4 for factor loading matrix). This component showed high positive loading scores for all serum carotenoids.
We observed significant decreases in the median serum concentrations of hs-CRP, IL-6 and E-selectin with increasing quintiles of serum carotenoid component score (P< 0·001 for hs-CRP and IL-6 and P= 0·016 for E-selectin; ANCOVA-adjusted) independent of age, body weight and PAL (Table 3). The decrease in the median serum concentrations of SAA across the quintiles of serum carotenoid component score was not significant.
Table 4 shows the median concentrations of inflammatory markers across the quintiles of dietary biomarkers for vitamin E (α- and γ-tocopherol) and serum retinol. Serum concentrations of IL-6 decreased with increasing quintiles of serum α-tocopherol concentration, and we observed a reverse J-shaped association between the quintiles of serum SAA and α-tocopherol concentrations (IL-6, P< 0·001; SAA, P= 0·016; ANCOVA-adjusted). Serum concentrations of hs-CRP, SAA and E-selectin increased markedly with increasing quintiles of serum γ-tocopherol (hs-CRP, P= 0·03; SAA, P= 0·011; E-selectin, P= 0·007; ANCOVA-adjusted). There were marked decreases in the median serum concentrations of hs-CRP and IL-6 with increasing quintiles of serum retinol concentration (P< 0·001; ANCOVA-adjusted).
Table 4 Serum concentrations of inflammatory biomarkers (2007–11) across the quintiles (Q) of serum tocopherols and retinol (measured in 2007–11) (Median values and interquartile ranges (IQR))

hs-CRP, high-sensitivity C-reactive protein; SAA, serum amyloid A.
* Based on ANOVA with inflammatory marker as the dependent variable (transformed using natural logarithm) and dietary pattern quintile as the fixed factor (unadjusted).
† Based on ANCOVA with adjustment for age, body weight (n 2003 for hs-CRP; n 2022 for IL-6, SAA and E-selectin) and physical activity level (n 1588 for hs-CRP; n 1598 for IL-6, SAA and E-selectin).
Linear regression model data showed the associations between contemporary and past dietary and contemporary carotenoid component scores (generated from PCA) and serum hs-CRP concentrations (Table 5). Component scores for the ‘prudent’ dietary pattern and serum carotenoid measurements were strongly negatively associated with serum hs-CRP concentration (unstandardised β for prudent dietary pattern: − 0·053, 95 % CI − 0·102, − 0·003 and serum carotenoid component: − 0·183, 95 % CI − 0·233, − 0·134) independent of age, body weight, PAL, smoking status, national deprivation category, and serum concentrations of total, HDL, LDL, APOA-1 and APOB100 cholesterol, and TAG. A second meat-dominated pattern added a further dietary contribution (unstandardised β: 0·050, 95 % CI 0·000, 0·100). The past prudent diet also predicted hs-CRP concentrations 10 years later (unstandardised β: − 0·060, 95 % CI − 0·109, − 0·011) independently of confounders, and a minor dietary component (characterised by bread, potatoes, non-oily fish, and rich in oils and fats; see online supplementary Table S1) added an additional contribution (unstandardised β: 0·061, 95 % CI 0·011, 0·111) (Table 5).
Table 5 Results of multiple linear regression analyses to identify independent predictors of chronic low-grade systemic inflammation (assessed by serum high-sensitivity C-reactive protein (hs-CRP) concentration in 2007–11*) (β-Coefficients and 95 % confidence intervals)

PAL, physical activity level.
* The dependent variable was used in all the three models; hs-CRP was log-transformed.
† The following independent variables were entered in a stepwise manner for models 1 and 2: age; body weight; height; PAL; smoking status (never, past or current smoker); national deprivation category; circulating TAG; total cholesterol; HDL-cholesterol; LDL-cholesterol; APOA-1; APOB100.
‡ For models 1 and 2, the independent variables were taken from the 2007–11 study visits. In model 1, the four dietary patterns (obtained from the principal components analysis of diet assessed at 2007–11, accounting for 23·3 % of the total variation) were included and in model 2, the carotenoid component (obtained from the principal components analysis of serum carotenoids measured at the 2007–11 visits) was tested. Running the carotenoid model without PAL (n 1977 for the final model) gave similar results, but with LDL-cholesterol as an additional predictor contributing 0·2 % of the total variation (β − 0·114, 95 % CI − 0·214, − 0·014). Model 3 was a predictive model where independent variable measurements were taken at the 1997–2000 visits. The five dietary patterns obtained from the principal components analysis of diet assessed at the 1997–2000 study visits accounted for 25·6 % of the total variation in diet.
Discussion
A past ‘prudent’ dietary pattern was predictive of suppressed inflammatory biomarker concentrations 10 years later in the present study cohort of Scottish postmenopausal women, independent of the known major confounders of body weight and PAL. Overweight and age are associated with higher CLSI( Reference Dietrich and Jialal 37 ) and physical activity is associated with lower CLSI( Reference Woods, Vieira and Keylock 38 ). These data suggest that habitual dietary patterns may independently relate to chronic disease risk later in life.
Serum carotenoid factor score, which is an objective measure of dietary intake of fruit and vegetables, was associated with lower CLSI. Estimation of the prevalence of CLSI in the present study cohort based on serum concentrations of hs-CRP, IL-6 and SAA showed that the percentages of participants with 0, 1 or 2–3 of these biomarkers in the highest risk category for death from future CVD events( Reference Kip, Marroquin and Shaw 5 ) were 83·5, 11·4 and 5·1 %, respectively. We may have underestimated the extent of CLSI in the UK population, given the bias towards participation of generally ‘healthy’ individuals in population-based studies.
Consistent with observations in other populations( Reference Panagiotakos, Pitsavos and Stefanadis 11 – Reference Nettleton, Schulze and Jiang 18 ), the present cross-sectional data showed that a ‘prudent’ dietary pattern was associated with the suppression of inflammation. Body weight was the strongest independent predictor of CLSI, accounting for 10 % of the total variation in serum hs-CRP concentration, followed by serum HDL-cholesterol concentration (2·8 %), which may affect the concentrations of circulating inflammatory markers independently of diet, with PAL accounting for a further 0·8 %. The two dietary patterns found to be significant predictors, accounting for 0·4 % of the total variation in hs-CRP concentration. Beneficial effects of the ‘prudent’ dietary pattern may be associated with a range of dietary factors characteristic of this component such as plant-derived bioactive compounds( Reference Wagner and Elmadfa 27 ), soluble fibre( Reference Jenkins, Kendall and Vuksan 39 ) and n-3 fatty acids from marine sources( Reference Mozaffarian and Wu 40 ). The prudent dietary pattern derived at either visit (see online supplementary Table S1) reflects a balance of different foods including fish, dairy (yogurt and cream), pulses, fruit and vegetable groups, and negative associations with cakes and confectionery. The high factor loadings of these foods on the prudent dietary pattern (together with the observation that the average intakes in the highest quintile were about twice as high as the intakes in the lowest quintile; data not shown) indicate how much these foods contribute to this particular dietary pattern. It may be any one or more likely the combination of foods that is important for health.
In contrast, the second contemporary dietary pattern characterised by high meat consumption was associated with elevated serum hs-CRP concentration. Such an association supports hypotheses relating to saturated fats and elevation of CVD risk( Reference Mozaffarian, Katan and Ascherio 41 ) via the effects on inflammation and endothelial dysfunction( Reference Mozaffarian 42 ). The advantage of using dietary patterns that are generated by data reduction techniques such as PCA is that the patterns are independent of one another, but they can sometimes be difficult to interpret and caution is advised. PCA is a mathematical construct, and unexpected associations may be driven by individual food groups within these patterns, which could affect the outcomes. There will be differences in the types of food groups dominating the different patterns, depending on the population being studied. It is also not possible to directly compare dietary patterns generated at one time point with another, even within the same population, as foods may have loaded differently. This is observed when comparing the factor loadings between the past ‘detrimental’ dietary pattern and the contemporary ‘detrimental’ dietary pattern (provided in online supplementary Table S1), where the former had greater positive loadings for dried/tinned fruit, soups and cereals, and the latter had greater positive loadings for meat and potatoes. These differences may explain the discrepancy in the significant associations between CLSI and the second contemporary ‘high meat’ dietary pattern and the lack of association between CLSI and the second ‘processed’ past dietary pattern, but weak associations for the ‘minor’ past dietary pattern. However, there is consistency between the past and contemporary data after adjustment for confounders in the regression model, in that prudent diets at both visits were significant positive predictors of CLSI, whereas the ‘detrimental’ food diet had a weaker contribution, with the lower 95 % CI being close to zero in the regression model.
Estimated intakes of fruits from our FFQ were strongly positively associated with the serum carotenoid β-cryptoxanthin (see online supplementary Table S3). This may reflect consumption in present study population of β-cryptoxanthin-rich foods such as oranges and mandarin oranges, peaches and orange fruit juices( Reference Wagner and Elmadfa 27 , Reference Mangels, Holden and Beecher 43 ). Estimated vegetable intakes from our FFQ were strongly positively associated with serum concentrations of α- and β-carotene, which are found in a wide variety of vegetables including spinach, kale, green beans and carrots( Reference Wagner and Elmadfa 27 , Reference Mangels, Holden and Beecher 43 ). Our data support the previous findings from a 2-year fruit and vegetable trial which showed that β-carotene and β-cryptoxanthin may be suitable markers for monitoring fruit and vegetable compliance( Reference Macdonald, Hardcastle and Duthie 44 ).
As fruit and vegetable consumption has consistently been shown to be inversely related to serum inflammatory biomarker concentrations( Reference Esmaillzadeh, Kimiagar and Mehrabi 45 ), we measured serum carotenoid concentrations as a potential marker for overall fruit and vegetable intake. Carotenoid data were analysed, using the data reduction technique PCA, to obtain a single carotenoid component score. This approach allowed us to explain the maximum amount of variation for the five individual carotenoid concentrations with the minimum number of variables, whilst also avoiding issues of collinearity and multiple testing. It is important to note that fruit and vegetable intake is just one aspect of a healthy balanced diet and because of confounding with other important foods that may independently contribute to healthy outcomes, the serum carotenoid score may not only be a marker of fruit and vegetable intake, but could reflect the overall balance of foods in a diet.
We observed the associations between serum carotenoid component score and biomarkers of CLSI that were more marked than those of the empirically derived dietary patterns generated from dietary FFQ. Data from the present regression analysis show that with the exception of body weight, serum carotenoid component score was a stronger independent predictor of systemic inflammation than other study covariates (age, body height, PAL, serum lipid profile (the latter may affect the concentrations of circulating carotenoids independently of dietary carotenoid intake), and smoking status) accounting for 3·3 % of the total variation in serum hs-CRP concentration. The stronger inverse association between carotenoid component score and hs-CRP than that observed for the ‘prudent’ dietary pattern probably reflects the methodology. Dietary assessment in free-living populations is unavoidably an estimate of habitual diet, whereas the serum carotenoid data reflect an objective biological measurement. In terms of relating to overall disease risk, participants in the lowest quintile for carotenoid factor score had median serum concentration of hs-CRP indicative of a high risk for future CVD events (hs-CRP range 2·0–3·8 mg/l), whereas those in the highest quintile for serum carotenoid concentration had median serum hs-CRP concentration indicative of a mild risk for future CVD events (hs-CRP range 0·7–1·1 mg/l)( Reference Ridker 46 ).
For vitamin E, α-tocopherol is the most biologically active form and was associated with a suppression of systemic inflammation as indicated by serum IL-6 concentration. However, the opposite was true for γ-tocopherol, with increasing serum concentrations of hs-CRP, SAA and E-selectin across increasing quintiles of γ-tocopherol concentration. Serum α-tocopherol concentration has previously been positively correlated with healthy nutrient choices such as intrinsic sugars, dietary fibre and K in UK dietary surveys, whereas γ-tocopherol associated inversely with healthy nutrient choices( Reference Bates, Mishra and Prentice 47 ). Our findings appear to support this. Serum retinol may be an additional marker for a healthy diet as it reflects a diet rich in oily fish, a source of n-3 fatty acids that have anti-inflammatory properties. Differences in the significance between the markers may reflect their individual properties.
The present study had a number of strengths, principally the time period over which the study was conducted, with data collected at two visits over 10 years, and the large number of participants involved. The APOSS cohort was selected randomly from Community Health Index records; therefore, the present study cohort is representative of the general population. An additional strength was our novel approach to carotenoid analysis. Employing a combined factor score for serum carotenoid concentrations as a marker of habitual fruit and vegetable consumption avoids the errors associated with self-report. The carotenoid profile could be used in the future as an incentive for positive dietary change (i.e. for increasing fruit and vegetable intakes); however, further work would be required to test the feasibility of this approach.
We acknowledge some limitations. Although we have adjusted in the present analysis for a wide range of potentially confounding covariates, there may be other factors affecting inflammatory status for which we had limited data, such as the use of certain medications. The present study may also be affected by attrition bias, as we noted small differences in mean age, height, serum TAG, hs-CRP and smoking status between the returners and non-returners, suggesting that the returners were healthier than the non-returners. The response for the 2007–11 return visits was lower than anticipated, based on past experience. Possible explanatory factors include the busy lifestyle of potential participants, with many women of this age having responsibilities such as looking after grandchildren and/or caring for elderly relatives; a longer study visit (as most of the visits were also collecting data for Generation Scotland); and a different organisational approach from that of the previous visits. We do not believe that the attrition would have affected the present results markedly: taking hs-CRP as an example, if the mean hs-CRP concentration of the returners had been higher, it is possible that the associations may have been stronger.
In conclusion, our data show that within the limitations of the observational study design (which cannot prove causality), a ‘prudent’ dietary pattern and a serum carotenoid profile reflecting a fruit and vegetable-rich diet are associated with markers that are indicative of CVD risk reduction in postmenopausal women.
Supplementary material
To view supplementary material for this article, please visit http://dx.doi.org/10.1017/S0007114514001962
Acknowledgements
The authors are very grateful to Professor Blair Smith and Dr Lynne Hocking (both University of Aberdeen, UK), who oversaw Genetic Health in the 21st Century and Biomarkers for Battling Chronic Diseases studies within Generation Scotland, for allowing us to give the FFQ to the participants and for permission to use some aliquots of collected serum for the analysis; Mr Nicholas J. Vaughan (University of Aberdeen, UK) and Mr Ian Rothnie (Aberdeen Royal Infirmary, UK) for conducting the inflammatory biomarker analyses, and Mr Philip Morrice and Mrs Sharon Wood (both of University of Aberdeen, UK) for their contributions to the carotenoid and tocopherol analyses. The authors are extremely grateful to Mrs Carol Mckerron (University of Aberdeen, UK) for providing administrative support to the study and assisting with the recruitment of the participants. The authors thank the Clinical Research Facility staff for conducting the study visits (University of Aberdeen, UK), and work placement students Emilie Leprovost, Jackie Burr, Catherine Tosh and Rumana Newlands for assistance with the data entry. Finally, the authors thank all of the women who took part in the study.
The present study was supported by the Food Standards Agency and the UK Department of Health (grant no. N05086) and the Scottish Funding Council. G. G. D. and F. T. are grateful for support from the Scottish Government (Rural and Environmental Science and Analytical Services). None of the funders had a role in the design and analysis of the study or in the writing of this article.
The authors’ contributions are as follows: H. M. M., L. S. A., G. G. D., A. M., D. M. R. and F. T. contributed to the conception and design of the research; A. D. W., A. A. S., A. C. H. and W. G. S. conducted the research; W. G. S., G. G. D. and F. T. provided the essential reagents/materials; H. M. M., L. S. A., A. C. H., W. G. S., A. A. S. and A. D. W. conducted the statistical analysis and contributed to the interpretation; A. D. W., A. A. S. and H. M. M. wrote the paper. All authors critically appraised the manuscript and approved the final version.
The authors declare that there is no relationship with industry or financial associations that might pose a conflict of interest.


