Prevalence of non-communicable diseases has been spreading alarmingly around the world, in both sexes and among all age subgroups( Reference Beaglehole, Bonita and Horton 1 ). It has been estimated that, as the leading cause of death, non-communicable diseases resulted in 38 million (68 %) of the world’s deaths in 2012, of which more than 40 % were premature deaths under the age of 70 years( 2 ). The economic burden of chronic diseases also has become a major national problem( Reference Chaker, Falla and van der Lee 3 , Reference Muka, Imo and Jaspers 4 ), especially in developing countries( Reference Lee, Hamid and Pati 5 ).
Fish consumption is of interest in the prevention of chronic diseases. Given its favourable effects on non-communicable disease risk factors including blood pressure, lipid profile and inflammation( Reference He 6 ), several meta-analyses have shown an inverse association between fish consumption and risk of all-cause mortality( Reference Zhao, Sun and Yang 7 ), CHD mortality( Reference Zheng, Huang and Yu 8 ) and type 2 diabetes( Reference Wallin, Di Giuseppe and Orsini 9 ). It has been proposed that most of these beneficial effects come from the high content of very-long-chain fatty acids, EPA and DHA, that are mainly found in fatty fishes( Reference He 6 ). Many epidemiological studies have addressed this association and indicated that higher fish consumption is associated with lower rates of CVD, CHD and cerebrovascular mortality and their subtypes, including stroke mortality, fatal myocardial infarction and sudden cardiac death( Reference Daviglus, Stamler and Orencia 10 – Reference Yuan, Ross and Gao 12 ), but the results are inconsistent( Reference Yuan, Ross and Gao 12 – Reference Osler, Andreasen and Hoidrup 15 ).
Some evidence has shown some indications of potential regional differences in the association between fish consumption and risk of mortality. Asian studies generally reported an inverse association( Reference Lee, McLerran and Rolland 16 , Reference Wang, Thomas and Ho 17 ), while some Western studies reported no association, or even a higher risk associated with high fish consumption( Reference Osler, Andreasen and Hoidrup 15 , Reference Gillum, Mussolino and Madans 18 , Reference Olsen, Egeberg and Halkjaer 19 ). Although previous reviews have tested the dose–response relationship between fish consumption and risk of all-cause and CHD mortality( Reference Zhao, Sun and Yang 7 , Reference Zheng, Huang and Yu 8 ), potential differences in dose–response association between Western and Asian studies have not been previously determined. It has been proposed that some potential factors including fish preparation method, types of fish consumed and level of local contaminants may make a distinction in the association between fish consumption and health outcomes in different regions.
The aim of the present study was to further elucidate the shape of the dose–response relationships between fish consumption and risk of all-cause and CVD mortality, in Asian and Western studies separately. It seems that clarifying the shape of the dose–response relationship between fish consumption and risk of mortality, by considering regional differences, may open a window on the relatively sparse understanding regarding the proposed regional differences in the fish–mortality association and may confer new summarized evidence in response to proposed concerns attributed to high fish consumption.
Methods
The Preferred Reporting Items for Systematic Reviews and Meta-Analyses (PRISMA) checklist was used to perform the current meta-analysis and report the results( Reference Moher, Liberati and Tetzlaff 20 ).
Search strategy
A systematic literature search was done in PubMed and Scopus databases, from their inception up to August 2016, and then an updated search up to September 2016. The following combination of keywords was used to identify the potential relevant articles: (‘fish’ OR ‘fishes’ OR ‘seafood’ OR ‘fish protein’ OR ‘fish products’ OR ‘marine’ OR ‘animal protein’) AND (‘death’ OR ‘survival’ OR ‘mortality’ OR ‘fatal’ OR ‘event’ OR ‘events’ OR ‘prognosis’ OR ‘prognostic’ OR ‘outcome’ OR ‘Stroke’ OR ‘Cerebrovascular disease’ OR ‘intracranial hemorrhage’ OR ‘Cerebral infarction’ OR ‘CVD’ OR ‘Cardiovascular disease’ OR ‘Cardiovascular’ OR ‘Myocardial infarction’ OR ‘Ischemic heart disease’ OR ‘Coronary heart disease’ OR ‘Cancer’ OR ‘Carcinoma’ OR ‘Neoplasm’ OR ‘CHD’ OR ‘IHD’) AND (‘prospective’ OR ‘prospectively’ OR ‘Cohort’ OR ‘Cohorts’ OR ‘Longitudinal’ OR ‘observational’ OR ‘Observation’ OR ‘Follow-up’). Reference lists of retrieved articles and relevant reviews also were manually searched. The search was restricted to the articles published in English.
Eligibility and study selection
Two independent authors (A.J., S.E.) reviewed titles and abstracts of all studies and selected the prospective observational studies which: (i) reported fish intake in at least three quantitative categories; (ii) reported the outcome of interest including all-cause mortality and total CVD mortality; (iii) reported the number of cases and participants/person-years in each category of fish consumption, or reported sufficient information to estimate those numbers; (iv) were conducted in general populations aged more than 18 years; and (iv) reported risk estimates (relative risk (RR) or hazard ratio (HR)) and their corresponding 95 % CI of relevant mortality rate for each category of fish consumption.
Data extraction
Two independent investigators (A.J., S.E.) extracted the following information from eligible studies: first author’s name; publication year; study name; country; age range and/or mean age (years); number of participants; number of all-cause and/or CVD deaths; method of dietary assessment; exposure levels; reported risk estimates of all-cause and CVD mortality; and covariates adjusted for in multivariate analysis. The greatest degree of adjustment from each study was extracted and used for meta-analysis. Quality of included studies was assessed using the Newcastle–Ottawa scale( Reference Stang 21 ). We contacted the authors of nine studies to obtain the number of cases/participants in each category of fish consumption, to which the authors of only one study (Aus-Diab) reported the requested information. Any discrepancy was resolved through discussion.
Statistical analysis
All included studies were prospective observational studies and reported RR or HR across different categories of fish intake. The RR and 95 % CI were considered as the effect size of all studies. Linear dose–response relationship was estimated by using generalized least-squares trend estimation, according to the methods developed by Greenland and Longnecker( Reference Berlin, Longnecker and Greenland 22 , Reference Orsini, Bellocco and Greenland 23 ). We used the two-stage generalized least-squares trend estimation method, which first estimated study-specific slope lines and then combined with studies in which the slopes were directly reported to obtain an overall average slope( Reference Orsini, Bellocco and Greenland 23 ). Study-specific results were combined using a random-effect model. The median point in each category of fish consumption was assigned. If medians were not reported, we estimated approximate medians by using the midpoint of the lower and upper bounds. If the highest category of the studies was open-ended, we assumed that it had the same amplitude as the preceding category. If the lower boundary of the lowest category was not reported, we considered it as zero. For studies that reported fish consumption as times or meals per week or month, we considered each time or meal as one serving if the amount of each meal or time was not reported in the paper’s text( Reference Zheng, Huang and Yu 8 ). In studies in which the reference category was not the lowest one, we recalculated reported risk estimates assuming the lowest category as the reference if the numbers of cases and non-cases in each category were reported( Reference Hamling, Lee and Weitkunat 24 ). Potential non-linear association was examined by modelling consumption level using restricted cubic splines with three knots at fixed percentiles (10, 50 and 90 %) of the distribution( Reference Orsini, Li and Wolk 25 ). A P value for non-linearity of the meta-analysis was calculated by testing the null hypothesis that the coefficient of the second spline was equal to zero. At first, we tested the potential non-linear dose–response relationship using data from all included studies. In the next step, to better clarify the potential differences between Asian and Western studies, we separately tested the potential non-linear associations in Asian studies (Japan and China) and Western studies (USA and Europe).
Between-study heterogeneity was explored using Cochrane’s Q test of heterogeneity and the I 2 statistic (P < 0·05)( Reference Higgins, Thompson and Deeks 26 ). If heterogeneity existed, subgroup analyses were done based on some of the study and participant characteristics to explore the potential sources of the inconsistencies between studies. To test the potential effect of each study on the pooled effect size, sensitivity analyses were done by removing each study at a time. Potential publication bias was tested using Egger’s asymmetry test( Reference Egger, Smith and Schneider 27 ), Begg’s test( Reference Begg and Mazumdar 28 ) and the funnel plot (P < 0·10). All analyses were conducted with the statistical software package Stata version 13. P < 0·05 was considered statistically significant.
Results
Literature search and study characteristics
Figure 1 shows the literature search and study selection process. Systematic searching identified 6470 references; of these, 616 were duplicates and 5683 were non-relevant as determined at initial screening of the title and abstract, and thus were excluded. By full-text review, another 161 studies were excluded. Detailed reasons for exclusions are shown in Fig. 1. The remaining publications were eligible for inclusion in meta-analysis (Table 1). Three publications reported results for men and women separately( Reference Bellavia, Larsson and Wolk 29 – Reference Nagata, Takatsuka and Shimizu 31 ), and given use of different cut-off points for categorization of fish consumption in men and women, were included in meta-analysis separately. One publication reported results for men (Shanghai Men’s Health Study) and women (Shanghai Women’s Health Study), both separately and combined( Reference Takata, Zhang and Li 32 ), and because of the low number of studies in non-linear dose–response meta-analysis of CVD mortality, we selected and used the separate model. Finally, fourteen studies (ten publications) with 911 348 participants and 75 451 cumulative incident deaths were included in meta-analysis. Five studies (three publications) were from Asia( Reference Nagata, Takatsuka and Shimizu 31 – Reference Yamagishi, Iso and Fukui 33 ), one study was from Australia( Reference Owen, Magliano and O’Dea 34 ), four studies were from the USA( Reference Daviglus, Stamler and Orencia 10 , Reference Albert, Hennekens and O’Donnell 11 , Reference Bell, Kantor and Lampe 35 , Reference Folsom and Demissie 36 ) and four studies (two publications) were from Europe( Reference Bellavia, Larsson and Wolk 29 , Reference Engeset, Braaten and Teucher 30 ). General characteristics of included studies are shown in Table 1 and reported risk estimates of all-cause and CVD mortality in relation to different quantitative categories of fish intake in each study are provided in the online supplementary material, Supplemental Table 1.
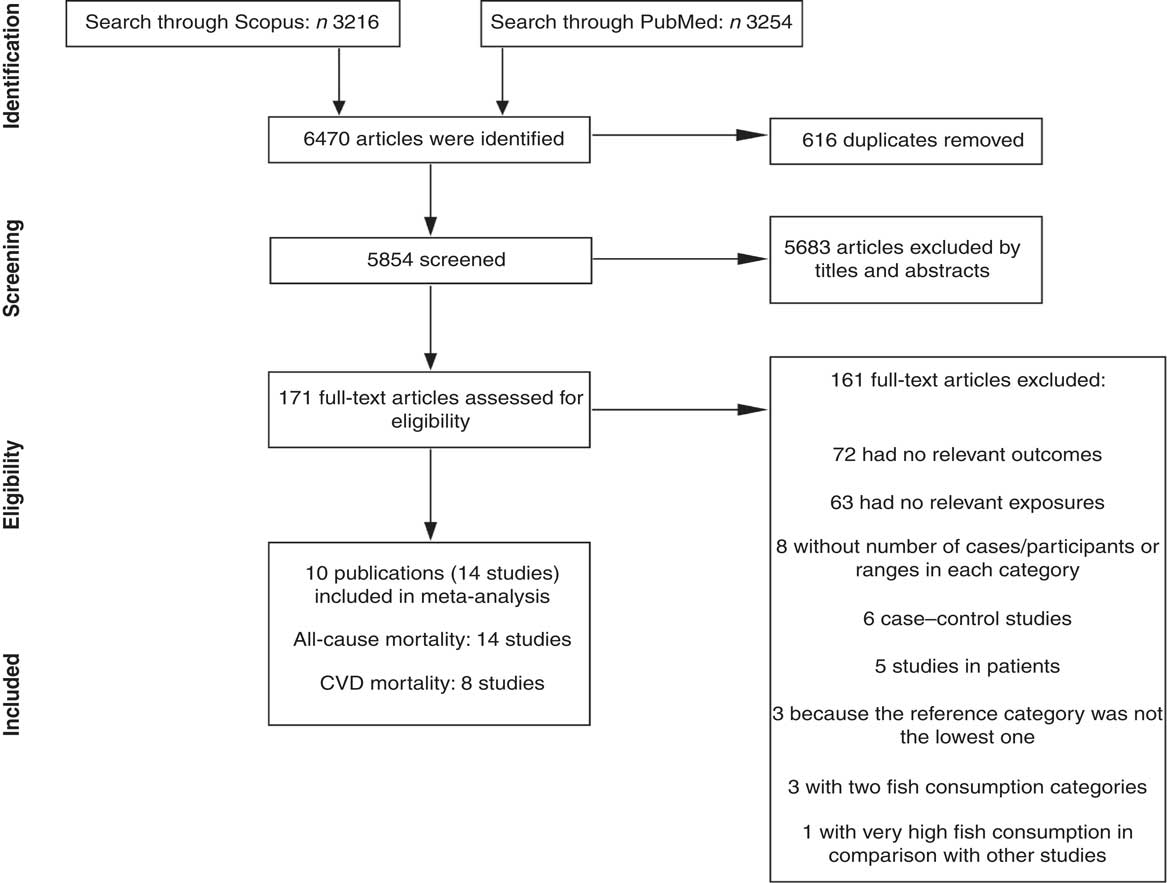
Fig. 1 Literature search and study selection process for inclusion in the present meta-analysis on fish consumption and risk of all-cause and cardiovascular mortality
Table 1 General characteristics of studies included in the present meta-analysis on fish consumption and risk of all-cause and cardiovascular mortality
SBP, systolic blood pressure; DM, diabetes mellitus; HTN, hypertension.
Fish consumption and all-cause mortality
Fourteen studies (ten publications), with 911 348 participants and 75 451 cases of overall mortality, were included in the analysis of fish consumption and all-cause mortality( Reference Daviglus, Stamler and Orencia 10 , Reference Albert, Hennekens and O’Donnell 11 , Reference Bellavia, Larsson and Wolk 29 – Reference Folsom and Demissie 36 ). The pooled RR of all-cause mortality for a 20 g/d increment in fish consumption was 0·98 (95 % CI 0·97, 1·00; Supplemental Fig. 1), with high heterogeneity (I 2=81·9 %, P heterogeneity < 0·0001). To test whether the pooled RR had been greatly influenced by a specific study, sensitivity analyses were done by removing each study in turn, but none of excluded studies resulted in a significant association. The associations were not statistically significant in either women or men. Results for subgroup analyses are provided in Table 2. A non-significant association persisted in most of the subgroups except for subgroups based on region, duration and study quality. The association was significant only among Asian studies (RR=0·97; 95 % CI 0·96, 0·98; I 2=0 %, P heterogeneity=0·49, n 5) compared with Western studies (RR=0·99; 95 % CI 0·97, 1·01; I 2=80·3 %, P heterogeneity < 0·0001, n 8), and also was significant only in the subgroup of studies with follow-up duration <13 years (RR=0·97; 95 % CI 0·96, 0·99; I 2=57·5 %, P heterogeneity=0·02, n 8) compared with >13 years of follow-up (RR=1·00; 95 % CI 0·98, 1·01; I 2=76·7 %, P heterogeneity=0·001, n 6). Subgroup analyses yielded region, number of cases, study quality and adjustment for intake of fruits and vegetables as the potential sources of the heterogeneity. Egger’s asymmetry test (P=0·008), but not Begg’s test (P=0·70), showed indication for publication bias. Some evidence of asymmetry was found in the funnel plot (Supplemental Fig. 2).
Table 2 Relative risk (RR) of all-cause mortality for a 20 g/d increment in fish consumption: subgroup analyses
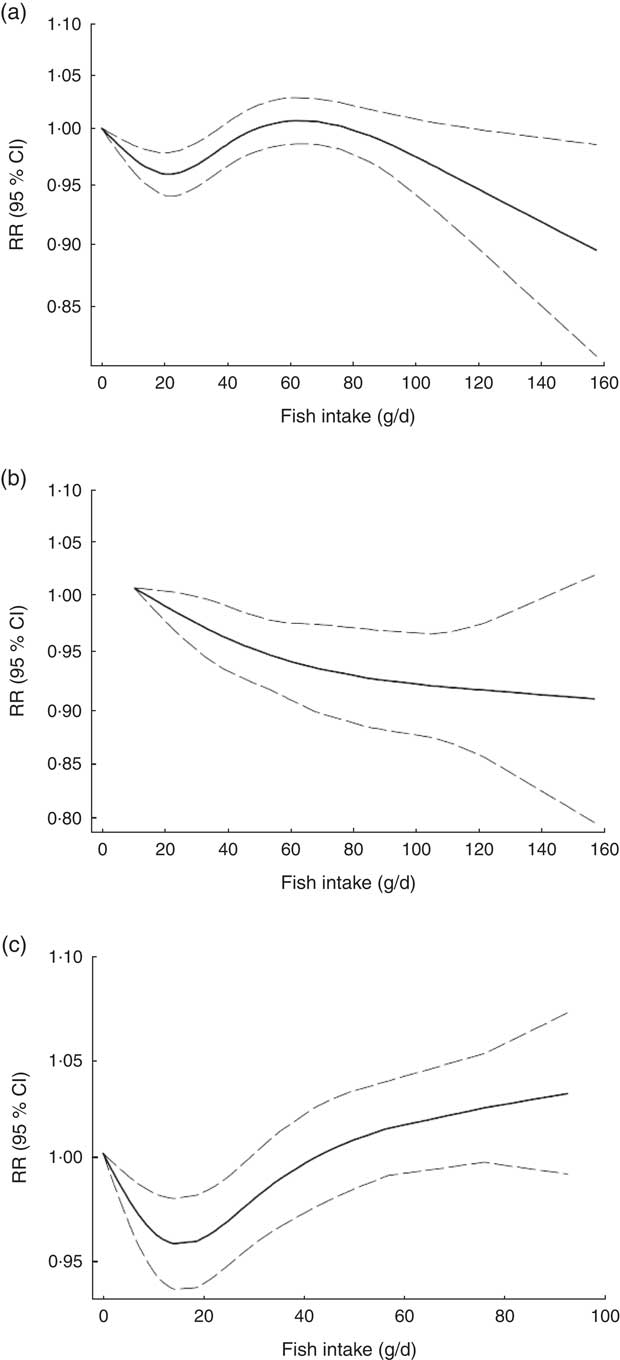
Non-linear dose–response meta-analysis suggested a U-shaped association between fish consumption and risk of all-cause mortality for fish consumption between 0 and 60 g/d, followed by a relatively sharp decrease in the risk with increasing fish intake of more than ~60 g/d (P non-linearity < 0·0001; Fig. 2(a)). When non-linear dose–response relationships were tested separately, the association appeared to be linear in Asian studies( Reference Nagata, Takatsuka and Shimizu 31 – Reference Yamagishi, Iso and Fukui 33 ) (P non-linearity=0·97, n 5; Fig. 2(b)), whereas a nearly U-shaped association was observed in the analysis of Western studies( Reference Daviglus, Stamler and Orencia 10 , Reference Albert, Hennekens and O’Donnell 11 , Reference Bellavia, Larsson and Wolk 29 , Reference Engeset, Braaten and Teucher 30 , Reference Bell, Kantor and Lampe 35 , Reference Folsom and Demissie 36 ), with a nadir at intake of ~20 g/d (P non-linearity < 0·0001, n 8; Fig. 2(c)).

Fig. 2 Dose–response association between fish consumption and risk of all-cause mortality: (a) from all studies (n 14, P non-linearity < 0·0001); (b) from Asian studies (n 5, P non-linearity=0·97); (c) from Western studies (n 8, P non-linearity < 0·0001). Associations are presented as relative risk (RR; ———) and 95 % CI (— — —)
Fish consumption and total cardiovascular mortality
Eight studies (seven publications), with 331 239 participants and 11 720 cases of CVD mortality, were included in analysis of fish consumption and total cardiovascular mortality( Reference Daviglus, Stamler and Orencia 10 , Reference Albert, Hennekens and O’Donnell 11 , Reference Bellavia, Larsson and Wolk 29 , Reference Takata, Zhang and Li 32 – Reference Owen, Magliano and O’Dea 34 , Reference Folsom and Demissie 36 ). A 20 g/d increment in fish consumption was significantly and inversely associated with the risk of CVD mortality (pooled RR=0·96; 95 % CI 0·94, 0·98; Supplemental Fig. 3), with no evidence of heterogeneity (I 2=0·0 %, P heterogeneity=0·62). In sensitivity analysis, none of the excluded studies changed the pooled RR materially. Subgroup analysis resulted in a non-significant association in Western studies (RR=0·97; 95 % CI 0·94, 1·00; n 4) compared with Asians (RR=0·96; 95 % CI 0·93, 0·99; n 3). Additional results for subgroup analyses are provided in Supplemental Table 2. Publication bias tests were not conducted (n < 10).
Non-linear dose–response meta-analysis indicated that the risk of CVD mortality decreased in parallel with the increase in fish consumption from zero up to ~100 g/d (P non-linearity=0·65; Fig. 3(a)). In analysis of three Asian studies( Reference Takata, Zhang and Li 32 , Reference Yamagishi, Iso and Fukui 33 ), the risk decreased along with the increase in fish consumption up to ~60 g/d, with no further substantial change in the risk (P non-linearity=0·71, n 3; Fig. 3(b)). Meanwhile, when analysis was restricted to four Western studies( Reference Daviglus, Stamler and Orencia 10 , Reference Albert, Hennekens and O’Donnell 11 , Reference Bellavia, Larsson and Wolk 29 , Reference Folsom and Demissie 36 ), a nearly U-shaped association was observed, with a nadir at intake of ~20 g/d (P non-linearity=0·05, n 4; Fig. 3(c)).
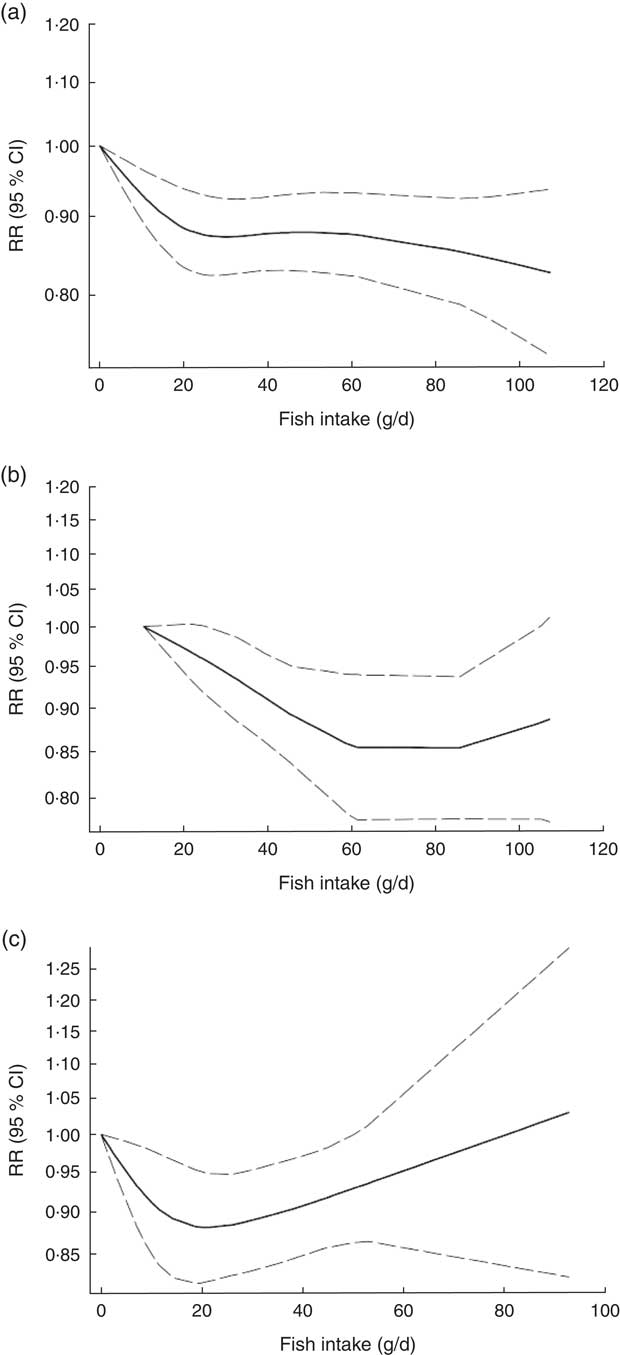
Fig. 3 Dose–response association between fish consumption and risk of total cardiovascular mortality: (a) from all studies (n 8, P non-linearity=0·65); (b) from Asian studies (n 3, P non-linearity=0·71); (c) from Western studies (n 4, P non-linearity=0·05). Associations are presented as relative risk (RR; ———) and 95 % CI (— — —)
Discussion
Principal findings
The present meta-analysis confers new summarized evidence regarding the association between fish consumption and risk of all-cause and CVD mortality, revealing that there are potential indications of regional differences in the fish–mortality association. We found that a 20 g/d increment in fish consumption was significantly and inversely associated with the risk of total CVD mortality (by 4 %) and marginally and inversely associated with the risk of all-cause mortality (by 3 %). Non-linear dose–response meta-analysis indicated that the shape of the dose–response relationship was U-shaped and linear in Western and Asian studies, respectively.
Findings in relation to previous studies
A recent meta-analysis of twelve prospective cohort studies (seven studies in dose–response meta-analysis) reported a significant inverse association between fish consumption and risk of all-cause mortality, with a nadir at consumption of ~60–80 g/d, and with no further change in the risk( Reference Zhao, Sun and Yang 7 ). Subgroup analysis indicated a non-significant positive relationship in the subgroup of European studies. In comparison to the previous study, we included six additional Western studies, with about 51 000 additional cases of all-cause mortality, making it possible to get relatively stronger statistical inference. We also found a 4 % significant decrement in the risk of CVD mortality per 20 g/d increment in fish consumption. To our knowledge, no other systematic review and meta-analysis has assessed the association between fish consumption and risk of total cardiovascular mortality.
More interestingly, we could test the non-linear dose–response association in Asian and Western studies, separately. Previous results showed that the shape of the association may vary according to geographical region. Significant inverse associations were mainly reported from Asian countries( Reference Lee, McLerran and Rolland 16 , Reference Takata, Zhang and Li 32 , Reference Yamagishi, Iso and Fukui 33 ), whereas some Western studies showed a modest U-shaped association( Reference Gillum, Mussolino and Madans 18 , Reference Bellavia, Larsson and Wolk 29 , Reference Engeset, Braaten and Teucher 30 ) in which both low and high fish intake were associated with greater risk. In our analysis of Western studies, we found that the risk of all-cause and CVD mortality decreased in a dose-dependent manner from baseline of zero up to ~20 g/d, and then increased with a relatively sharp trend. Meanwhile, our analysis of Asian studies suggested a linear decrement in the risk, especially in analysis of all-cause mortality.
Some potential explanations may justify this increment in the risk in Western countries. Previous studies have indicated that the level of methylmercury in the body increases with increasing fish intake( Reference Björnberg, Vahter and Grawé 37 – Reference McDowell, Dillon and Osterloh 39 ), and its elevated level is associated with higher risk of coronary events( Reference Raymond, Christensen and Thompson 40 ). However, in the present meta-analysis, the amount of fish consumption was clearly higher in Asian studies, wherein levels of mercury contamination in seafoods are relatively higher than in other geographical regions( Reference Brune, Nordberg and Vesterberg 41 – Reference Sioen, De Henauw and Van Camp 43 ); thus this hypothesis must be treated with caution.
Different methods of preparing fish and seafood may also make some distinctions in health outcomes of fish consumption in different geographical regions. It has been hypothesized that people in Western countries eat more deep-fried fish than Asians, whereas steaming and stir-frying are generally chosen for preparing fish and seafood in Asian societies( Reference Takata, Zhang and Li 32 ). Deep-frying may undesirably depress the beneficial effects of fish consumption( Reference Mozaffarian, Lemaitre and Kuller 44 ). A prospective evaluation within the Cardiovascular Health Study indicated that higher consumption of non-fried fish was inversely associated with the risk of CHD mortality, while a non-significant trend towards higher risk was observed along with the increase in fried fish consumption( Reference Mozaffarian, Lemaitre and Kuller 44 ). Another prospective cohort study in Australia indicated that non-fried fish consumption was marginally and inversely associated with the risk of CVD mortality in women, while total fish consumption was not( Reference Owen, Magliano and O’Dea 34 ).
Different types of fish also should be taken into consideration. Lean fish have lower amounts of n-3 fatty acids and are more likely to be deep-fried( Reference Mozaffarian, Lemaitre and Kuller 44 ). Meanwhile, fatty fish are generally rich in n-3, and results of two large population-based cohort studies in China suggested that higher intake of fatty fish may be more strongly associated with lower risk of all-cause and CVD mortality, compared with other types( Reference Takata, Zhang and Li 32 ). However, due to their higher content of fats, fatty fish are richer in polychlorinated biphenyls, of which higher intake is associated with higher CVD risk( Reference Bergkvist, Berglund and Glynn 45 , Reference Bergkvist, Kippler and Larsson 46 ). Unlike the Chinese cohorts( Reference Takata, Zhang and Li 32 ), results of the two large Swedish cohorts( Reference Bellavia, Larsson and Wolk 29 ) showed that higher intake of fatty fish, not lean fish, was accompanied with higher risk of mortality. When baseline characteristic of participants of these two publications were compared, substantially higher intakes of fruits and vegetables, and lower intakes of red and processed meat and total energy were observed in the Chinese population as compared with the Swedish, especially in upper categories of fish intake; suggesting that other dietary habits such as adherence to a Western-style dietary pattern may have a mediatory effect in the association between fish consumption and risk of mortality. Although in all above-mentioned cohorts results were adjusted for these dietary factors, the confounding effects of these adherent factors to fish intake could not be completely ignored. Additionally, a cross-sectional analysis within the European Prospective Investigation into Cancer and Nutrition (EPIC) indicated that types of fish consumption differed substantially across different countries, even among countries in a same geographical location (Europe), as well as across different sexes( Reference Welch, Lund and Amiano 47 ). Thus, owing to different nutritional content and different cooking methods used for various types of fish, it seems necessary to consider these factors when examining the association of fish consumption and any health outcome.
Mechanisms
It has been shown that higher consumption of n-3 fatty acids may be associated with lower risk of mortality( Reference Wang, Li and Chiuve 48 ), partially due to their favourable effects against inflammation and endothelial dysfunction( Reference de Mello, Schwab and Kolehmainen 49 – Reference Robinson and Mazurak 51 ). In addition, some evidence has indicated that consumption of fish could be more beneficial than consumption of n-3 fatty acids( Reference Chowdhury, Stevens and Gorman 52 , Reference Villegas, Takata and Murff 53 ), which may imply the existence of other beneficial nutrients in fish including essential amino acids, fat-soluble nutrients( Reference Lu, Chen and Zhang 54 ), trace elements( Reference D’Elia, Iannotta and Sabino 55 ) and other types of fats( Reference Guasch-Ferre, Babio and Martinez-Gonzalez 56 ). Furthermore, it has been indicated that fish consumption is positively associated with other healthy lifestyle-related factors such as higher educational level, higher exercise, not smoking and better healthy food score( Reference Wennberg, Tornevi and Johansson 57 ).
Strengths and weaknesses
The present study has several strengths. For the first time, we could address potential regional differences in the association between fish consumption and risk of all-cause and CVD mortality using non-linear dose–response meta-analysis. We could show that the shape of the association between fish consumption and risk of mortality may depend strongly on several potential factors such as dietary habits, methods of preparing fish, types of fish consumed and contamination levels, keeping this as an interesting topic for future investigations to elucidate exactly what potential factors cause these differences in effect. Third, we included prospective cohort studies with relatively high quality, making it possible to get an acceptable statistical inference and generalize the results.
Certain limitations in the present study need to be considered when interpreting the results. We were faced with high evidence of heterogeneity in analysis of all-cause mortality. However, subgroup analyses suggested region, number of cases, study quality and adjustment for intake of fruits and vegetables as the potential sources of the observed heterogeneity. Second, we have few Asian studies in the dose–response meta-analysis. However, the Asian studies were large-scale population-based prospective cohort studies with high quality. Third, Egger’s test and the funnel plot showed some indications of asymmetry in analysis of all-cause mortality. Additionally, publication bias tests were not conducted in analysis of CVD mortality (n < 10). Thus, our results may have been affected by publication bias, which in turn might result in overestimating the risk.
Conclusion
The present meta-analysis provided supportive evidence regarding the inverse association between fish consumption and risk of all-cause and total cardiovascular mortality, and could present further evidence regarding proposed regional differences in the fish–mortality association. We found that higher fish intake may be associated with higher risk of all-cause and cardiovascular mortality in Western countries, but not in Asians. Further research is needed with consideration of methods of preparing fish, types of fish consumed and potential local contaminants.
Acknowledgements
Financial support: This research received no specific grant from any funding agency in the public, commercial or not-for-profit sectors. Conflict of interest: None. Authorship: A.J., S.S.-B. and K.D. formulated the research questions and designed the study, A.J. and S.E. conducted the systematic search, screened the articles and extracted the data. K.D. and S.S.-B. analysed the data. A.J., S.S.-B., S.E. and K.D. wrote the article. All authors have read and approved the final manuscript. K.D. had primary responsibility for final content. Ethics of human subject participation: Not applicable.
Supplementary material
To view supplementary material for this article, please visit https://doi.org/10.1017/S1368980017003834