


There are significant and growing concerns regarding the adverse health effects of sugar-sweetened beverages (SSB). SSB provide energy but little to no nutrients other than added sugars. Adverse metabolic consequences of SSB consumption have been identified in experimental studies including insulin resistance, inflammation, visceral adiposity and atherogenic dyslipidaemia( Reference Malik, Popkin and Bray 1 ). Furthermore, high consumption of SSB is linked to substantially increased risks of dental decay, obesity, type 2 diabetes and CVD( Reference Malik, Popkin and Bray 1 , Reference Malik and Hu 2 ). SSB are aggressively marketed and widely consumed across the globe, with a recent Global Burden of Disease modelling study suggesting nearly 185000 deaths per year globally are attributable to SSB consumption( Reference Singh, Micha and Khatibzadeh 3 ). Given the accumulated scientific evidence, there is an urgent need for public health interventions to reduce consumption of SSB around the world( Reference Ravelo 4 ).
Research supports the strong links between food environments and patterns for SSB purchase and consumption. These environmental influences include beverage availability and display, price and marketing( Reference Han and Powell 5 , Reference Gustafson, Christian and Lewis 6 ). Despite strong evidence supporting health risks from SSB consumption, the food and beverage industry continues to dominate the market with an abundance of readily available, low-cost, heavily marketed SSB. The WHO recognises this and proposals such as the European Food and Nutrition Action Plan 2015–2020( 7 ) and the Global Strategy on Diet, Physical Activity and Health( 8 ) recommend fiscal regulation, alongside working closely with the food and beverage industry to decrease the availability and marketing of foods and drinks high in added sugars, such as SSB.
Alignment with WHO recommendations varies across the globe, with countries such as Mexico and Spain adopting a strong regulatory approach through taxation of SSB( 9 ). Other countries such as New Zealand (NZ), Australia and Canada currently avoid SSB fiscal taxation and instead work with the food and beverage industry to self-regulate the availability and marketing of SSB, although taxation of SSB has been suggested in all three countries in recent years, citing the negative impact that these products have on heath( Reference Veerman, Sacks and Antonopoulos 10 – 12 ). Currently, the UK plans to introduce a tiered fiscal beverage sugar tax on SSB in April 2018 that proposes three categories of taxation for drinks containing added sugars, based on the percentage of total sugars in the beverage( Reference Hashem, He and Jenner 13 ).
Public health groups promote ongoing monitoring of the nutritional composition of foods and beverages( Reference Neal, Sacks and Swinburn 14 ). Such data are needed to inform policy makers and the food industry of areas in the food supply that could be targeted for improvement, enable comparison with dietary guidelines and facilitate cross-sectional benchmarking between countries. Understanding the nutritional composition of foods and beverages is also needed to inform the design of policies such as reformulation and taxation, by identifying the types and numbers of products that will be affected. Finally, if assessed longitudinally, availability of nutrition composition data will also allow objective evaluation of the effectiveness of policies aimed at improving the nutritional composition of the food supply within countries( Reference Neal, Sacks and Swinburn 14 ). In addition to monitoring the nutritional composition, there are growing interest and calls for more regulations related to the package sizes and manufacturer’s recommended serving sizes of foods and drinks( Reference Wang and Vine 15 ). Container sizes frequently exceed the reference amounts for beverages as specified by the US Food and Drug Administration (FDA)( 16 ). In particular, carbonated sodas are frequently sold in large product sizes (1–2 litres) and are lower priced compared with other beverages categories. These larger product sizes distort consumer perception of what a ‘normal’ serving size should be and encourage higher consumption( 17 ).
Relatively few studies have assessed the energy and sugar composition of different categories of SSB products within countries( Reference Ventura, Davis and Goran 18 – Reference Walker, Woods and Rickard 20 ). The present paper is the first to evaluate differences in the nutritional composition and declared serving size of SSB between countries. To address these gaps in knowledge, the paper aimed to assess the energy and sugar content as well as the package and declared serving sizes of common SSB categories based on data collected from four countries: Australia, Canada, NZ and the UK. These countries were chosen due to availability of data, the rise in obesity in their populations and to meet the strong and growing interest in each country to implement policies targeting SSB consumption, such as reformulation and taxation( 21 – Reference Briggs, Mytton and Kehlbacher 23 ).
Methods
Nutritional composition data were collected from labels of non-alcoholic beverages from supermarkets in NZ, Australia, Canada and the UK between January 2015 and September 2016. The supermarkets chosen for data collection represented the major supermarket retailers in each country and nutrient data were collected from all packaged beverages within the chosen supermarket stores( 24 ). In NZ, data were collected from four large supermarkets in Auckland (representing 92 % grocery market share) using a smartphone app as part of a larger ongoing study( Reference Eyles, Neal and Jiang 25 ). Nutrition information was recorded into an online database (NutriWeb®) before extracting for analysis. Australian data were collected from four retail supermarket stores in Sydney, using the FoodSwitch Data Collector App, before entering into The George Institute’s branded food composition database( Reference Trevena, Neal and Dunford 26 ). These retail supermarkets represent 88 % of grocery market share in Australia. Canadian data were collected in the Greater Toronto area of Ontario from the three largest supermarkets in Canada, representing 68 % grocery market share. The data were collected using the Food Label Information Program (FLIP) smartphone app and stored in the online FLIP database( Reference Bernstein, Schermel and Mills 27 ). Data from the UK were collected from nine different supermarket chains in the Greater London and surrounding areas, to cover 87 % of market share. These data were also collected using the FoodSwitch Data Collector App and stored in the UK FoodSwitch online database. Additional beverage products were also collected from all four countries using online shopping stores. These included Countdown (NZ), Coles (Australia), Tesco’s and Sainsburys (UK), and Zehr’s and Loblaws (Canada). Nutritional content was taken directly from the supermarket websites. Approximately 10 % of the online products were checked against the nutritional information available on the manufacturer websites, with no errors detected.
The present study included all beverages categories that contained SSB and that were available in all four countries for cross-comparison. This included fruit and vegetable juices (in which the product contained 100 % juice or juice was the majority (highest proportion) ingredient), fruit-based drinks (in which juice was present but water was the majority ingredient), carbonated soda drinks, water drinks (including carbonated and flavoured waters as well as coconut water), and sports and energy drinks. Due to a lack of data from one or more of the four different countries, tea- and coffee-based beverages were excluded, as were milk/protein-based beverages. All alcoholic beverages, dry concentrate beverage mixes and concentrated cordials were also excluded; products were included in the analysis only if the product and nutritional information represented a ready-to-drink beverage.
For each product, the following data were recorded from the product nutrition labels: brand name, product name, energy (kJ), protein, fat, carbohydrate and sugar content (g/100 ml), ingredients list, manufacturer-declared serving size and number of servings per pack. Where the amount of sugar/carbohydrate was recorded as ‘less than one gram’ it was entered into the spreadsheet as 0·5 g.
All data were transferred to a Microsoft® Excel 2010 spreadsheet for cleaning. Identical products recorded in different stores and different pack sizes of the same product (within a country) were considered duplicates and removed from the data set. Product data were also removed where nutritional information was not recorded (this was less than 1 % of all products). Where possible, any missing data (ingredients or nutritional information) were later added to the spreadsheet by checking the product labels in question, either by viewing the product in the supermarket or on the manufacturer’s website. Most serving sizes in Canada were reported in millilitres but a small number of products were given in fluid ounces (these were products of the USA). All imperial measures were converted to millilitres for analysis (1 US fluid ounce=29·56 ml).
Data analyses
Volumetric nutritional content
Descriptive statistics report the mean total energy (kJ), total sugar and carbohydrate content (g/100 ml) of each beverage category, compared by country. Descriptive statistics also report the number and percentage of products that contain added sugar, including all those in which sugar, cane sugar, honey, glucose–fructose syrup, glucose, sucrose, fructose and high-fructose corn syrup were reported on the label ingredients list (≥0·1 g/l). Multivariate regression analysis tested for total sugar (g/100 ml) using country as the predictor and the sugar content of each of the five beverage categories as the outcome. Post hoc tests with simple between-country contrasts identified the influential countries that contributed to any significant differences.
Serving size
Analyses also determined the proportion of products in each country that exceeded the reference serving size for each beverage category( 16 , 28 ). A reference amount of a beverage refers to that usually consumed by a person per consumption occasion( 16 ). To calculate this, the serving size as declared on the pack by the manufacturer was used for comparison. Due to a lack of equivalent guidelines in all the countries in question, the FDA reference maximum single serving sizes of 250 ml for fruit juice and fruit-based drinks, 375 ml for carbonated and non-carbonated (non-fruit) beverages, and 600 ml for water and sports drinks were used to calculate the number of products in each country/category that exceeded the reference serving size( 16 , 28 ). The maximum value for each range was used as the reference measure to determine the number of products that exceeded this single serving amount. Pearson’s χ 2 tests tested for differences in the proportions of beverages in each country that exceeded these FDA reference recommendations.
Nutritional content per serving
To further evaluate how consumption of SSB may relate to current dietary guidelines, the proportions of single serving products whose total free sugar content exceeded the WHO recommendations of <5 % and <10 % of total daily energy intake were calculated( 29 ). This analysis was carried out using all beverages in which the product container was an actual single serving size (≤600 ml)( 16 ), rather than using the manufacturer-declared serving size of all products. To calculate the number of products that exceeded the WHO recommendations, the mean free sugar content (g) of each single serving product was determined (using the total product size and data from the nutritional information panel). Reference data from the UK Scientific Advisory Committee on Nutrition report that 5 % of total energy as free sugars is equivalent to 19–25 g for children aged 4–10 years and 30 g for children aged ≥11 years and adults( Reference Barber and Baker 30 ). Based on an average 2014 UK total energy intake of 6400 kJ (children) and 9600 kJ (adults), a 5 %/10 % level of free sugars was calculated to be 20 g/40 g for children and 30 g/60 g for adults, respectively( Reference Barber and Baker 30 ). Free sugar was defined as all monosaccharides (e.g. glucose and fructose) and disaccharides (e.g. sucrose) added to the beverage by the manufacturer as well as all naturally occurring sugars present in honey, syrups, fruit juices and juice concentrates( Reference Hashem, He and Jenner 13 ).
Taxation
Data were analysed to determine the number of products that may potentially be affected by a sugar tax using the proposed 2018 UK three-tiered soft drinks industry levy (SDIL)( Reference Barber and Baker 30 ). Taxation categories were <5 g/sugar/100 ml (no tax), 5–8 sugar/100 ml (18 % tax per litre) and >8 g sugar/100 ml (24 % tax per litre). Pure fruit juices (100 %) and milk-based drinks are excluded from the proposed tax, hence the fruit juice category was excluded from this analysis. Pearson’s χ 2 tests were used to determine if there were statistical differences between countries. Descriptive analyses report the number of products in each beverage category in each taxation bracket.
Statistical analysis
All data analyses were performed per 100 ml of product unless described otherwise. Data were organized and processed in Microsoft® Excel 2010. Statistical analyses were performed using the statistical software package IBM SPSS Statistics version 24. A Bonferroni adjustment was applied for multivariate testing and significance was accepted at P≤0·0125 (for comparison between the four countries).
Results
After data cleaning, a total of 4157 products were used for analysis including 749 from NZ, 1738 from Australia, 740 from Canada and 930 from the UK.
Volumetric nutritional content
Overall, NZ had the largest proportion of supermarket beverages that contained added sugar (52·3 %). This was significantly higher than Australia (42·2 %), Canada (42·8 %) and the UK (9·0 %; P≤0·001). Table 1 presents the mean total energy (kJ), total sugar and carbohydrate content (g/100 ml) of each beverage category by country.
Table 1 Nutritional composition analysis of beverages from supermarkets in New Zealand (NZ; n 749), Australia (n 1738), Canada (n 740) and the UK (n 930); data collected from labels in January 2015–September 2016
* Includes any of the words ‘sugar’, ‘cane sugar’, ‘honey’, ‘glucose–fructose syrup’, ‘glucose’, ‘sucrose’, ‘fructose’ and ‘high-fructose corn syrup’ on the label.
† Includes any product that contains ≥0·001 g sugar on the nutrition information panel (includes products with natural and added sugars). As all fruit juices and fruit-based drinks contain sugar rather than sugar-containing products being a subset as with other categories, data for juices and juice-based drinks were reported for ‘All products’ and reported as ‘n/a’ for sugar-containing products.
‡ Includes all juice-containing beverages where water is listed as the majority ingredient.
§ Includes all beverages containing 100 % fruit or vegetable juice or where juice was the majority ingredient (and listed first on the ingredient list).
║ Includes carbonated waters, flavoured waters and coconut water drinks.
¶ Country (countries) identified in post hoc tests as accounting for the significant difference.
There were significant differences between countries for the sugar content of beverages. These differences applied across carbonated sodas (F (df3)=19·9, P<0·001), fruit-based drinks (F (df3)=11·5, P<0·001), water (F (df3)=4·0, P=0·009) and sports/energy drinks (F (df3)=3·9, P=0·01). The UK had a significantly lower sugar content than other countries in the carbonated soda, fruit drink and sports/energy beverage categories. Canada had a lower sugar content than Australia and NZ in the carbonated soda and water categories.
For carbonated soda sugar content, significant between-country differences were found for Australia and NZ v. UK (both P≤0·001) and Australia and NZ v. Canada (P=0·0125 and 0·003 respectively). Canada was not significantly different from the UK (P=0·48). Table 1 highlights the significantly lower mean sugar content of carbonated sodas for the UK.
For fruit drinks, the lower mean sugar content for the UK was significantly different from Australia, NZ and Canada (P<0·001), with no other significant differences between the latter three countries (Table 1). For the water category, significant differences existed between NZ and Canada (P=0·001) for mean sugar content. Comparisons between Australia and Canada (P=0·028) and UK and Canada (P=0·06) did not reach the required statistical significance.
In the sports/energy drink category, the UK (P=0·01) and Australia (P=0·001) were significantly different from NZ and Canada, with a lower mean sugar content. Fruit juices were the only beverage category where there were no significant differences in mean sugar content (includes natural sugars) between the four countries (F (df 3)=0·568, P=0·637; Table 1).
Serving size
Overall, Australia had the largest percentage of total products in which the manufacturer’s declared serving size exceeded the FDA reference maximum serving size for the product category; 36 % of Australian products exceeded this, compared with 10·5, 9·4 and 9·3 % of NZ, Canada and UK products, respectively (all P<0·001). When comparing beverage categories (irrespective of country), fruit juices had the greatest number of products exceeding the reference serving size (33·6 %), followed by sports drinks (17·0 %), fruit-based drinks (15·1 %), carbonated soda (4·4 %) and water (4·1 %).
Overall, the mean manufacturer-declared single serving sizes were similar between NZ, Australia and Canada for all fruit juices, fruit-based drinks and carbonated soda, but were consistently lower for the UK (see Table 2). Canada had the highest mean declared single serving size for waters while NZ had the highest mean declared single serving size for sports and energy drinks.
Table 2 Beverage sugar content in a single serving and proportion of products exceeding the US Food and Drug Administration’s (FDA) reference serving size, based on information present on the manufacturer-declared product nutritional information panel (NIP), of beverages from supermarkets in New Zealand (NZ; n 749), Australia (n 1738), Canada (n 740) and the UK (n 930); data collected from labels in January 2015–September 2016
a,b,c,dWithin each beverage category, percentage values with unlike superscript letters were significantly different (P≤0·01).
* Includes all sugars, both naturally occurring and added.
† Calculated for sugar (either natural or added)-containing products only.
‡ Based on the maximum FDA single serving recommendations(16).
§ Includes all juice-containing beverages where water is listed as the majority ingredient.
║ Includes all beverages containing 100 % fruit or vegetable juice or where juice was the majority ingredient.
¶ Includes carbonated waters, flavoured waters and coconut water drinks.
NZ had the highest proportion of carbonated soda products that exceeded the FDA single serving size (significant v. the UK, P≤0·01); however, Australia had the greatest number of products for fruit juices and juice-based drinks. In all beverage categories, the UK reported the lowest proportion of products that exceeded the FDA recommendations.
Nutritional content per serving
Similarly, the mean content of sugar (g) per declared serving was also lower in UK products than in those from NZ, Australia and Canada for fruit juices, fruit-based drinks, carbonated soda and sports/energy drinks.
When only those beverages that comprised a single serving pack size (≤600 ml) were included for analysis (Table 3), the mean sugar content (natural and/or added) per product was generally comparable between countries for all beverage categories analysed. However, the UK had lower levels of total sugar per product compared with Australia, NZ and Canada for carbonated soda, fruit-based drinks and sports/energy drinks. The greatest number of products that exceeded the WHO recommendations (products that contain less than 5 % and 10 % of daily energy as free sugars in a single serving as declared on the nutrition information panel) were carbonated sodas, with more than two-thirds of sugar-containing products in this category in Australia, NZ and Canada exceeding 10 % of an adult’s total energy intake as free sugars in one single serving of beverage (see Table 3). The UK showed substantially lower proportions of products exceeding the daily free sugar recommendations for several beverage categories, including both at the ≥5 % and the ≥10 % free sugar level (Table 3).
Table 3 Sugar content of actual single serving products (≤600 ml) and the proportion of single serving products that exceed the WHO-recommended cut-offs of 5 % or 10 % of total daily energy as free sugarsFootnote * in beverages from supermarkets in New Zealand (NZ; n 749), Australia (n 1738), Canada (n 740) and the UK (n 930); data collected from labels in January 2015–September 2016
a,bWithin each beverage category for children, percentage values with unlike superscript letters were significantly different (P≤0·01).
* Based on WHO sugar intake guidelines(29).
† Product size irrespective of manufacturer-declared serving size information on the nutrition information panel.
‡ Calculated for sugar (either natural or added)-containing products only.
§ 5 % and 10 % daily energy as free sugars is equivalent to ≥20 g/40 g for children and ≥30 g/60 g for adults(30). Free sugars defined as all monosaccharides (e.g. glucose and fructose) and disaccharides (e.g. sucrose) added to the beverage by the manufacturer as well as all naturally occurring sugars present in honey, syrups, fruit juices and juice concentrates(30).
║ Includes all juice-containing beverages where water is listed as the majority ingredient.
¶ Includes all beverages containing 100 % fruit or vegetable juice or where juice was the majority ingredient.
** Includes carbonated waters, flavoured waters and coconut water drinks.
Potential impact of UK taxation of sugar-sweetened beverages
The number of products that would potentially be affected by a sugar-levy tax was determined using the proposed UK SDIL( Reference Hashem, He and Jenner 13 ). The data are shown in Fig. 1.
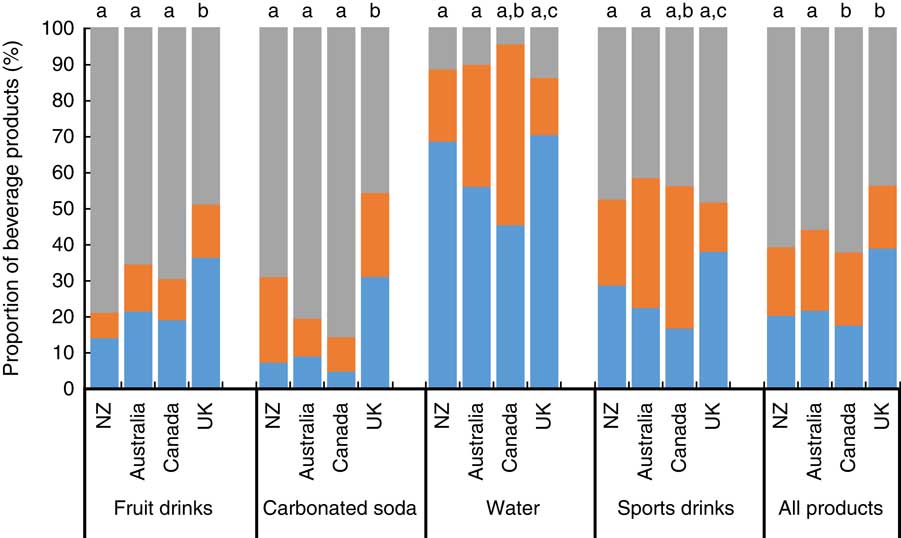
Fig. 1 (colour online) Proportion of beverage products from New Zealand (NZ), Australia, Canada and the UK for which the proposed UK three-tiered sugar-tax levy would apply. The UK sugar-tax levy proposes three categories: ![]() , <5 g sugar/100 ml (no tax);
, <5 g sugar/100 ml (no tax); ![]() , 5–8 g sugar/100 ml (18 % tax per litre);
, 5–8 g sugar/100 ml (18 % tax per litre); ![]() , >8 g sugar/100 ml (24 % tax per litre). a,bWithin a category, unlike lower-case letters indicate significant differences (P≤0·01) in the number of taxable products (≥5 % sugar)
, >8 g sugar/100 ml (24 % tax per litre). a,bWithin a category, unlike lower-case letters indicate significant differences (P≤0·01) in the number of taxable products (≥5 % sugar)
Overall, all four countries had a majority of beverages in all categories that would potentially be subject to taxation using the proposed levy system. Canada had the highest total proportion of products that contained ≥5 % sugar and therefore would be eligible for taxation (82·5 %), this being statistically higher than Australia (76·1 %; $\chi _{{(1,{\rm }n{\rm }1204)}}^{2} $
=6·1, P=0·01) and the UK (61·2 %;
$\chi _{{(1,{\rm }n{\rm }1204)}}^{2} $
=6·1, P=0·01) and the UK (61·2 %; $\chi _{{(1,{\rm }n{\rm }1315)}}^{2} $
=46·6, P<0·0001), but not NZ (79·7 %). Canada, Australia and NZ all had comparable proportions of products that would fall into the highest tax bracket of >8 % sugar (62·3, 57·3 and 60·8 %, respectively), all three being statistically higher than the UK (43·8 %; all P<0·0001).
$\chi _{{(1,{\rm }n{\rm }1315)}}^{2} $
=46·6, P<0·0001), but not NZ (79·7 %). Canada, Australia and NZ all had comparable proportions of products that would fall into the highest tax bracket of >8 % sugar (62·3, 57·3 and 60·8 %, respectively), all three being statistically higher than the UK (43·8 %; all P<0·0001).
Across beverage categories, carbonated soda had the greatest proportion of products that would be taxable overall (86·1 v. 76·3, 74·2 and 40·6 % for fruit-based drinks, sports/energy drinks and waters, respectively). Similarly, carbonated soda had the most products containing >8 % sugar (70·7 v. 64·0, 45·0 and 10·5 %, respectively). As expected, the waters category had the lowest proportion of taxable products, this being due to the lower mean total sugar content compared with other beverage categories (refer to Table 1).
When looking within specific beverage categories, differences were observed for the number of taxable products. Within the fruit-based drinks and the carbonated soda categories, NZ, Australia and Canada all contained proportionally more taxable products than the UK (see Fig. 1). Canada also had the highest level of potentially taxable products in the water and sports/energy drink categories.
Discussion
Across the four countries, SSB dominate the non-alcoholic beverage market, with Australia having the highest overall percentage of products with added sugar in three of the five beverage categories (fruit-based drinks, carbonated sodas and sports/energy drinks) and NZ having the highest proportion overall. Out of the sugar-containing products, the UK had notably fewer products containing added sugar across four of the five beverage categories, and mean added sugar content was significantly lower for sugar-sweetened carbonated sodas compared with NZ, Australia and Canada (7·1 v. 9·8, 9·8 and 10·5 g/100 ml, respectively).
Previous studies investigating the percentage of non-alcoholic beverages containing added sugar sold in NZ supermarkets have reported similar findings to the current study. One study on the availability, serving size and sugar content of non-alcoholic beverages found that 83 % of beverages in 2012 contained added sugar or were naturally sweetened( Reference Ni Mhurchu and Eyles 31 ). A further study carried out in NZ in 2016 found that 90 % of carbonated beverages, 88 % of cordials and 70 % of fruit drinks contained added sugar( Reference Chepulis, Mearns and Skinner 19 ). Furthermore, in that study, carbonated beverages and fruit juices derived >85 % of their total energy content from sugar( Reference Chepulis, Mearns and Skinner 19 ).
There appear to be few data on the nutritional content of SSB in Canada, although it has been reported that one in five calories in the Canadian diet comes from sugar, with 35 and 44 % of the daily sugar intake coming from beverages in adults and children, respectively( Reference Langlois and Garriguet 32 ). In addition, one study has reported that the median sugar content of beverages in Canada is 9·2 g/100 ml with 72 % of all non-alcoholic beverages having sugar added( Reference Bernstein, Schermel and Mills 27 ), although there was no breakdown of the sugar content of different beverage categories.
A prior survey of 2014 UK data of carbonated SSB available in nine major UK supermarkets found a higher average free sugar content (9·12±3·2 g/100 ml)( Reference Hashem, He and Jenner 13 ). This higher percentage compared with the current study may be due to the greater number of supermarkets sampled and a different product range, although it is also possible that the free sugar content has been lowered in UK beverages in response to the proposed 2018 SDIL tax levy. In addition, the mean serving size of UK beverages was smaller than those for Canada, Australia and NZ. This may be partly due to a change in guidance in the UK for serving size of fruit juice (now 150 ml), as well as a change to recommendations for free sugars consumption in line with the WHO recommendations that sugar intake should be less than 10 %, and ideally less than 5 %, of the total daily energy intake( 29 ). Since carbonated sodas were identified as the main contributor to free sugar intakes in the UK population( Reference Merchant, Tripathi and Pervaiz 33 ) and public health campaigners have worked to draw attention to the need for reductions in this area, this may explain why manufacturers have worked to reduce the amount of free sugars in their products, as well as offering more low/zero-calorie no-added-sugar alternatives, and changes to recommended serving sizes on packages.
Multiple studies support strong associations between availability, purchasing and consumption of SSB( Reference Merchant, Tripathi and Pervaiz 33 , Reference Brisbois, Marsden and Anderson 34 ). A wastage of 30–40 % is predicted to occur between availability and consumption, but generally the higher the availability of SSB, the higher the population consumption( Reference Popkin and Hawkes 35 ). Using annual food balance information collected by the FAO, Singh et al. calculated proxy SSB availability data based on total sugar and fruit availability, with known percentages of each that go into production of SSB and fruit juice, respectively( Reference Singh, Micha and Khatibzadeh 36 ). Across 187 countries, NZ had the highest consumption of fruit juices at an average of 0·83 (95 % uncertainty interval 0·44, 1·44) servings daily in 2010( Reference Singh, Micha and Khatibzadeh 36 ). Australia also had a high consumption of fruit juice. Although these consumption patterns date back to 2010, they align with the number of fruit juice products available in the current study, where NZ had two to six times more fruit juice products available than the other countries, and Australia had three to four times more than the UK and Canada, respectively (Table 1). While this does not directly reflect increased risk for non-communicable diseases within populations, inevitably these associations suggest higher consumption of SSB, which is one of many factors contributing to obesity and related diseases.
High dietary intakes also relate to the portion sizes consumed; the Australian Adult Nutrition Survey (AANS) indicated that the top 10 % of SSB consumers drink up to 1·5 litres/d( 17 ). In the current study up to 56 % of manufacturer-declared single serving sizes exceeded the FDA reference serving size. Furthermore, SSB sold in larger containers (i.e. 500/600 ml bottles) can be consumed in one sitting, even if the packaging recommends two or three servings per pack, and therefore result in an increased intake of added sugar. However, while there appears to be no evidence that SSB serving sizes have decreased in recent years, it has been reported that SSB intake may be declining over time. AANS reported that SSB consumption has reduced from 43 % of the population in 1995 to 34 % of the population in 2011( 17 ). Similar data from the UK National Diet and Nutrition Survey( 37 ) and the Canadian Community Health Survey( Reference Brisbois, Marsden and Anderson 34 ) show that SSB consumption has decreased across all age groups since 2008, although all studies report that sugar consumption from beverages is still high and well above WHO recommendations, particularly in youth and adolescents. A recent study published in 2017( Reference Crino, Herrera and Ananthapavan 38 ) suggests that reductions in package size may also successfully decrease SSB consumption further, although these authors note that the majority of package/portion size initiatives are voluntary and at the discretion of the food industry. Modelling has suggested that a package size cap of 375 ml for SSB would result in a reduction of body weight of 0·12 kg, this improving further to a 0·23 kg reduction if the products were also reformulated to reduce the energy content( Reference Crino, Herrera and Ananthapavan 38 ).
Despite the reductions in SSB noted above, it is clear from the findings of the present study that the current nutrient composition of SSB, their high availability and large serving sizes are not conducive to reducing the intake of added sugar in the population. This is particularly applicable in NZ and Australia, which consistently had the highest proportion of SSB for each of the five beverage categories included in the present study. Current WHO guidelines and recommendations for maximum consumption of added sugar are exceeded across all countries and the present study suggests that beverage manufacturers do not adhere to them either, selling beverages in serving sizes that provide more added sugar per serving than 10 % of total energy intake. The present study found that NZ had the highest percentage of fruit juices with sugar added. Consumption of fruit juices does not align with the most recent guidance in the NZ Ministry of Health’s food and activity guidelines for both children( 39 ) and adults( 40 ), where fruit juice is no longer recognized as a fruit serving and is advised for nil or occasional consumption only. This suggests that self-regulation by the food and beverage industry is not aligning with the recommended healthy eating guidelines.
Research does show that fiscal regulation can positively affect SSB intake. In Mexico, for example, an excise tax on SSB introduced in 2012 appears to have decreased purchasing of SSB by 5 % in the first-year post tax, and then up a 12 % decrease in the second year( Reference Colchero, Popkin and Rivera 41 ). Importantly, however, this taxation cost was passed on to the consumer and thus had the greatest effect on low socio-economic groups (who also demonstrated the highest price elasticity of demand)( Reference Colchero, Salgado and Unar-Munguia 42 ). In addition, a review of the feasibility of SSB taxation in Canada suggests that SSB purchasing and consumption would likely decrease as a result of a tax that involves a price increase of 10–20 %( Reference Le Bodo, Paquette and De Wals 43 ). In contrast, the UK SDIL tax is targeted at manufacturers with the cost purported to not be passed on to the consumer. Thus, in the UK, the impetus on not on a reduction of SSB sales but on reformulation (lowering of sugar content) to avoid taxation.
When the proposed UK SDIL was applied to all the data in the present study as a formula to derive the percentage of products across each category that would be subject to sugar taxation, carbonated sodas were the category most affected, with 86 % taxable overall, the majority of these in the >8 g sugar/100 ml tax bracket. Across all categories (except energy/sports drinks), the UK had a significantly lower percentage of products that would be subject to taxation than the other three countries. It is possible that the impending fiscal taxation on sugar is stimulating the UK beverage industry to reformulate existing product lines to reduce their added sugar content, reduce recommended serving size, and offer more products in the low-sugar/sugar-free categories (that will not be subject to taxation) and fewer products in the 5–8 g sugar/100 ml and >8 g sugar/100 ml categories that will be subject to taxation. More research is needed on the effects of both impending and implemented fiscal taxation of sugar; however, it may be a useful catalyst to encourage manufacturers to take action.
Various studies have reported that sugar taxation reduces the prevalence of obesity and obesity-related disease( Reference Brownell, Farley and Willett 22 , Reference Hu 44 ), although the impact of SSB taxation on these outcomes seems less clear and needs further evaluation.
One of the limitations of the current study is that different methods for collection of data were used between countries, which may have influenced the comparability of data. Additionally, data on milk-based beverages were not collected across all countries, so this excluded an entire category of SSB from the analysis. This omission was important to allow for a complete cross-country comparison, but may affect the interpretation of the market for single countries where flavoured milk is a popular choice.
A further limitation is that the data were collected at slightly different times during the year for each country, which may have introduced a seasonal effect on the product range at the time of data collection. The authors also note that while all available beverages meeting the study criteria were included in the beverage list for each category/country, this resulted in an uneven number of products across countries, with Australia having far more products available for each category than the other three countries. This may have influenced the findings and conclusions drawn from the data. Lastly, the study looked specifically at nutrition composition data and no purchasing or consumption data were collected. The latter are essential to determine the impacts of taxation and manufacturer reformulation on health outcomes. However, the strength and scientific contribution of our study is that it offers a snapshot comparison of the nutrient content and availability of SSB across four countries with different policies and guidelines around the composition and regulation of SSB. This offers some relevant comparisons about the potential effects of fiscal v. self- or informal regulation of the beverage industry with regard to SSB, and identifies further areas where research is needed and why additional policies are required to reduce free sugar intakes in these populations.
Conclusion
Substantial differences exist across countries, particularly with regard to the free sugar content of carbonated sodas, fruit juices, fruit drinks and energy/sports drinks. The beverage industry in NZ and Australia, in particular, is replete with nutrition-poor, energy-dense beverages that are heavily marketed and readily available. Self-regulation by the food and beverage industry is not working and policies are urgently required that influence the purchasing of SSB (e.g. through marketing, composition, price and availability) as a strategy to address factors that contribute significantly to the current obesity epidemic and high intakes of free sugars in these countries. Implementation of a levy or other regulatory policies, such as the setting of mandatory targets, could be effective in encouraging manufacturers to reduce the sugar content of beverages and thereby reduce consumption of added sugar, helping to combat obesity and improve public health.
Acknowledgements
Acknowledgments: The authors would like to thank Dr Helen Eyles (Auckland University, NZ) for providing some of the data for analysis. They would also like to thank Dr Mary L’Abbe and Alyssal Schermel of the University of Toronto for the use of the mobile data collection app and access to their FLIP nutrition database. Thanks also go to Jodi Bernstein for her support with manuscript review. Financial support: A student summer scholarship payment was awarded to S.H. to support the data cleaning and analysis. Conflict of interest: None. Authorship: L.C. collected the Canadian data, undertook the statistical analyses and manuscript preparation. S.H. undertook all data entry and cleaning. M.C. was responsible for collation of Australian data. S.A. and K.J. were responsible for collection of UK data. S.A., K.J., G.M. and J.H.Y.W. assisted with manuscript writing and preparation. Ethics of human subject participation: Not applicable.


