


Wasting and stunting are common conditions in children. It is estimated that 52 million children are wasted, 16 million of whom are severely wasted, and 155 million children are stunted( 1 ). Wasting and stunting are implicated in the deaths of almost 2 million children annually and account for over 15 % of all disability-adjusted life years lost in young children( Reference Black, Victora and Walker 2 ). These figures are likely to underestimate burden because the number of wasted children present in a population (i.e. prevalent cases) found from unadjusted cross-sectional prevalence estimates will miss many incident cases of an acute condition( Reference Hure, Oldmeadow and Attia 3 ).
Wasting and stunting in children tend to be addressed as separate issues in programmes, policy and research. Recent reviews have called this separation into question( Reference Shoham, Dolan and Gostelow 4 – Reference Briend, Khara and Dolan 8 ). Wasting and stunting are often present in the same populations( Reference Victora 9 ) and there is evidence that the two conditions share underlying and immediate causal factors( Reference Martorell and Young 10 , Reference Christian, Lee and Donahue Angel 11 ). Investigation into whether there is a direct causal relationship between wasting and stunting is ongoing and a number of gaps in the evidence base have been identified( Reference Angood, Khara and Dolan 12 ). There has also been recent recognition that children may be both stunted and wasted at the same time( 13 – 15 ). National estimates of the prevalence of concurrent wasting and stunting in children, calculated for eighty-four countries, range between 0 and 8 %, exceeding 5 % in nine countries( Reference Khara, Mwangome and Ngari 16 ). The factors leading to this state of ‘concurrence’ are poorly understood but the available evidence indicates that considerable excess mortality is experienced by these children. The level of excess mortality is not explained by the severity of their wasting and stunting alone. This suggests a multiplicative effect on mortality of having both deficits( Reference McDonald, Olofin and Flaxman 17 , Reference Myatt, Khara and Schoenbuchner 18 ). The magnitude of the mortality risk associated with concurrent wasting and stunting is similar to that associated with severe acute malnutrition (SAM)( Reference Olofin, McDonald and Ezzati 19 ). This raises the question of whether these children should be included in therapeutic feeding programmes which historically have treated only children with SAM as currently defined by the WHO and UNICEF using three independent diagnostic criteria:
1. mid-upper arm circumference (MUAC) below 115 mm;
2. weight-for-height Z-score (WHZ) below −3·0; and
3. the presence of bilateral nutritional oedema.
The presence of one or more of these criteria is enough to warrant admission into a therapeutic feeding programme( 20 ).
To investigate whether all children with concurrent wasting and stunting (WaSt) require therapeutic feeding and to better understand whether multiple diagnostic criteria are needed to identify children with a high risk of death and in need of treatment, an analysis examining which anthropometric indices are independently associated with near-term mortality is likely to prove a useful approach. The data for this type of analysis should come from a community-based cohort study assessing the risk of death in a representative sample of untreated children. Studies collecting data for such an analysis are no longer possible. The development of community-based management of acute malnutrition (CMAM) programmes capable of delivering effective SAM treatment at high levels of coverage have made it unethical to leave high-risk children untreated. The aim of the present paper is to describe the results of an analysis examining the ability of different anthropometric case definitions to identify children at high risk of near-term death. The analysis was performed using an existing data set from a historical community-based cohort study that pre-dates the development of CMAM programme models. An earlier analysis of the same data set showed strong relationships between a variety of nutritional indicators and mortality, with the highest population-attributable fractions associated with MUAC and WAZ( Reference Garenne, Maire and Fontaine 21 ).
Methods
Data sources
The analysis presented here is based on a data set collected in 1983 and 1984 in Niakhar, a rural area of the Fatick region of central Senegal. These data have been described in detail elsewhere( Reference Garenne, Maire and Fontaine 22 ). An open cohort of 5751 children, comprising all children under 5 years of age living in thirty villages in the study area, was followed through time. Each child was visited up to four times at 6-month intervals in May and November of 1983 and 1984. Anthropometric measurements were taken at each visit. All measurements were taken by the research staff after careful training and standardisation( Reference Garenne, Maire and Fontaine 22 , Reference Briend, Garenne and Maire 23 ). Weight was measured to the nearest 10 g using beam scales (SECA France, Semur en Auxois, France). Length and height were measured to the nearest 1 mm using ‘Harpenden’ length/height measurement boards (Holtain Ltd, Crymych, UK). MUAC was measured to the nearest 1 mm using non-elastic (fibreglass) tapes. Survival was monitored for all children using a demographic surveillance system operating in the study villages that was established in 1962( Reference Cantrelle 24 ). The ages of children at each visit were calculated using the dates of birth taken from this demographic surveillance system and the dates of measurement by research staff. Approval for the original study was obtained from the International Health Department, the Scientific Commission and the Director General of ORSTOM/IRD (the French Institute for Scientific Research Overseas/Research Institute for Development) in France and from the Ministry of Health, Department of Statistics, Census Bureau and ORANA (Office de Recherches sur l’Alimentation et la Nutrition Africaines) in Senegal. Fieldwork was supported by ORSTOM/IRD, ORANA and the European Union’s DG-XII directorate (grant number TDR-36). Participation in the study was voluntary. Oral informed consent was obtained from principal caregivers. The analysis presented here did not involve new data collection and was done using anonymised records; therefore, it did not require further ethical approval.
Height-for-age, weight-for-age and weight-for-height Z-scores (HAZ, WAZ and WHZ, respectively) were calculated using the WHO growth standards( 25 ). The outcome of interest was death within 183 d (i.e. 6 months) of anthropometric assessment. The analysis was intended to investigate the association between anthropometry and near-term mortality to inform the selection of case-finding and admission criteria for therapeutic feeding programmes. These programmes treat SAM in children aged 6–59 months with the same standard protocol using ready-to-use therapeutic foods. These children represent the vast majority of children currently treated in such programmes. Therefore, the current analysis used data only for children aged 6–59 months at the time of anthropometric assessment (n 5144). The units of analysis used in the analyses are the individual 6-month follow-up episodes (12 638 episodes with 304 deaths).
Data management and data analysis were performed using purpose-written R language (version 3.5.1) scripts managed using the R Analytic-Flow scientific workflow system (version 3.1.8).
Association between anthropometry and mortality
Bivariate associations between different anthropometric variables (i.e. HAZ, WAZ, WHZ and MUAC) and death within 6 months of measurement were examined by estimating mean values for died and survived follow-up episodes using Student’s t test and the common language effect size (probability of superiority) statistic( Reference McGraw and Wong 26 ), which estimates the probability that a value drawn at random from the survived group will be greater than a value drawn at random from the died group. The null (i.e. no difference) value for the common language effect size statistic is 0·5. Multiple logistic regression was used to distinguish between real and apparent (i.e. due to confounding) associations. All variables with significant associations in the bivariate analyses were entered into the model. Non-significant variables were removed using backwards stepwise elimination with the least significant variable (P >0·05) removed at each step.
Association between anthropometric status and mortality
Bivariate associations between anthropometric case definitions and death within 6 months of measurement were examined by calculating risk ratios from two-by-two tables. Standard case definitions for severe undernutrition were used;
1. Severely stunted: HAZ < −3·0.
2. Severely underweight: WAZ < −3·0.
3. Severely wasted: WHZ < −3·0.
4. Severely low MUAC: MUAC < 115 mm.
An additional anthropometric case definition for being concurrently wasted and stunted (WaSt) was also used;
5. WaSt: WHZ < −2·0 and HAZ < −2·0.
Multiple logistic regression with death within 6 months of measurement as the outcome, as described above, was used to distinguish between real and apparent (i.e. due to confounding) associations.
Using anthropometry to predict mortality
The possibility of identifying all, or nearly all, children with severe anthropometric deficits who are likely to die within 6 months of measurement using a combination of anthropometric case definitions was explored using four-dimensional Venn diagrams with sets defined by WAZ, WHZ, MUAC and WaSt case definitions( Reference Venn 27 ). WHZ < −3·0 and MUAC < 115 mm case definitions were used because these are commonly used as admission criteria for programmes treating SAM( 20 ). An appropriate threshold for a WAZ case definition was found by a directed search for the lowest WAZ threshold that, in combination with MUAC, detected all deaths associated with the WHZ and WaSt case definitions. A second analysis used MUAC < 125 mm instead of MUAC < 115 mm. This threshold is used in programmes integrating treatment of both severe and moderate acute malnutrition( Reference Maust, Koroma and Abla 28 ). Sensitivity, specificity and Youden’s index: $J={\rm Sensitivity}+{\rm Specificity}-1,$
were estimated for case definitions based on combinations of WAZ, WHZ, MUAC and WaSt case definitions. Youden’s index measures overall performance of a screening or diagnostic test( Reference Youden 29 ). The maximum value of Youden’s index occurs for case definitions that optimise differentiating ability when equal weight is given to sensitivity and specificity. Risk ratios for death within 6 months of measurement in the populations selected using different combinations of MUAC and WAZ case definitions identified by the Venn diagram analysis were estimated.
Effects of changing case definitions on programme caseloads
The effect of changing case definitions on program caseloads was investigated using simple ‘what-if?’ simulations. The model used was: ${\rm Caseload}={\rm Population}{\times}{\rm Prevalence}{\times}{\rm Coverage}{\rm .}$
The population term was fixed at 17 000 assuming a service delivery unit (e.g. a health district) with a total population of 100 000 with 17 % of the total population aged between 6 and 59 months. Prevalence and coverage terms were modelled using fuzzy triangular numbers and fuzzy arithmetic with 95 % CI for ratio estimates calculated for a triangular distribution( Reference Kaufman and Gupta 30 , Reference Forbes, Evans and Hastings 31 ). Prevalence was modelled using the 25th, 50th and 75th percentiles of prevalence estimates from 2426 nutritional anthropometry surveys from fifty-one countries from 1992 to 2015( Reference Myatt, Khara and Schoenbuchner 18 ). Coverage for programmes admitting using MUAC was modelled using the 25th, 50th and 75th percentiles of coverage estimates from 227 coverage assessments of CMAM programmes from twenty-nine countries from 2009 to 2017 recorded in a database provided by the Coverage Monitoring Network. Recent CMAM programme coverage estimates for cases meeting the WHZ < −3 admission criteria were unavailable. Work on coverage undertaken in pilots of the CMAM programme model found coverage of cases with WHZ < −3 to be consistently low (i.e. ≤20 %). It was assumed that coverage for WHZ cases would be one-third that of coverage for MUAC cases. It was assumed that cases with WAZ < −2·8 would be identified by growth monitoring or growth monitoring and promotion (GM/GMP) programmes. A literature review was undertaken and found useable coverage data for twenty-three GM/GMP programmes of differing scope and design from fourteen countries( Reference Pearson 32 – Reference Ngirabega, Leonard and Munyanshongore 39 ). GM/GMP coverage was defined as a population coverage of more than three measurements in the previous 6 months. It was assumed that coverage in lower socio-economic groups (i.e. those groups most at risk of malnutrition) would be 80 % of reported coverage. It was also assumed that the interface between GM/GMP programmes and CMAM programmes would be imperfect, with 80 % of cases identified by the GM/GMP programmes being admitted into CMAM programmes. Coverage of children with WAZ < −2·8 was modelled using the 25th, 50th and 75th percentiles of the resulting estimates.
Results
Association between anthropometry and mortality
Table 1 shows the results of the analysis of bivariate associations between anthropometric variables and death within 6 months of measurement in the Niakhar cohort data. HAZ, WAZ, WHZ and MUAC were all negatively associated with death within 6 months of measurement. Table 2 shows the results of the multivariate analysis after non-significant variables had been removed. Only WAZ and MUAC were independently associated with death within 6 months of measurement.
Table 1 Bivariate associations between anthropometric variables and death within 6 months of measurement among children aged 6–59 months in the Niakhar cohort data, rural Senegal( Reference Garenne, Maire and Fontaine 22 )

HAZ, height-for-age Z-score; WAZ, weight-for-age Z-score; WHZ, weight-for-height Z-score; MUAC, mid-upper arm circumference.
* P value for Student’s t test.
† Common language effect size (probability of superiority) statistic. The statistic estimates the probability that a value drawn at random from the survived group will be greater than a value drawn at random from the died group. The null (i.e. no difference) value is 0·5. The statistic is based on comparison of c. 123 million pairs of values.
Table 2 Independent associations between anthropometric variables and death within 6 months of measurement * among children aged 6–59 months in the Niakhar cohort data, rural Senegal( Reference Garenne, Maire and Fontaine 22 )

WAZ, weight-for-age Z-score; MUAC, mid-upper arm circumference.
* Variables remaining in the model after non-significant variables were removed using backwards stepwise elimination.
† WAZ is recorded in Z-scores but MUAC is recorded in millimetres. A comparable OR for MUAC and death within 6 months of measurement is approximately 0·97SD(MUAC) ≈ 0·9713·72 ≈ 0·66.
Anthropometric status and mortality
Table 3 shows the results of the analysis of the bivariate associations between anthropometric case definitions and death within 6 months of measurement in the Niakhar cohort data. All anthropometric case definitions were associated with death within 6 months of measurement. Table 4 shows the results of the multivariate analysis after non-significant variables had been removed. Only severe underweight (WAZ < −3·0) and severely low MUAC (MUAC < 115 mm) were independently associated with death within 6 months of measurement.
Table 3 Anthropometric case status and relative risk of death within 6 months of measurement (bivariate analysis) among children aged 6–59 months in the Niakhar cohort data, rural Senegal( Reference Garenne, Maire and Fontaine 22 )

RR, risk ratio; WHZ, weight-for-height Z-score; MUAC, mid-upper arm circumference; WaSt, concurrent wasting and stunting; HAZ, height-for-age Z-score; WAZ, weight-for-age Z-score; CMAM, community management of acute malnutrition.
* P value for Fisher’s exact test.
† MUAC < 115 mm is commonly used for case finding in the community for admission to CMAM programmes. It is the primary CMAM programme admission criterion in many countries.
Table 4 Independent associations between anthropometric case status and death within 6 months of measurement * among children aged 6–59 months in the Niakhar cohort data, rural Senegal( Reference Garenne, Maire and Fontaine 22 )

MUAC, mid-upper arm circumference; WAZ, weight-for-age Z-score; CMAM, community management of acute malnutrition.
* Variables remaining in the model after non-significant variables were removed using backwards stepwise elimination.
† MUAC < 115 mm is commonly used for case finding in the community for admission to CMAM programmes. It is the primary CMAM programme admission criterion in many countries.
Using anthropometry to predict mortality
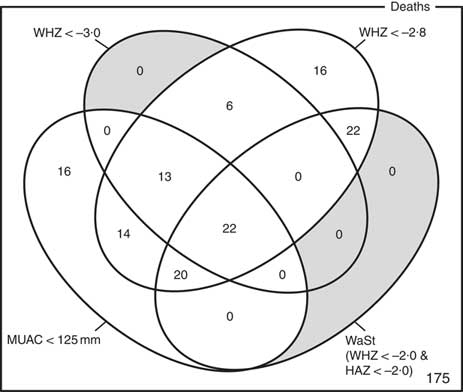
The optimum WAZ threshold (i.e. the lowest WAZ threshold that detected all deaths associated with the WHZ and WaSt case definitions when used in combination with MUAC case definitions) was WAZ < −2·8. Figure 1 shows the four-dimensional Venn diagram for sets defined using the MUAC < 115 mm, WHZ < −3·0, WAZ < −2·8 and WaSt case definitions. The inclusion of WHZ < −3·0 and WaSt did not identify additional deaths when MUAC < 115 mm and WAZ < −2·8 were used to select high-risk children. Figure 2 shows the four-dimensional Venn diagram for sets defined using the MUAC < 125 mm, WHZ < −3·0, WAZ < −2·8 and WaSt case definitions. Increasing the MUAC cut-off to 125 mm identified additional deaths but WAZ < −2·8 still identified deaths not identified using MUAC.
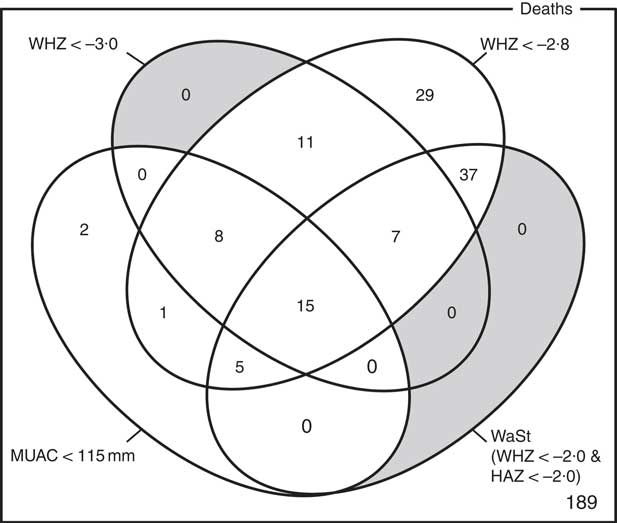
Fig. 1 Numbers of deaths identified using MUAC < 115 mm, WHZ < −3·0, WAZ < −2·8 and WaSt case definitions among children aged 6–59 months in the Niakhar cohort data, rural Senegal( Reference Garenne, Maire and Fontaine 22 ). The shaded area shows cells outside the union of the MUAC < 115 mm and WAZ < −2·8 sets. MUAC < 115 mm or WAZ < −2·8 detected all deaths associated with WaSt and with WHZ < −3·0. MUAC < 115 mm or WAZ < −2·8 detected more deaths than MUAC < 115 mm or WHZ < −3·0 (MUAC, mid-upper arm circumference; WHZ, weight-for-height Z-score; WAZ, weight-for-age Z-score; WaSt, concurrent wasting and stunting; HAZ, height-for-age Z-score)
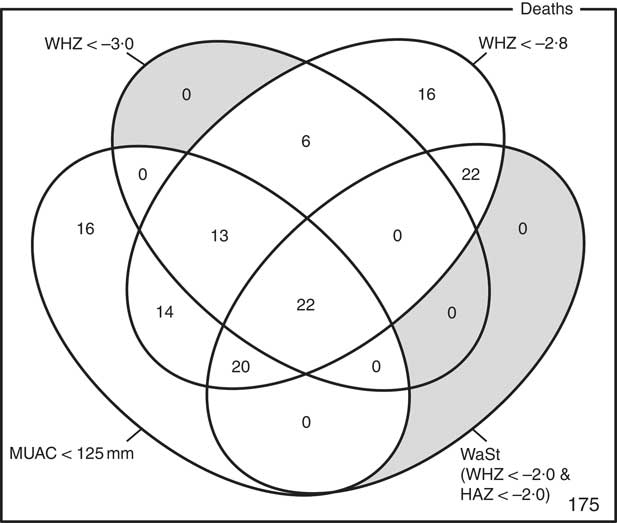
Fig. 2 Numbers of deaths identified using MUAC < 125 mm, WHZ < −3·0, WAZ < −2·8 and WaSt case definitions among children aged 6–59 months in the Niakhar cohort data, rural Senegal( Reference Garenne, Maire and Fontaine 22 ). The shaded area shows cells outside the union of the MUAC < 125 mm and WAZ < −2·8 sets. MUAC < 125 mm or WAZ < −2·8 detected all deaths associated with WaSt and with WHZ < −3·0. MUAC < 125 mm or WAZ < −2·8 detected more deaths than MUAC < 115 mm or WHZ < –3·0 (MUAC, mid-upper arm circumference; WHZ, weight-for-height Z-score; WAZ, weight-for-age Z-score; WaSt, concurrent wasting and stunting; HAZ, height-for-age Z-score)
Table 5 presents point estimates of sensitivity, specificity and Youden’s index for case definitions based on combinations of WAZ, WHZ, MUAC and WaSt case definitions. Overall performance (i.e. simplicity, the number of deaths detected, sensitivity, specificity and Youden’s index) was better for case definitions based on WAZ and MUAC. Adding WaSt or WHZ criteria resulted in slightly degraded performance (i.e. slightly reduced specificity).
Table 5 Point estimates of sensitivity, specificity and Youden’s index for detecting near-term deaths of different screening/admission criteria based on combinations of WAZ, WHZ, MUAC and WaSt case definitions among children aged 6–59 months in the Niakhar cohort data, rural Senegal( Reference Garenne, Maire and Fontaine 22 )

WAZ, weight-for-age Z-score; WHZ, weight-for-height Z-score; MUAC, mid-upper arm circumference; WaSt, concurrent wasting and stunting.
* The screening criteria (case definition) used to detect children with high risk of death.
† WaSt refers to WHZ < −2·0 and HAZ<−2·0.
‡ The best-performing (i.e. in terms of the number of indicators in the screening/admission criteria (fewer is better), the number of deaths detected (more is better) and Youden’s index (higher is better) screening criteria found in this analysis.
Risk ratios for death within 6 months of measurement in the populations selected using combinations of MUAC and WAZ case definitions identified by the Venn diagram analysis – i.e. MUAC < 115 mm; MUAC < 125 mm and MUAC ≥ 115 mm; WAZ < −2·8 and MUAC ≥ 115 mm; WAZ < −2·8 and MUAC ≥ 125 mm – are presented in Fig. 3.

Fig. 3 Risk ratios (RR) for death within 6 months of measurement (with their 95 % CI represented by horizontal bars) associated with different MUAC and/or WAZ case definitions among children aged 6–59 months in the Niakhar cohort data, rural Senegal( Reference Garenne, Maire and Fontaine 22 ) (MUAC, mid-upper arm circumference; WAZ, weight-for-age Z-score
Effects of changing case definitions on programme caseloads
Table 6 presents the results of the simple ‘what-if?’ simulations of the effect of changing case definitions on programme caseload. The simulated caseload for programmes admitting using MUAC < 115 mm and WHZ < −3 was 123 (95 % CI 68, 260) cases per 17 000 population. The simulated caseload for programmes admitting using MUAC < 115 mm or WAZ < −2·8 was 355 (95 % CI 179, 644) cases per 17 000 population. The simulated caseload for programmes using MUAC < 115 mm or WAZ < −2·8 was 2·89 (95 % CI 1·38, 13·41) times larger than the simulated caseload for programmes admitting using MUAC < 115 mm or WHZ < −3. The simulated caseload for programmes admitting using MUAC < 115 mm only was 92 (95 % CI 50, 169) cases per 17 000 population. The simulated caseload for programmes admitting using MUAC < 125 mm only was 488 (95 % CI 300, 885) per 17 000 population. The simulated caseload for programmes using MUAC < 125 mm only was 5·30 (95 % CI 2·79, 25·54) times larger than the simulated caseload for programmes admitting using MUAC < 115 mm only.
Table 6 Results of the simple ‘what-if?’ simulations of the effect of changing case definitions on programme caseloads

* Parameter values and results are presented as fuzzy triangular numbers.
† Cases additional to those found using the MUAC < 115 mm case definition.
Discussion
The analysis presented here found that MUAC and WAZ were independently associated with death within 6 months of measurement. A previous multivariate (i.e. logistic regression) analysis of community-based cohort data from Bangladesh also reported that WHZ did not help identify high-risk children when MUAC was already in the model( Reference Alam, Wojtyniak and Rahaman 40 ).
A combination of MUAC and WAZ was able to detect all near-term deaths associated with severe anthropometric deficits including children who were simultaneously wasted and stunted (WaSt). This suggests that the MUAC admission criterion in therapeutic feeding programmes should be retained and that consideration should be given to replacing the current WHZ admission criterion with a WAZ admission criterion.
WHZ < −3·0 was part of the clinical definition of severe malnutrition used in the 1999 WHO manual for the management of severe malnutrition( 41 ). This was based on the understanding that it reflected recent severe weight loss( 41 ). MUAC was introduced a decade later because it is easy to use in the community and is better at identifying children with a high risk of death than WHZ( 20 , Reference Myatt, Khara and Collins 42 ). Using WHZ requires measurement of length or height. This is time-consuming, requires the presence of at least two health workers and requires length/height boards which are not available in many health facilities. Increasing the MUAC cut-off to 120 mm is likely to be more effective for identifying high-risk children than using the current combination of MUAC and WHZ( Reference Briend, Maire and Fontaine 43 ). If two anthropometric criteria are to be used to define severe undernutrition, it is not clear that WHZ in addition to MUAC is a good choice. Community-based cohort studies have repeatedly shown that WHZ is the least useful anthropometric criterion for identifying high-risk children and that WAZ performs significantly and consistently better at this task( Reference Myatt, Khara and Collins 42 – Reference Briend, Mwangome and Berkley 45 ). Recent analyses show that low WHZ is associated with a high risk of death only when it is also associated with stunting defined by low HAZ( Reference McDonald, Olofin and Flaxman 17 , Reference Myatt, Khara and Schoenbuchner 18 ). This is concurrent wasting and stunting (WaSt)( Reference Myatt, Khara and Schoenbuchner 18 ). Recent work on the descriptive epidemiology of multiple anthropometric deficits using data from almost 1·8 million children living in fifty-one countries reported that all children who were concurrently wasted and stunted were also underweight, the maximum possible WAZ for children with WaSt was below −2·35 when the WHO growth standards are used, and cases of WaSt can be detected with excellent sensitivity and specificity using WAZ( Reference Myatt, Khara and Schoenbuchner 18 ). This, together with the difficulty of providing good spatial and temporal coverage of the height measurements required for calculating HAZ and WHZ, means that WAZ may be used as a practicable indicator of WaSt. WAZ is easier to measure than WHZ because it does not require height or length to be measured. It does, however, lack the simplicity and low cost of MUAC. Any anthropometric indicator that includes an age component, such as WAZ, requires that age be ascertained accurately( Reference Bairagi 46 ). This is unlikely to be problem in GM/GMP programmes. Lack of simplicity, relatively high cost and the need to ascertain age accurately are likely to impair the utility of WAZ for detecting cases in the community( Reference Myatt, Khara and Collins 42 ). Depending on the thresholds used, MUAC has higher attributable risks than WAZ( Reference Garenne, Maire and Fontaine 21 ). This means that WAZ may be of most value when it is already being measured in (e.g.) GM/GMP programmes. Linkages between GM/GMP programmes and therapeutic feeding programmes could be forged and children with MUAC < 115 mm or WAZ < −2·8 referred to therapeutic feeding programmes from GM/GMP programmes (see Fig. 4).
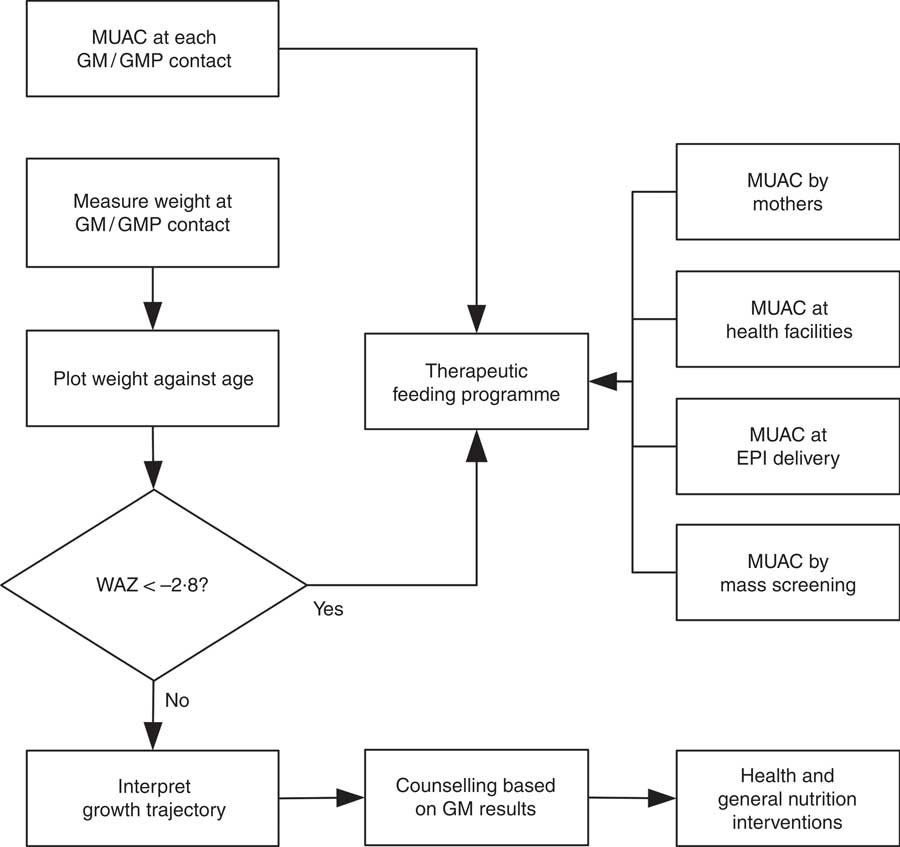
Fig. 4 Delivery model of a programme linking GM/GMP and therapeutic feeding programmes enabling the use of MUAC and WAZ admission criteria in therapeutic feeding programmes (GM, growth monitoring; GMP, growth monitoring and promotion; MUAC, mid-upper arm circumference; WAZ, weight-for-age Z-score; EPI, expanded programme of immunisation)
Increases in caseload may not translate into similar increases in workload or costs if the additional cases identified by WAZ require lower-intensity treatment (e.g. smaller quantities of therapeutic feeding products and reduced frequency of contact) than cases identified by MUAC. A similar approach is used in programmes integrating treatment of both severe and moderate acute malnutrition( Reference Maust, Koroma and Abla 28 ). Examination of mortality risks (Fig. 3) suggests that a low-intensity treatment may be appropriate for cases identified using WAZ. Simulation of caseloads for various scenarios (Table 6) suggests that the increase in caseload associated with replacing WHZ with WAZ is unlikely to be larger than that associated with moving from MUAC < 115 mm to MUAC < 125 mm which has proved to be manageable( Reference Maust, Koroma and Abla 28 ).
Current programme designs tend to focus on either acute malnutrition (wasting) or chronic malnutrition (stunting). The distinction between acute and chronic malnutrition appears arbitrary( Reference Shoham, Dolan and Gostelow 4 – Reference Christian, Lee and Donahue Angel 11 ). An extensive literature review found no risk factor for wasting that was not also associated with stunting( Reference Martorell and Young 10 ). Being wasted is a risk factor for being stunted and vice versa( Reference Myatt, Khara and Schoenbuchner 18 ). The analysis presented here avoids the distinction between acute and chronic malnutrition and, following earlier work on admission criteria for CMAM programmes, focuses on near-term mortality risk associated with one or more anthropometric deficits( Reference Myatt, Khara and Collins 42 ). Programmes admitting using MUAC and WAZ, both of which are associated with wasting and stunting, would treat children with anthropometric deficits associated with near-term mortality rather than just ‘acute malnutrition’.
Further work is required before the findings of the work reported here can be applied. This includes:
1. Repeating the current analysis using data from community-based cohort studies of untreated children from different contexts. This could further inform the selection of a usefully sensitive and specific (i.e. with regard to mortality) case defining WAZ threshold.
2. Ascertaining the intensity and duration of treatment required to treat children identified using WAZ as well as appropriate discharge criteria.
3. Operational research on linking GM/GMP and therapeutic feeding programmes.
The last two issues may be best addressed by small-scale (i.e. single health district) field studies. Such studies would also allow additional key programme planning data such as cost-effectiveness (e.g. cost per cure, cost per life saved, cost per disability-adjusted life year averted) and caseloads to be collected.
Limitations
The analysis reported here uses data from a single study in a single location. Repeating the current analysis using data from community-based cohort studies of untreated children from different contexts would provide more compelling evidence. Nine additional cohort studies of similar design to the Niakhar study from Bangladesh, Ghana, Guinea Bissau, India, Indonesia, Nepal, Peru, Philippines and Sudan with archived data have been identified and efforts are underway to secure access to these data( Reference McDonald, Olofin and Flaxman 17 , Reference Olofin, McDonald and Ezzati 19 , Reference Arifeen, Black and Antelman 47 – Reference Fawzi, Herrera and Spiegelman 53 ). The caseload simulations are crude, and results should be treated as broadly indicative of the magnitude and direction of the effect of changing case definitions on programme caseloads.
Conclusions
Therapeutic feeding programmes concerned with lowering the risk of near-term mortality may achieve higher impact if a combination of MUAC and WAZ admission criteria are used. More work is required before this can be considered as a general recommendation.
Acknowledgements
Acknowledgements: The authors thank Benard Maire and Olivier Fontaine for their contributions during the initial data collection and earlier analyses of the Niakhar cohort data. Financial support: The original Niakhar study was funded by the European Union, DG-XII (grant number TDR-36). The work reported here was funded by the US Agency for International Development (USAID) (grant number ENN AID-OFDA-G-15-00190) and Irish Aid. The contents of this paper are the responsibility of the authors and do not necessarily reflect the views of USAID or the US Government, nor those of Irish Aid or the Irish Government. The funders had no role in study design; collection, analysis and interpretation of data; the decision to publish; or preparation of the manuscript. Conflict of interest: The authors declare that they have no conflicts of interest. Authorship: The study was conceived and designed by A.B., C.D., M.G., M.M. and T.K. M.G. was the principal investigator of the original Niakhar study and supported the work by contributing data, advising on the analysis of the data and drafting of this article. The data were analysed by M.M. with input from A.B., M.G. and T.K. M.M. and T.K. wrote the first draft of the manuscript and are responsible for the final content. All authors contributed to the article and read and approved the final manuscript. Ethics of human subject participation: The Niakhar study was conducted with the approval of the Ministry of Health of Senegal.


 Open access