Intake of vegetables is associated with reduced risk of such chronic diseases and conditions as cancer( Reference Turati, Rossi and Pelucchi 1 – Reference Aune, Giovannucci and Boffetta 4 ), diabetes( Reference von Ruesten, Feller and Bergmann 5 ), CVD( Reference Aune, Giovannucci and Boffetta 4 , Reference von Ruesten, Feller and Bergmann 5 ), hypertension( Reference Chan, Stamler and Brown 6 ) and stroke( Reference Oude Griep, Verschuren and Kromhout 7 ). There is some evidence that inverse associations with these conditions are stronger for raw vegetables than for their cooked counterparts( Reference Turati, Rossi and Pelucchi 1 , Reference Link and Potter 2 , Reference von Ruesten, Feller and Bergmann 5 , Reference Oude Griep, Verschuren and Kromhout 7 ). These benefits and others may be related to the fact that vegetables are a source of many nutrients that tend to be low in the typical American diet, including dietary fibre, vitamins A (present in vegetables as provitamin A carotenoids), C and E, choline, Mg and K. Vegetables are also a rich source of polyphenolic compounds (e.g. flavonoids) with demonstrated antioxidant and anti-inflammatory activity( Reference Liu 8 ).
For more than a century, the US Department of Agriculture (USDA) has published various food guides instructing consumers about choosing foods from specified food groups, including vegetables, in order to optimise nutrient intakes( Reference Davis and Saltos 9 ). Since the 1980s, US Federal dietary guidance has been conveyed to the public through the Dietary Guidelines for Americans (DGA), published jointly by the USDA and the US Department of Health and Human Services every 5 years. The most recent version, the DGA 2015–2020, includes USDA Food Patterns specifying the number of servings of vegetables and other food groups that individuals should consume based on their age, sex and activity level( 10 ). Because different types of vegetables contain different nutrients, the Food Patterns promote variety by including recommendations for five vegetable subgroups: dark green, red and orange, legumes, starchy and ‘other’ vegetables (i.e. vegetables not included in the other subgroups).
Although vegetable intake is emphasised in the DGA and other nationwide programmes promoting good nutrition( 11 – 17 ), most individuals in the USA consume far less than recommended. Mean usual intake of total vegetables by men in 2007–2010 was 1·8 cup equivalents, whereas their recommended levels ranged from 2·5 to 4 cup equivalents( 10 , 18 ). For women, mean usual total vegetables intake was 1·6 cup equivalents, and their range of recommended levels was 2 to 3 cup equivalents. Only 11 % of men and 13 % of women had intakes meeting their total vegetables recommendation. There was some variation by age and sex, but the highest percentage of adults meeting their total vegetables recommendation was only 33 % (among women aged 51–70 years). The percentage of adults meeting recommendations for the vegetable subgroups is also poor, although somewhat less extreme for ‘other’ vegetables than for the other subgroups. Workable strategies are needed to address this disconnect between intake and recommendations.
Inclusion of vegetable dishes, such as salads, in most meals and snacks is one of the consumer strategies proposed in the DGA with a view to boosting vegetable consumption( 10 ). Since salads often contain multiple vegetables, it has been assumed that incorporating them into one’s diet would improve not only total vegetable intake but also intakes of various vegetable subgroups. However, whether or not this is true remains untested. The sparse literature about nationwide salad consumption by US adults is either dated and limited to a restricted age range of the adult population( Reference Su and Arab 19 ) or confined to descriptive estimates( Reference Sebastian, Wilkinson Enns and Goldman 20 ). No study to date has analysed whether salad consumption is associated with higher likelihood of meeting US national eating pattern recommendations.
It is possible that in actual practice salad might be consumed in place of other vegetable dishes, which would yield no net improvement in vegetable intake or the percentage of the population meeting vegetable recommendations. A thorough evaluation of the implications of this strategy with regard to total dietary intake and DGA adherence is warranted.
Thus, the objective of the present study was to determine if salad consumption is associated with higher vegetable intake and greater adherence to recommendations outlined in the DGA 2015–2020. Specifically, the study analysed whether intakes of USDA Food Pattern components and adherence to Healthy US-Style Eating Pattern recommendations differed between those who reported a salad on the intake day (reporters) and those who did not (non-reporters) in a nationally representative sample of US adults.
Methods
Sample
Data used in the present study were collected between 2011 and 2014 in What We Eat in America (WWEIA), the dietary intake component of the National Health and Nutrition Examination Survey (NHANES)( 21 ). The NHANES sample was designed to be representative of the civilian, non-institutionalised US population( Reference Johnson, Dohrmann and Burt 22 ). A complex, multistage, area probability sample design was used to select persons within households.
The examination response rate among adults aged ≥20 years was 64·5 % in 2011–2012 and 63·7 % in 2013–2014( 23 ). A total of 9848 adults aged ≥20 years (90·3 % of examined survey participants in this age group) provided one day of complete dietary intake data. Pregnant and lactating women (n 170) were excluded, yielding a final analytic sample of 9678 adults (4808 males and 4870 females).
Identification of salads
WWEIA day 1 dietary data were collected in person by trained interviewers fluent in English and Spanish using the USDA Automated Multiple-Pass Method for the 24 h recall. This method is a five-step multiple-pass approach designed to enhance complete and accurate food recall and reduce respondent burden( Reference Raper, Perloff and Ingwersen 24 , Reference Moshfegh, Rhodes and Baer 25 ). WWEIA 2011–2012 and WWEIA 2013–2014 dietary intake data files, documentation and related survey materials are available online( 26 , 27 ).
Unlike some food terms whose definitions are uncontroversial (e.g. apple, potato, oatmeal), the term ‘salad’ has no single, universally accepted meaning. On the contrary, common foods with the word ‘salad’ in their name are exceedingly diverse in their ingredients and methods of preparation, such as garden salad, Caesar salad, taco salad, cabbage salad (coleslaw), chicken salad, tuna salad, macaroni/pasta salad, fruit salad and potato salad.
For the purposes of the present study, a salad was considered to be composed primarily of raw vegetables. Foods that are botanically fruits yet are treated as vegetables in culinary usage were considered vegetables, including tomatoes, cucumbers and avocados. The following were considered salads:
1. raw lettuce or other leafy greens consumed with one or more other raw vegetables and/or with one or more common non-vegetable salad ingredients (such as dressing, croutons or sunflower seeds);
2. a mixture of two or more raw vegetables other than lettuce/greens (with or without dressing);
3. a single raw vegetable other than lettuce/greens with dressing; and
4. raw lettuce/greens consumed alone.
Thus, foods that had ‘salad’ in their name but did not have raw vegetables as their predominant ingredient(s) were excluded. Also, raw lettuce/greens consumed as part of a sandwich or in a mixed food that did not meet any of the preceding criteria was excluded.
As evident from the inclusion criteria, no specific ingredient was required to satisfy the salad definition. However, the majority of salads (78 %) consumed by adults in 2011–2014 contained lettuce or another leafy green, and a similarly high percentage (86 %) included a dressing.
All foods and beverages reported in WWEIA are coded using one or more USDA food codes for the purpose of assigning a nutrient profile. Although there are a number of food codes that represent raw vegetable-based salads, only a small percentage of the salads reported in 2011–2014 were coded with a single food code. Most salads reported (87 %) were coded using several food codes. For example, six food codes were used in coding a salad containing lettuce, cabbage, carrots, chicken, black beans and honey mustard dressing. In the dietary data files, foods that have been coded using more than one food code can be identified through the presence of linking variables( 28 , 29 ).
Individuals who ate any amount of an item classified as salad on the intake day were considered to be salad ‘reporters’, whereas individuals who did not eat any salad were considered ‘non-reporters’.
Assignment of food group recommendations
The USDA Food Patterns are three distinct eating patterns from which consumers can choose: Healthy US-Style, Healthy Mediterranean-Style and Healthy Vegetarian. For each of twelve energy levels, each pattern specifies recommended amounts to consume from five food groups (vegetables, fruits, grains, dairy, protein foods), their subgroups and oils( 10 ). None of the recommendations for total vegetables or any of the vegetable subgroups differ between the US-Style and Mediterranean-Style eating patterns. Recommended amounts of the vegetable subgroup legumes (beans and peas) are considerably higher in the Vegetarian pattern than in the US-Style pattern. Since earlier research has shown that few adults meet even the lower recommendations for legumes( 18 ), the present study assessed adherence only to the US-Style pattern.
The Food Patterns also set limits on intake of ‘calories for other uses’, which are derived from added sugars, added refined starches, solid fats, alcohol and amounts of food consumed from any food group that exceed the recommendation for that group( 10 ). The Food Patterns are based on foods in their most nutrient-dense forms, i.e. lean or low-fat and prepared without added fats or sugars. When foods consumed are not in the most nutrient-dense form, the resulting excess energy is tallied as ‘calories for other uses’. For example, plain non-fat yoghurt is more nutrient-dense than fruit-flavoured whole milk yogurt. Energy from the solid fats and added sugars in the latter product is counted as ‘calories for other uses’. In addition to the overall limits on ‘calories for other uses’, the DGA include recommendations to limit added sugars and solid fats each to less than 10 % of energy and alcohol to ≤1 drink/d for women and ≤2 drinks/d for men.
In order to evaluate adherence to DGA recommendations, the foods in the WWEIA intake data files are converted into the amounts of Food Pattern components present in them by applying values from the USDA Food Patterns Equivalents Database (FPED)( 30 – Reference Bowman, Clemens and Friday 32 ). Data files containing total aggregate daily amounts of Food Pattern components consumed by each respondent in WWEIA, NHANES 2011–2012 and 2013–2014 are available online, as are the corresponding versions of the FPED( 33 ).
The FPED provides values for thirty-seven components included in the USDA Food Patterns. Although the FPED does not contain a variable for ‘calories for other uses’ overall, it does contain added sugars (teaspoons), solid fats (grams) and alcoholic drinks (number). FPED amounts of added sugars and solid fats were converted to calories (i.e. kilocalories; 1 kcal=4·184 kJ) as follows: added sugars in teaspoons was multiplied by 4·2 g/teaspoon and then by 4 kcal/g; solid fats in grams was multiplied by 9 kcal/g.
Each individual’s USDA Food Pattern energy level and corresponding food group recommendations are determined based on sex, age and activity level( 10 ). In the present study, activity level was estimated using NHANES Physical Activity Questionnaire data( 34 , 35 ). Minutes of physical activity per week were based on the respondent’s estimate of time spent in work, recreational and transport-related activity in a typical week. Minutes spent in ‘vigorous’ activity were multiplied by 2( 36 ). Individuals whose total activity summed to less than 150 min/week were considered sedentary; 150–299 min/week, moderately active; and ≥300 min/week, active.
Among men, the summative total of self-reported time spent in work, recreational and transport-related physical activity resulted in 29 % being classified as sedentary, 9 % as moderately active and 61 % as active. Consequently, the energy levels assigned to men in the present study were the following: 2000 kcal (8368 kJ; 10 % of men), 2200 kcal (9205 kJ; 13 %), 2400 kcal (10 042 kJ; 13 %), 2600 kcal (10 878 kJ; 17 %), 2800 kcal (11 715 kJ; 24 %) and 3000 kcal (12 552 kJ; 23 %). Among women, 44 % were classified as sedentary, 12 % as moderately active and 45 % as active, and the energy levels assigned were 1600 kcal (6694 kJ; 24 % of women), 1800 kcal (7531 kJ; 22 %), 2000 kcal (8368 kJ; 18 %), 2200 kcal (9205 kJ; 26 %) and 2400 kcal (10 042 kJ; 11 %).
Statistical analysis
Analyses were performed using the statistical software package SAS®-callable SUDAAN®, release 11·0 (2012; RTI International, Research Triangle Park, NC, USA). SUDAAN increases the validity of inferred results, as the variance estimates generated are corrected to account for the multistage stratified cluster probability design of the NHANES survey( 37 , 38 ). Survey weights designed to account for unequal probability of selection, non-coverage and non-response were applied in all analyses to produce estimates representative of the US population.
Descriptive analyses utilizing χ 2 goodness-of-fit tests were conducted to determine whether the distribution of salad reporting status differed by demographic, anthropometric and lifestyle characteristics.
Linear regression analyses were conducted to provide mean intake estimates of Food Pattern components by salad reporting status. Characteristics included as adjustment variables in these analyses were sex, race/ethnicity (non-Hispanic White, non-Hispanic Black, non-Hispanic Asian, Hispanic, other race), age, income status (as poverty income ratio or PIR, which is the ratio of family income to poverty expressed as a percentage( 39 )) and smoking status (never, former, current). t tests were conducted to identify significant differences in intake between salad reporters and non-reporters for each food component in the Healthy US-Style Eating Pattern.
Logistic regression was used to estimate the percentage of adults with intakes meeting their Healthy US-Style Eating Pattern recommendations and to determine the likelihood of salad reporters meeting each recommendation relative to non-reporters, with adjustment for the same variables as in the linear regression analyses. These model-adjusted prevalence estimates and risk ratios were calculated using the average marginal prediction approach described by Graubard and Korn( Reference Graubard and Korn 40 ) and Bieler et al.( Reference Bieler, Brown and Williams 41 ). This approach is designed to permit unbiassed comparisons of risk between population subgroups after controlling for differences in their covariate distributions. Since the Food Pattern recommendations for vegetable and protein food subgroups are specified on a weekly rather than a daily basis, one-seventh of an individual’s recommendation was used as the criterion for meeting that recommendation.
Since earlier research indicated that salad reporting status differed significantly by sex( Reference Sebastian, Wilkinson Enns and Goldman 20 ), analyses comparing food component intakes and percentages meeting each Food Pattern recommendation were conducted for all adults collectively and for men and women separately.
A level of P<0·001 was applied in all analyses to determine statistical significance.
Results
Salad reporting status by characteristics
On the intake day, 23 % of adults ate salad (Table 1). Among salad reporters, the majority (89 %) consumed only one item classified as salad, whereas 11 % ate more than one such item (data not shown).
Table 1 Salad reporting status by selected characteristics; US adults (n 9678) aged ≥20 years, What We Eat in America, National Health and Nutrition Examination Survey 2011–2014

* Within each characteristic, counts do not necessarily sum to the count of all individuals due to missing data.
† The χ 2 test was used to identify relationships between salad reporting and characteristics.
‡ Excludes pregnant and lactating females.
§ Includes both individuals who were of races other than those listed and those who were multiracial.
║ PIR (poverty income ratio) is the ratio of family income to poverty, expressed as a percentage(39).
¶ Educational level equals highest level of school completed. ‘High school graduate’ includes general equivalency diploma (GED) or equivalent.
** National Institutes of Health/National Heart, Lung, and Blood Institute cut-offs used in assessing risk for type 2 diabetes, hypertension and CVD are 102 cm for men and 88 cm for women( 55 ).
†† Includes all physical activity, regardless of purpose (recreation, in the performance of work or as a means of transportation), with each vigorous-intensity minute counted as the equivalent of 2 moderate-intensity minutes(36).
‡‡ Participants who reported smoking <100 cigarettes in their lives were classified as ‘never smokers’, those who had smoked ≥100 cigarettes but did not smoke at all at the time of the survey were classified as ‘former smokers’, and those who smoked cigarettes every day or some days at the time of the survey were classified as ‘current smokers’.
The percentage of individuals reporting salad varied by all of the demographic and most of the lifestyle characteristics studied (P<0·001; Table 1). Reporting salad appeared to be more common among women, those aged 40 years or over, non-Hispanic Whites, higher-income individuals, those with education beyond high school, and never and former smokers. In contrast, the percentage of individuals reporting salad did not vary by BMI, waist circumference or minutes of physical activity per week.
Contribution of salad to reporters’ vegetable intakes
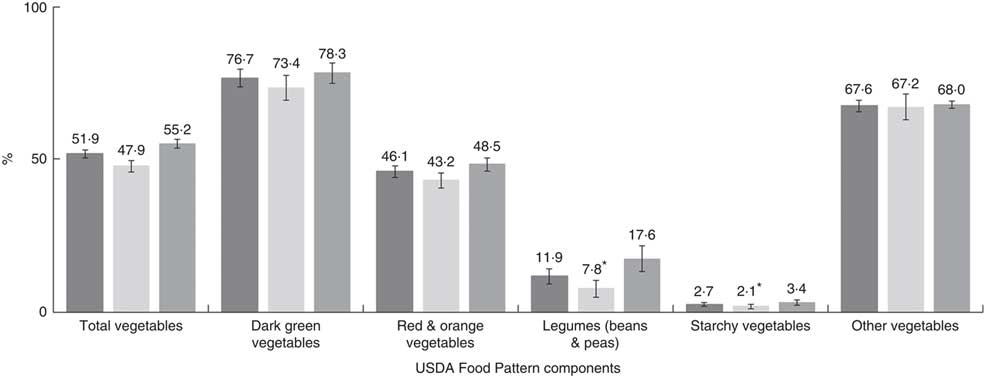
Salads’ contributions to overall intakes of vegetable components among those who reported salad on the intake day are shown in Fig. 1. Among male and female salad reporters analysed together, salad made substantial contributions to intakes of total (51·9 %), dark green (76·7 %), red and orange (46·1 %) and ‘other’ vegetables (67·6 %), and much smaller contributions to their intakes of legumes (11·9 %) and starchy vegetables (2·7 %). Contributions by salad to intakes of these food groups did not differ by sex (P>0·001).

Fig. 1 Contributions by salads to salad reporters’ total daily intakes of US Department of Agriculture (USDA) Food Pattern vegetable components, overall and by sex (![]() , males and females†;
, males and females†; ![]() , males;
, males; ![]() , females†); US adults (n 9678) aged ≥20 years, What We Eat in America, National Health and Nutrition Examination Survey 2011–2014. Values are means, with their standard errors represented by vertical bars. *Estimate is less precise than others due to small sample size and/or relatively large standard error. †Excludes pregnant and lactating females
, females†); US adults (n 9678) aged ≥20 years, What We Eat in America, National Health and Nutrition Examination Survey 2011–2014. Values are means, with their standard errors represented by vertical bars. *Estimate is less precise than others due to small sample size and/or relatively large standard error. †Excludes pregnant and lactating females
Food Pattern component intakes
Intakes of USDA Food Pattern components in the Healthy US-Style Eating Pattern are shown in Table 2. Among all adults (i.e. males and females analysed together), salad reporters had significantly higher intakes of total, dark green, red and orange, and ‘other’ vegetables than did non-reporters (P<0·001). The mean intake of total vegetables by salad reporters (2·64 cup equivalents) was 86 % higher than that of non-reporters (1·42 cup equivalents). Similarly, salad reporters had considerably higher intakes of dark green (+280 %), red and orange (+79 %) and ‘other’ vegetables (+167 %) than did non-reporters. Intakes of legumes (beans and peas) and starchy vegetables did not differ by salad reporting status.
Table 2 IntakesFootnote * of US Department of Agriculture (USDA) Food Pattern components specified in the Healthy US-Style Eating PatternFootnote †, by salad reporting status, overall and by sex; US adults (n 9678) aged ≥20 years, What We Eat in America, National Health and Nutrition Examination Survey 2011–2014

c-eq., cup equivalents; oz-eq., ounce equivalents; tsp-eq., teaspoon equivalents.
* Estimates adjusted for sex (as applicable), race/ethnicity, age, income category and smoking status. Age was entered as a continuous variable.
† USDA Food Patterns, including the Healthy US-Style Eating Pattern, are described in Appendix 3 of the Dietary Guidelines for Americans 2015–2020( 10 ).
‡ Excludes pregnant and lactating females.
§ Legumes (beans and peas) may be counted as either vegetables or protein foods. In this analysis, they are counted as vegetables.
║ Excludes cooked soyabeans and edamame, which are included in the legumes (beans and peas) component, and soya milk, which is included in dairy.
¶ Within sex, adjusted estimate of food component total intake by salad reporters differs significantly from that of non-reporters (P<0·001).
Intakes from several non-vegetable Food Pattern components also differed significantly between salad reporters and non-reporters. Salad reporters had lower intakes of total grains and refined grains than did non-reporters. Intakes of total protein foods and seafood were higher among salad reporters than non-reporters, although it should be noted that seafood intake was low regardless of salad reporting status. Salad reporters also had a higher intake of oils than did non-reporters (34·6 v. 24·4 g). Whereas intakes of solid fats (in grams) and added sugars (in teaspoon equivalents) did not differ between salad reporters and non-reporters, the percentages of total energy intake that were attributable to these components were significantly lower among salad reporters than non-reporters. Intake of the following USDA Food Pattern components did not differ by salad reporting status: fruits; total grains; whole grains; dairy; meats, poultry, eggs; nuts, seeds, soya products; and alcoholic drinks.
For men and women analysed separately, the pattern of significant differences mostly reflected that seen for all adults. However, no significant differences by salad reporting status were seen for either sex in intake of total grains and the percentage of total energy intake from added sugars; for men in intakes of total protein foods and seafood; and for women in intake of refined grains.
Adherence to Healthy US-Style Eating Pattern recommendations
As shown in Table 3, among all adults, the percentage of individuals meeting their total vegetable recommendation was very low, regardless of salad reporting status. Among salad non-reporters, the prevalence of meeting recommendations was less than 25 % for all vegetable subgroups. Even among salad reporters, the percentage meeting recommendations exceeded 40 % for only one vegetable subgroup: ‘other’ vegetables (63·9 %). Yet, in terms of risk ratios (RR), salad reporters were about three or more times as likely as non-reporters to meet their recommendations for total vegetables (RR=3·32; 99·9 % CI 2·54, 4·33), dark green vegetables (RR=3·35; 99·9 % CI 2·70, 4·16) and ‘other’ vegetables (RR=2·97; 99·9 % CI 2·54, 3·47), and about twice as likely to meet their recommendation for red and orange vegetables (RR=2·17; 99·9 % CI 1·69, 2·79).
Table 3 Healthy US-Style Eating PatternFootnote * recommendations: percentage of individuals meetingFootnote † by salad reporting status and likelihood of meeting among salad reporters; US adultsFootnote ‡ (n 9678) aged ≥20 years, What We Eat in America, National Health and Nutrition Examination Survey 2011–2014

RR, risk ratio.
* USDA Food Patterns, including the Healthy US-Style Eating Pattern, are described in Appendix 3 of the Dietary Guidelines for Americans 2015–2020( 10 ).
† Each individual’s recommended energy level and corresponding recommended intakes were assigned based on sex, age and self-reported physical activity level. For most components, ‘meeting’ means consuming at least the recommended amount. However, for refined grains, solid fats, added sugars and alcoholic drinks, ‘meeting’ means not exceeding the recommended limit.
‡ Excludes pregnant and lactating females.
§ Salad non-reporters are the referent group (RR=1·00). RR were obtained from average marginal predictions (adjusted prevalence estimates) in the fitted logistic model(40,41). Prevalence estimates were adjusted for sex, age, race/ethnicity, income category and smoking status. Age was entered as a continuous variable.
║ Legumes (beans and peas) may be counted as either vegetables or protein foods. In this analysis, they are counted as vegetables.
¶ The Dietary Guidelines for Americans 2015–2020 recommend that at least half of total grains intake should be whole grains( 10 ).
** Excludes cooked soyabeans and edamame, which are included in the legumes (beans and peas) component, and soya milk, which is included in dairy.
Salad reporting status was also associated with the likelihood of meeting a few non-vegetable recommendations. Relative to non-reporters, salad reporters were more likely to meet their limit on intake of refined grains (RR=1·24; 99·9 % CI 1·08, 1·43). Although extremely low percentages of both salad non-reporters and reporters (5 % of each) met their recommendations for whole grains, reporters were more likely to consume at least half their grains as whole grains (RR=1·52; 99·9 % CI 1·12, 2·07). Salad reporters were also significantly more likely to meet their recommendations for total protein foods (RR=1·19; 99·9 % CI 1·07, 1·32), seafood (RR=1·53; 99·9 % CI 1·21, 1·93) and oils (RR=1·69; 99·9 % CI 1·45, 1·97) than were salad non-reporters.
Findings by sex were nearly identical to those for the adult population as a whole (Table 4) for both vegetable and non-vegetable Food Pattern components. The only ways in which findings by sex did not mirror those for all adults together were that no differences in adherence to recommendations by salad reporting status were found among women for refined grains or among men for consuming half of all grains as whole grains or for total protein foods.
Table 4 Healthy US-Style Eating PatternFootnote * recommendations: percentage of individuals meetingFootnote † by salad reporting status and likelihood of meeting among salad reporters, by sex; US adults (n 9678) aged ≥20 years, What We Eat in America, National Health and Nutrition Examination Survey 2011–2014

RR, risk ratio.
* USDA Food Patterns, including the Healthy US-Style Eating Pattern, are described in Appendix 3 of the Dietary Guidelines for Americans 2015–2020(10).
† Each individual’s recommended energy level and corresponding recommended intakes were assigned based on sex, age and self-reported physical activity level. For most components, ‘meeting’ means consuming at least the recommended amount. However, for refined grains, solid fats, added sugars and alcoholic drinks, ‘meeting’ means not exceeding the recommended limit.
‡ Excludes pregnant and lactating females.
§ Salad non-reporters are the referent group (RR=1·00). RR were obtained from average marginal predictions (adjusted prevalence estimates) in the fitted logistic model( Reference Graubard and Korn 40 , Reference Bieler, Brown and Williams 41 ). Prevalence estimates were adjusted for age, race/ethnicity, income category and smoking status. Age was entered as a continuous variable.
║ Legumes (beans and peas) may be counted as either vegetables or protein foods. In this analysis, they are counted as vegetables.
¶ The Dietary Guidelines for Americans 2015–2020 recommend that at least half of total grains intake should be whole grains( 10 ).
** Excludes cooked soyabeans and edamame, which are included in the legumes (beans and peas) component, and soya milk, which is included in dairy.
Discussion
The DGA recommend that consumers incorporate vegetable dishes such as salads into more meals and snacks in order to boost daily intake of vegetables( 10 ). The present study is the first to confirm that, among adults in the USA, heeding this guidance is associated with greater adherence to national dietary recommendations.
In this large, nationally representative sample of US adults, salad reporters’ higher intakes of total, dark green, red and orange, and ‘other’ vegetables translated into a two- to threefold greater likelihood of meeting the Healthy US-Style Eating Pattern recommendations for these Food Pattern components. More modest associations were seen between salad reporting and differences in intake and likelihood of meeting recommendations for other Food Pattern components. Salad reporters had higher intakes of and likelihood of meeting recommendations for protein foods, seafood and oils. They were also more likely to consume half their grains as whole grains, although this seems to have been mainly through being more likely to stay within their limit on refined grains rather than through consuming more whole grains. For the most part, findings when analysed by sex reflected those for the adult population as a whole.
Some of the observed differences, such as those for vegetables and oils, seem likely to be directly attributable to salad consumption. For example, it is noteworthy that salad’s contribution to the total vegetables intake of salad reporters accounts for the difference in intake of total vegetables between salad reporters and non-reporters. The same pattern was seen for dark green, red and orange, and ‘other’ vegetables. This pattern suggests that those who eat salads are not consuming them in place of other vegetable dishes but rather in addition to them, in harmony with intent of the DGA suggestion. Salad reporters’ higher intake of and greater adherence to recommendations for oils also seem directly attributable to salad consumption, since most salads are consumed with salad dressing. The vast majority of salad dressings reported in 2011–2014 contained some fat. Post hoc analyses showed that salads contributed 36·0 % of salad reporters’ overall intake of oils, an amount that more than accounted for the difference in intake of oils between salad reporters and non-reporters.
It is possible that the observed differences for protein foods might also be attributable in some degree to salad ingredients. Previous research showed that 19 % of salads consumed by individuals of all ages contained some meat, poultry or fish, and that, in salads containing those ingredients, they were present in an average amount of about 2·4 oz (60 g)( Reference Sebastian, Wilkinson Enns and Goldman 20 ).
Potential explanations for some other observed differences are more complicated and may have more to do with healthier food choices overall by salad reporters than with salad consumption per se. It is unlikely that salad reporters’ lower intake of refined grains and higher prevalence of staying within the recommended limit on refined grains are due directly to salad consumption. Possibly linked to these findings is the fact that salad reporters obtained slightly lower percentages of their total energy intake from solid fats and added sugars, although no difference by salad reporting status was found in intake of either solid fat (in grams) or added sugars (in teaspoon equivalents) or in the likelihood of meeting the recommendation that each of those components provide less than 10 % of total energy. Support for the idea that the findings for refined grains, solid fats and added sugars may be related is provided by the Dietary Guidelines Advisory Committee’s finding that the food categories that accounted for over 90 % of refined grains intake also accounted for 47 % of saturated fats and 28 % of added sugars( 42 ) (p. 45).
While much research has focused on intake of vegetables in general (and even more on fruits and vegetables in the aggregate), little research has analysed salads specifically. One notable exception is the study conducted by Su and Arab( Reference Su and Arab 19 ), which used NHANES III dietary data collected in 1988–1994. In that study, salad consumption was defined in three different ways. Using the broadest of those definitions (‘garden salad or raw vegetable consumption on the day of the assessment’), which was the closest to that of the present study, the authors found that 30–35 % of adults in four sex–age groups consumed salad. The higher prevalence of salad consumption in that study may be due to the inclusion of some raw vegetables consumed alone that would have been excluded from the present study. Conversely, Su and Arab’s finding regarding the use of salad dressing (<10 % of salads) was much lower than ours (83 %). However, those authors recognised the implausibility of that finding, and it led them to question the validity of the salad dressing data in NHANES III. One reason for our higher estimate may be the presence of detailed questions about salad ingredients, including specific probes concerning the consumption of dressing on salads, in the USDA Automated Multiple-Pass Method used in collecting WWEIA, NHANES data. Therefore, in addition to being more timely, it is likely that our study provides a more accurate estimate of the prevalence of dressing being consumed on salad.
Concomitant with its associations with improved adherence to national recommendations, salad consumption has also been shown to be associated with biomarkers of nutritional status. Su and Arab( Reference Su and Arab 19 ) analysed associations between salad consumption and blood indicators of several nutrients and bioactive components. In that study, positive associations with level of salad consumption were found for both serum and red-blood-cell folate and for serum vitamins A (men only), C and E, α- and β-carotene, retinyl esters and lycopene. Such beneficial associations may be enhanced by the common co-consumption of salad dressing. Fats in salad dressing have been shown to aid in absorption of nutrients abundant in salad ingredients, including α-(43, Reference White, Zhou and Crane 44 ) and β-carotene(43, Reference White, Zhou and Crane 44 ), retinyl palmitate( Reference White, Zhou and Crane 44 ), lutein( Reference White, Zhou and Crane 44 ), lycopene(43, Reference White, Zhou and Crane 44 ), phylloquinone( Reference Brown, Ferruzzi and Nguyen 43 ), and α- and total tocopherol( Reference White, Zhou and Crane 44 ).
There are some limitations to the present study. First, salad reporting status was determined using only one day of dietary intake. It is unknown if those classified as salad reporters in the present study have usual intakes of food groups that differ from those of non-reporters. Evaluating adherence to recommendations for the vegetable and protein foods subgroups, which are in terms of servings per week, necessitated the unsubstantiated assumption that the daily intake is representative of the week as a whole. Second, possible overestimation of self-reported physical activity may have led to assignment of erroneously high energy levels and accompanying food group recommendations. Whereas approximately half of all adults in the present study reported ≥300 min of activity per week, Troiano et al.( Reference Troiano, Berrigan and Dodd 45 ) analysed physical activity measured by accelerometer and found that <5 % of US adults in 2003–2004 obtained an average of 30 min of physical activity per day. Assignment of a higher-than-appropriate energy level would have understated the percentage of adults meeting recommendations for components to be encouraged, including vegetables, but would have inflated the percentage meeting recommendations for components to be limited, such as refined grains. Since it is unknown if overestimation of self-reported physical activity differed between reporters and non-reporters, its effect on the association between salad reporting status and meeting recommendations cannot be determined.
It was not possible to assess the Food Pattern component ‘calories for other uses’, since its definition includes ‘added refined starches’ which are not included in FPED. However, the present study did evaluate the two major contributors to ‘calories for other uses’, namely solid fats and added sugars, which have their own specific recommendations (10 % of total energy intake from each). The total of those two recommendations (<20 % of total energy) exceeds the limit on ‘calories for other uses’ in all the energy levels assigned in the study, which ranges from 8 to 16 % of total energy. Thus, an individual’s intake could meet the recommended limits for both solid fats and added sugars yet still exceed the limit on ‘calories for other uses’, even without including other sources of this energy. Considering the low percentages of adults meeting their recommended limits for solid fats (33 % of salad reporters and 29 % of non-reporters) and added sugars (47 and 42 %, respectively), it is likely that the percentage of adults staying within their recommended limit on ‘calories for other uses’ is considerably lower.
It should be noted that it is not necessary for good health to eat salad or even raw vegetables. This is merely one strategy among many potential ways to increase the intake of vegetables overall. For some people, salad may be unavailable( Reference O’Malley 46 , Reference Laska, Borradaile and Tester 47 ), unaffordable( Reference Drewnowski and Rehm 48 , Reference Cassady, Jetter and Culp 49 ) or unchewable( Reference Brennan, Singh and Liu 50 , Reference Quandt, Chen and Bell 51 ). Other options, such as frozen and canned vegetables, are more affordable( Reference Drewnowski and Rehm 48 ) and are also rich in nutrients( Reference Drewnowski and Rehm 48 , Reference Bouzari, Holstege and Barrett 52 , Reference Freedman and Fulgoni 53 ). Moreover, cooking vegetables provides some protection against the risk of food-borne illness attributable to raw produce – 46 % of food-borne illnesses reported in the USA from 1998 to 2008( Reference Painter, Hoekstra and Ayers 54 ). Therefore, the findings presented here do not imply that one must consume salad in order to improve adherence to the DGA. In fact, the Dietary Guidelines Advisory Committee detailed a wide range of strategies that not only consumers themselves but also agriculture, the food industry, food-service and retail establishments, government and other aspects of the food system can employ to promote healthier intakes( 10 , 42 ).
Conclusions
Consuming salad is associated with higher intake of several components of the Healthy US-Style Eating Pattern, especially vegetables and oils, and consequently with greater adherence to the DGA recommendations outlined in that pattern. In addition, other beneficial shifts were seen, some likely due to the content of salads per se and others more likely due to a pattern of healthier food choices overall. Nevertheless, for most Food Pattern components, intakes and adherence to recommendations were low regardless of salad reporting status. Results of the present study confirm the DGA message that incorporating more salads into the diet is an effective strategy (among many possible strategies) to augment vegetable consumption and adherence to dietary recommendations concerning vegetables.
Acknowledgements
Financial support: This research received no specific grant from any funding agency in the public, commercial or not-for-profit sectors. Conflict of interest: None. Authorship: R.S.S. and M.K.H. formulated the research question; R.S.S. and C.W.E. designed the study; J.D.G., R.S.S. and M.K.H. prepared the data; J.D.G. conducted the statistical analyses; R.S.S. and C.W.E. prepared the manuscript; R.S.S. had final responsibility for its content; A.J.M. provided supervisory programmatic support. All authors read and approved the final manuscript. Ethics of human subject participation: Written informed consent was obtained from all participants. The survey protocol was approved by the US Department of Health and Human Services, Centers for Disease Control and Prevention, National Center for Health Statistics, Research Ethics Review Board. The current study was a secondary analysis and thus exempt from further review under Title 45 Code of Federal Regulations section 46.101(b).