


Ensuring that children eat a high-quality diet is a key component of public health programmes aiming to reduce childhood obesity( 1 ). National age-specific recommended levels of foods and nutrients are set by many countries in Europe( 2 , Reference Prentice, Branca and Decsi 3 ), the USA( 4 ) and Australia( 5 ). A nutritious diet contains foods such as fruits and vegetables, protein and dairy foods rich in micronutrients, and is low in fats, particularly saturated fat, added sugars and salt.
In England, nutrient- and food-based standards exist for school meals( 6 ). The food-based standards restrict use of fatty and fried foods, snacks and foods high in sugar including sweetened drinks/snacks, and encourage increased consumption of fruits and vegetables. In addition to food-based standards, there are a total of fourteen nutrient standards for school meals (thirteen nutrients plus energy); four have a maximum level (total fat, saturated fat, added sugars and Na) and nine have a minimum level (protein, carbohydrate, fibre, vitamin A, vitamin C, folate, Ca, Fe and Zn). The standard for energy has a tolerance of 5 % below and above the standard( 7 ). A move towards food- rather than nutrient-based standards resulted from The School Food Plan in January 2015; however, its impact on the quality of school food has not yet been fully evaluated( Reference Dimbleby and Vincent 8 ). Packed lunches are not required to meet these same standards but many schools follow government recommendations and have a food-based packed lunch policy in place to improve the quality of foods brought from home at lunchtime( 9 ).
Simple but effective methods to assess the quality of children’s meals, whether provided at school or brought from home, are required. Tools to assess overall dietary quality have been designed for both adults and children but not for specific mealtimes( Reference Marshall, Burrows and Collins 10 ). Measures of dietary quality in children include the Healthy Eating Index for Children and the Revised Diet Quality Index, both of which are from the USA and are based on daily food intakes( Reference Kranz and McCabe 11 ).
The European Commission has recently published a report on the thirty-four school food policies in thirty countries in Europe( 12 ); out of the total, thirty-one policies include food-based standards and twenty-three include nutrient-based standards( 12 ). Policies for packed lunches exist in some schools and consist of food-based recommendations by individual schools rather than legally binding regional standards. However, it is not known whether these recommendations are sufficient to ensure a high-quality lunch brought from home because research has been carried out on school meals( Reference Haroun, Wood and Harper 13 ) but not on packed lunches.
The aim of the present research was twofold: first, to analyse children’s lunches brought from home to identify the most important nutrients that predict a good-quality packed lunch compared with recommended and restricted foods; and second, to suggest a method to measure lunch quality that can be used to assess lunches brought from home. These results will enable schools to make simple and informed recommendations as part of a packed lunch policy that build on existing food-based guidelines.
Methods
Study design
Data were collected in 2006 from 1294 children attending eighty-nine primary schools randomly selected from all state schools across the four regions in the UK: England, Wales, Scotland and Northern Ireland. One class of children in Year 4 (aged 8–9 years) was randomly sampled from each primary school. The data analysed here are part of a cluster randomised controlled trial to improve packed lunches and further details on sampling procedures are provided in published papers( Reference Evans, Greenwood and Thomas 14 , Reference Evans, Greenwood and Thomas 15 ).
Dietary data were collected using a weighed dietary assessment tool designed to measure the food in children’s packed lunches. Individual foods were weighed whenever possible and entered under the following categories: drinks, sandwiches, savoury snacks, vegetables, fruit and sweet snacks. Sandwiches and mixed salads were weighed in their entirety and different parts of the sandwich were estimated based on reported average portion sizes( 16 ). Thirteen nutrients included in the nutrient standards for school meals in England (excluding energy as it has both a maximum and minimum standard) were calculated for each child’s lunch using Dante, a program designed in-house based on the sixth edition of McCance and Widdowson’s The Composition of Foods ( 17 ). These were total and saturated fat (g), carbohydrate (g), non-milk extrinsic sugars (g), protein (g), fibre (NSP; g), Ca (mg), Fe (mg), Zn (mg), folate (mg), vitamin A (µg), vitamin C (mg) and Na (mg). The presence or absence of eight specific food groups included in the food-based standards was also calculated by an experienced nutritionist, based on information provided by trained administrators. These include five healthy foods, namely protein-rich foods (cheese, meat, fish or legumes), low-fat carbohydrate foods (bread, rice or pasta), dairy-rich foods (cheese, yoghurt), fruits and vegetables; and three foods restricted in the school meal standards, namely sweetened drinks, confectionery (cakes and biscuits containing chocolate, chocolate and sugar confectionery and cereal bars) and savoury snacks.
Nutrients and food-based standards for the lunch meal were combined to produce a dietary quality score (DQS) for each lunch with a minimum of 0 and a maximum score of 21. This score was based on how many nutrient standards each lunch met (out of thirteen) together with how many healthy foods were included in the lunch (out of five) and how many restricted foods were not included in the lunch (out of three). A top score of 21 was obtained if all the nutrient standards were met, all five healthy foods were included and none of the restricted foods were included in the child’s lunch.
Statistical analysis
All statistical analyses were carried out using the statistical software package Stata release 12.0. The distribution for lunch quality score was checked to ensure a normal distribution before analysis. Multilevel regression modelling was used to take into account the clustering effect of children within schools. Variables showing an extremely skewed distribution were considered for transformation to the natural logarithm before carrying out statistical tests. Model fit was checked by inspecting histograms of the residuals.
Multilevel regression analysis was performed in three steps to identify important nutrient variables explaining variability in the DQS in conjunction with foods. First, a forward stepwise regression method was used beginning with all eight foods (forced into the model) and adding nutrients into the model one at a time until no new nutrients significantly explained variation in lunch quality score. Second, individual models for each significant nutrient in conjunction with foods were produced in order to identify the most important single nutrients contributing to variation in lunch quality. Third, the nutrients most strongly associated with lunch quality score were included in the model with all eight foods. The percentage variance explained by each model was reported as well as the intra-class correlation, denoting the percentage of variation at the school level.
Lunches were split into quintiles of nutrients strongly associated with DQS to graphically display change in lunch quality score with increased nutrient provision. Changes in score by quintiles of food groups were also displayed.
Results
Data on lunchtime intake were collected from 1294 children. Of these, 631 (49 %) were male and 661 (51 %) were female, and two children had no information on gender collected. No lunches were excluded from the analysis. Mean DQS for all lunches was 10·0 (95 % CI 9·7, 10·2) and had an approximately normal distribution. No lunches met all twenty-one standards. The mean number of nutrient standards met out of a total of thirteen for each lunch excluding energy was 6·0 (95 % CI 5·9, 6·2) with a median of 6. One lunch met all thirteen standards and the lowest number of standards met was one. The mean number of food-based standards met out of a total of eight (five healthy and three restricted) was 4·0 (95 % CI 3·8, 4·1) and a median of 4. Thirteen lunches (1 %) met all the food-based standards while seven lunches did not meet any of the food-based standards. More details on individual foods and nutrients are published elsewhere( Reference Evans, Greenwood and Thomas 14 ). All distributions of lunch quality score, food- and nutrient-based standards were approximately normal and therefore none were transformed.
Multiple regression was carried out using DQS as the outcome variable. The full regression model revealed that the thirteen nutrients and eight foods explained 74 % of the variation in DQS (see Table 1). Models with only nutrients or only food groups explained lower levels of variation in DQS (see Table 1). Forward stepwise regression with all food groups in the model excluded six nutrients, namely total fat, carbohydrate, added sugars, fibre, Zn and vitamin A, as these nutrients explained very little of the variation in DQS. Seven nutrients remained in the model; these were saturated fat, Ca, Fe, vitamin C, protein, Na and folate. The regression model with all eight food groups and the seven significant nutrients explained 72 % of the variation in quality score. The models with each individual nutrient in turn in conjunction with the eight foods revealed that Fe, folate, vitamin C, protein and fibre (NSP) were important individual nutrients in terms of predicting lunch quality in addition to foods.
Table 1 Percentage variation in dietary quality of children’s packed lunches explained by different regression models with specified foods and nutrients. Dietary data from British schoolchildren (n 1294), aged 8–9 years, taking a packed lunch in eighty-nine schools across the four regions of the UK (England, Wales, Scotland and Northern Ireland), 2006
NMES, non-milk extrinsic sugars.
R 2 denotes the overall variation explained by the model. The intra-class correlation (ICC) denotes the percentage variation at the school level in the two-level model. The remaining variation is at the individual lunch level.
The three nutrients consistently important in terms of predicting lunch quality in both unadjusted models with food groups only and the model adjusted for all foods and nutrients were folate, vitamin C and Fe, which were all associated with a consistent increase in DQS (see Fig. 1). For example, lunches with the lowest quintile of folate provided in their lunch (1–31 µg) on average had a score of less than 8, whereas lunches provided with the highest quintile of folate (75 µg or more) on average had a score of more than 12 (out of 21). The model with all eight foods and these three nutrients explained 70 % of the variation in lunch quality score (see Table 1). Higher provision of healthy foods such as sandwiches and lower provision of restricted foods increased DQS significantly (see Table 2). When the main models were adjusted for energy the R 2 values did not change (data not shown).
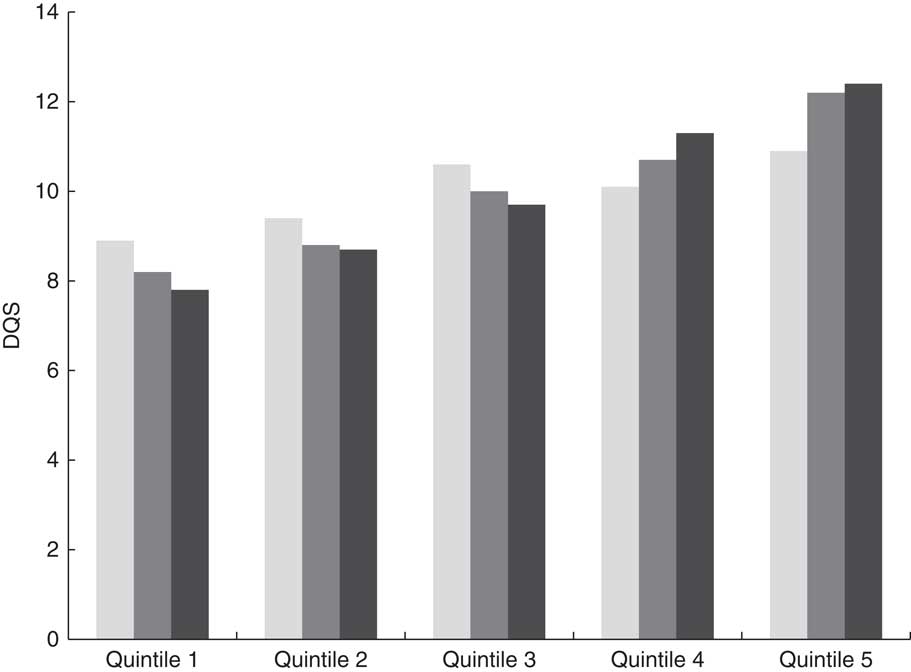
Fig. 1 Mean dietary quality score (DQS) out of 21 for each quintile of the three nutrients, vitamin C (![]() ), iron (
), iron (![]() ) and folate (
) and folate (![]() ), provided in children’s packed lunches, that improved DQS in conjunction with food groups. Dietary data from British schoolchildren (n 1294), aged 8–9 years, taking a packed lunch in eighty-nine schools across the four regions of the UK (England, Wales, Scotland and Northern Ireland), 2006
), provided in children’s packed lunches, that improved DQS in conjunction with food groups. Dietary data from British schoolchildren (n 1294), aged 8–9 years, taking a packed lunch in eighty-nine schools across the four regions of the UK (England, Wales, Scotland and Northern Ireland), 2006
Table 2 Mean dietary quality score (DQS) out of 21, and 95 % CI, for each quintile of six food groupsFootnote * in children’s packed lunches, taking the multilevel model into account. Dietary data from British schoolchildren (n 1294), aged 8–9 years, taking a packed lunch in eighty-nine schools across the four regions of the UK (England, Wales, Scotland and Northern Ireland), 2006
* Sandwich (low-fat carbohydrate), fruit, milk dessert, savoury snacks, confectionery (sweet snacks) and sugar-sweetened beverages (SSB).
Discussion
We found that meeting recommended levels of both foods and nutrients is necessary to ensure a high-quality packed lunch. However, the use of a large number of nutrient standards in addition to food-based standards is not welcomed by schools, as has been seen for school meal standards where the nutrient-based standards have been replaced with the food-based school food plan( Reference Dimbleby and Vincent 8 ). To improve policy guidelines, the present results identify three key nutrients that are useful to incorporate with food-based recommendations into policies to encourage good-quality packed lunches: folate, vitamin C and Fe.
The present results indicate that for packed lunches, including healthy and restricting unhealthy foods adequately ensures that macronutrients such as fats and added sugars are controlled. We found no association of total fat provision with lunch quality and associations for saturated fat were weaker than for other nutrients. Furthermore, added sugars were not associated with lunch quality when foods were included since these are sufficiently limited through restriction of confectionery and drinks. Similar findings have been reported for school meals in the school food plan. However, the addition of nutrient standards to food standards is useful for ensuring a nutritious packed lunch rich in micronutrients. The quality of packed lunches could improve if specific advice is provided on foods rich in folate, vitamin C and Fe in addition to the existing food-based recommendations. This would include encouraging the following: sandwiches with Fe-rich filling such as red meat or beans/lentils, salad with green leaves, citrus fruits and pure fruit juices. Dessert items that are not confectionery are already encouraged by many schools, such as promoting fruit-based cakes without chocolate, e.g. apple cake and sweetened bread-based items that contain less sugar than cake such as teacakes.
Some nutrients may not have contributed to variation in lunch quality as they are highly correlated with other nutrients. These include correlations between total fat and saturated fat; Ca and protein; Zn and saturated fat; fibre and Fe; protein and Na (data not shown). This may explain why fibre was not as strongly associated with lunch quality as expected. Lower Na was associated with higher lunch quality; however, common sources of Na are nutritious foods such as meat, fish, bread and cheese, and not from salt added to the packed lunch. Therefore reformulation of foods to reduce Na content is potentially more beneficial than individual advice.
There is little previous research with which to compare our results; a strength of the study. Previous analysis comparing lunches that met only the food-based standards and those that met both food- and nutrient-based standards reported that lunches that met both were more nutritious( Reference Haroun, Wood and Harper 13 ). Also a strength of our study was the inclusion of a large representative sample of children from schools across the UK, although the majority were from England. The clustering of children within schools was taken into account in the analysis using a two-level model. This research provides an ideal opportunity to build a DQS for foods provided at lunchtime for children. However, there are limitations to the present study. There is no universally agreed measure of dietary quality for children’s lunches and therefore the DQS is not in general use and has not been validated. Indeed, a review reported that there are many measures of dietary quality in use in children( Reference Marshall, Burrows and Collins 10 ). Furthermore, the DQS is based on levels of nutrients and foods of interest, which is not ideal. The majority of the nutrient standards are for nutrients that are encouraged rather than limited, which may bias assessment in favour of healthier components. The current analysis included only children who took a packed lunch to school and did not include children having a school meal for comparison. Also, the analysis did not take into account differences in standards by region. Further work is required on school meal data to determine whether similar patterns result. Although representative of 8- to 9-year-olds, the information is not necessarily relevant for other age groups. The focus of the analysis is dietary quality of one meal event and not dietary quality over the whole day.
Despite these limitations, the information presented here is useful for school policy makers aiming to improve the quality of packed lunches brought to school. The results from our analysis of packed lunches reveal that including recommendations for a small number of nutrients, namely folate, Fe and vitamin C, in conjunction with the recommendations for foods, both encouraged and restricted, could help improve packed lunch quality. Packed lunch policies are set by schools and therefore individual schools would be responsible for evaluating the success of a policy, training relevant school staff and communicating information to parents via websites or newsletters.
Acknowledgements
Acknowledgements: The authors thank Dr Darren Greenwood for his statistical support, and the schools and children for their involvement in the project. Financial support: This research was funded by the University of Leeds and received no specific grant from any funding agency in the public, commercial or not-for-profit sectors. This project was originally commissioned by the Food Standards Agency (N14R0004). The views and opinions expressed therein are those of the authors and do not necessarily reflect those of the Food Standards Agency. Conflict of interest: C.E.L.E. and J.E.C. have no further financial support. C.E.L.E. and J.E.C. have no other relationships with companies that might have an interest in the submitted work. C.E.L.E. and J.E.C. have no non-financial interests that may be relevant to the submitted work. Authorship: C.E.L.E. designed the research protocol and statistical analysis plan, C.E.L.E. wrote the first manuscript, carried out the analysis and contributed to all versions of the manuscript. J.E.C. secured the funding for the original project and contributed to all versions of the manuscript. Ethics of human subject participation: This study was approved by the University of Leeds Ethics Committee (ethics number food1906). The trial registry code is ISRCTN77710993.


