


Vitamin D is an essential micronutrient for growth, development and adequate puberty onset in children( Reference Holick 1 – Reference Casey, Slawson and Neal 3 ). Historically, a low serum level of 25-hydroxyvitamin D (25(OH)D) has been associated with growth failure and skeletal deformation( Reference Holick 2 , Reference Casey, Slawson and Neal 3 ). Recent studies also showed that even without such clinical symptoms, low levels of serum 25(OH)D may delay maturation of the immune system( Reference Wagner and Greer 4 ) and increase the risk of future asthma( Reference Bozzetto, Carraro and Giordano 5 ), respiratory infections( Reference Bozzetto, Carraro and Giordano 5 – Reference McNally, Leis and Matheson 9 ), auto-immune diseases and metabolic disorders( Reference Hypponen, Laara and Reunanen 10 , Reference Lee, Kwon and Ahn 11 ). Thus, the high prevalence of subclinical vitamin D deficiency (even without clinical symptoms), otherwise called vitamin D insufficiency, is considered a public health problem( Reference Casey, Slawson and Neal 3 , Reference Bozzetto, Carraro and Giordano 5 , Reference Hilger, Friedel and Herr 12 ).
Serum 25(OH)D is influenced by both dietary intake of vitamin D and exposure to sunlight( Reference Holick 2 , Reference Wacker and Holick 13 ). Current recommendations (by the American Academy of Paediatrics (AAP) 2014, Institute of Medicine (IOM) 2011)( Reference Golden and Abrams 14 , 15 ) state that children 1 year old and older should receive at least 600 IU (15 μg) of vitamin D daily through diet or supplements regardless of levels of sun exposure as awareness of the adverse effects of UVB exposure on health, such as the increased risk of future skin cancer, has risen( Reference Casey, Slawson and Neal 3 , Reference Wagner and Greer 4 , Reference Balk, Binns and Brumberg 16 ). Recent studies showed that serum 25(OH)D status differed also by other factors such as age, latitude and skin colour( Reference Holick 1 , Reference Hilger, Friedel and Herr 12 ), suggesting that population-specific recommendations may be better than a universal recommendation for preventing vitamin D deficiency. Unfortunately, most of the studies of how food, UVB exposure and other factors influence vitamin D status in preschool children have been done in high-latitude Western countries (51–62°N) where prolonged periods of winter darkness reduce the skin’s natural production of vitamin D( Reference Munasinghe, Yuan and Willows 17 – Reference Akkermans, van der Horst-Graat and Eussen 19 ) no studies have been conducted in lower latitude countries like Japan.
Furthermore, the extent of the influence of dietary vitamin D on serum 25(OH)D levels, that is, the relative contributions of vitamin D intake from food and UVB exposure on serum concentrations, has been poorly studied in preschool children. In adults, studies estimated that 15–42 % of vitamin D derives from food such as fish, eggs and milk whereas the rest is synthesised by the skin through exposure to sunlight( Reference Bozzetto, Carraro and Giordano 5 , Reference Dawodu, Davidson and Woo 20 , Reference Macdonald, Mavroeidi and Fraser 21 ) (especially to UVB radiation in the range of 280–320 nm)( Reference Holick 1 – Reference Casey, Slawson and Neal 3 , Reference Wacker and Holick 13 ). Such knowledge may be useful for designing interventions to reduce vitamin D deficiency.
We, therefore, investigated factors associated with serum 25(OH)D status and evaluated the relative contributions of vitamin D intake from food and UVB exposure on serum 25(OH)D levels in a cohort of 3-year-old preschool children in Japan.
Methods
Subjects
Our study was based on the Seiiku Boshi cohort study, a prospective, hospital-based birth cohort, whose primary aim was to explore how antenatal factors influenced maternal health and the child’s growth, function and risk of disease( Reference Ogawa, Morisaki and Kobayashi 22 ). For this cohort, pregnant women attending their first antenatal visit at the National Center for Child Health and Development (NCCHD (35°N)) were recruited from 13 May 2010 to 28 November 2013 and were asked to complete a questionnaire which included several items on socio-demographic factors. Serial, onsite interviews of the respondents and their children were also conducted. Of 4164 women, 2310 consented to participate in the study. Most participants lived in or near Tokyo (35°N).
The 36-month follow-up interview was conducted monthly from July 2014 to October 2016 at the NCCHD and scheduled according to each child’s birth month. A questionnaire including a brief-type self-administered diet history questionnaire for children aged 3–6 years (BDHQ3y) as well as a question on daily outdoor playtime was delivered to the participants 1 month before the interview and was submitted at the interview. Half of the participants were also randomly selected to undergo a blood test at the interview.
Among 1370 participants who were given the questionnaires and asked to take a blood test at the 36-month follow-up interview, serum 25(OH)D levels were measured in 721 (52·6 %), among whom, 574 (79·6 %) completed and returned both questionnaires.
The protocol of the cohort study (project number 417, approved on 2 August 2010) was approved by the Institutional Review Board at the NCCHD in Tokyo, Japan. Written informed consent was obtained from the mothers on behalf of their children.
Brief-type self-administered diet history questionnaire for children aged 3–6 years
The BDHQ3y was developed to assess the dietary intake in Japanese children of 3–6 years of age during the preceding month( Reference Asakura, Haga and Sasaki 23 ).
The BDHQ3y is four pages long and contains the following four sections: (1) intake frequency of fifty-seven food and non-alcoholic beverage items; (2) daily intake of rice, including type of rice (refined, unrefined or rice boiled with barley) and miso soup; (3) usual cooking methods and (4) general dietary habits. As the Japanese diet includes a wide range of fish species cooked in a variety of ways, the BDHQ3y orders fish into seven categories (squid, octopus, shrimp and shellfish; small fish with bones; canned tuna; dried fish (e.g. salted mackerel, salted salmon and dried horse mackerel); oily fish (e.g. sardine, mackerel, pacific saury, yellowtail, herring, eel and tuna); lean fish (such as salmon, trout, white fish, freshwater fish and bonito) and fish paste (such as fish sausage and boiled fish paste)). The BDHQ3y also asks about the frequency of the consumption of vitamin D-fortified foods or vitamin D supplements in the previous month but does not ask the respondent to name the food or supplement.
The BDHQ3y was constructed using the BDHQ, which was developed for adults and has been validated by previous studies( Reference Kobayashi, Murakami and Sasaki 24 – Reference Kobayashi, Honda and Murakami 26 ); however, the BDHQ3y excludes the section pertaining to the consumption of alcoholic beverages and coffee and includes a section pertaining to food items frequently consumed by children, such as yogurt drinks, French fries, chocolate and ketchup.
To assess the daily intake of sixty-six food items, the total energy content and forty-two selected nutrients based on responses to the BDHQ3y, we used an ad hoc computer algorithm( Reference Asakura, Haga and Sasaki 23 , Reference Asakura, Haga and Adachi 27 ). The BDHQ3y does not collect data on the portion sizes of food consumed by the subjects and instead uses age-specific portion sizes of food and beverages based on previous studies( Reference Asakura, Haga and Sasaki 23 , Reference Asakura, Haga and Adachi 27 ). A more detailed methodology for assessing portion size has been reported previously( Reference Asakura, Haga and Sasaki 23 ). Crude values for the daily total intake of energy content and forty-two selected nutrients, including vitamin D, were calculated based on both the data reported on the BDHQ3y and the values given for the individual items on the Standard Tables of Food Composition in Japan ( 28 ). In detail, the daily intake of vitamin D was calculated as the sum of vitamin D in selected food items, for example, cereals, vegetables except for green and yellow vegetables (including mushrooms and seaweeds), fish and shellfish, meat, eggs, dairy products, fats, snacks, beverages and seasonings( Reference Asakura, Haga and Sasaki 23 ). Pearson and Spearman correlations between the BDHQ3y and a 3-d dietary record for vitamin D were 0·37 and 0·24, respectively( Reference Asakura, Haga and Sasaki 23 ).
Serum 25-hydroxyvitamin D concentration
Samples were centrifuged for 10 min at 3000 rpm to separate the sera from the pellet. The sera were stored at −20°C until measurement. The levels of 25(OH)D in the sera were estimated based on the 25(OH)D concentrations measured by competitive protein binding assay using a liquid scintillation counter developed by LSI Medience Corporation.
The tests were conducted by LSI Medience Corporation. The intra- and interassay coefficients of validation for 25(OH)D concentration measurement were 7·3–10·3 and 8·0–10·8 %, respectively. We defined vitamin D insufficiency as a serum 25(OH)D concentration <20 ng/ml based on previous studies( Reference Holick 2 – Reference Wagner and Greer 4 , Reference Hilger, Friedel and Herr 12 ).
Assessment of outdoor playtime and background UVB level
The UVB exposure is influenced by both sunlight exposure time and the background UVB radiation level, which differs by season. Therefore, we collected information on outdoor playtime and background UVB radiation level at the time of the serum 25(OH)D assessment.
The questionnaire administered for the 36-month follow-up contained one question on regards to outdoor playtime: ‘On average, how long does your child stay outside for the following activities (walking to kindergarten or nursery, walking to a park, walking to the supermarket or convenience store, walking in the park) per day?’ The response choices were as follows: (1) 15 min, (2) 30 min, (3) 45 min, (4) 60 min and (5) more than 60 min. If a mother answered (5), she was next asked to indicate how many hours. None of the questions asked about the use of sunscreen.
For assessment of the background UVB radiation level, we used the monthly average of daily measurements reported by the Japan Meteorological Agency of the total UVB radiation for Tsukuba (36°N), a suburban town located approximately 75 km from Tokyo (35°N). Based on these reports, we created two categories: one based on whether UVB was above or below 15 kJ/m2 and another based on whether UVB was above or below 10 kJ/m2. For all the years from 2011 to 2013, October–March had UVB <15 kJ/m2, and November–February had UVB <10 kJ/m2.
Assessment of other covariates
Socio-demographic factors including household income and the educational background of the parents were ascertained by the questionnaire administered at enrolment. Data were completed for maternal education and household income; however, thirty children had missing data on the father’s education. We placed these children into the ‘missing father’s education status’ group.
The BDHQ3y also asks about current height, weight as well as the response date. We calculated the BMI from self-reported height and weight. If the data were missing, they were complemented by measurements obtained at the 36-month visit.
Statistical analysis
First, we compared the average serum 25(OH)D level and the risk of vitamin D insufficiency based on tertiles of vitamin D intake from food, five categories pertaining to outdoor playtime and background UVB radiation level at the month of assessment, using test for trend.
Next, we assessed the association between vitamin D insufficiency and vitamin D intake from food, daily outdoor playtime, background UVB radiation level, household income and parental educational background using multiple logistic regressions. In addition, we assessed the association between serum 25(OH)D level and the factors listed above using multiple linear regression.
Third, we analysed the Pearson correlation coefficients between serum 25(OH)D level and vitamin D intake, outdoor playtime and season at the time of assessment in order to calculate the individual effects of food intake and sun exposure on serum 25(OH)D level. To assess the relative contribution of vitamin D intake from food, socio-economic factors and sun exposure on serum 25(OH)D levels, we performed ANOVA using least squares to fit linear models, in which the relative contribution of each factor was calculated by dividing the partial sum of squares for each variable by the partial sum of squares of the full model.
Fourth, as the effect of vitamin D intake on serum 25(OH)D levels may be stronger among those with less UVB exposure, we repeated this analysis among subgroups of the sample using two different cut-offs for UVB exposure (<10 and <15 kJ/m2). In addition, we investigated whether vitamin D intake differed between children with and without vitamin D insufficiency among those with low UVB exposure (<10 or <15 kJ/m2).
The sample size for this study was determined by the feasibility of recruitment (expected number of participants of 3-year follow-up was n 800) and the estimated minimally detectable correlation was r 0·10 (α=0·05, β=0·20, required sample size n 783). The minimally detectable correlation of the final sample (n 574) was r 0·117( Reference Lachin 29 ).
All statistical analysis were conducted using Stata version 14, and the results were represented as means and standard deviations. All tests were two-tailed, with a P values <0·05 considered as statistically significant.
Results
In total, serum 25(OH)D measurements, valid BDHQ3y assessment of food intake and self-reported daily outdoor play time were obtained from 574 children (271 girls and 303 boys) at 36 months of age. All participants were free from disease including vitamin D-deficient rickets.
Characteristics of the study participants are shown in Table 1. The average serum 25(OH)D concentration was 23·5 (sd 6·1) ng/ml while the average vitamin D intake from food was 3·1 (sd 1·8) μg/d. The largest source of vitamin D was fish, with the daily vitamin D intake from fish being 2·4 (sd 1·7) μg/d. Overall, the proportion of children with vitamin D insufficiency was 29·6 % (170 children), and 8·5 % of children (forty-nine children) had a level below 15 ng/ml. The proportion of children with vitamin D insufficiency did not differ according to the quantity of vitamin D obtained from food.
Table 1 Characteristics of study participants (Mean values and standard deviations; numbers and percentages)

25(OH)D, 25-hydroxyvitamin D.
*** P≤0·001.
† P value derived from Mann–Whitney U test comparing participants without vitamin D insufficiency to those with vitamin D insufficiency.
‡ BMI z-score was calculated by using the WHO Child Growth Standards (2007) as reference data.
§ Percentage with vitamin D insufficiency of the subgroup members.
Fig. 1 shows serum 25(OH)D concentration by levels of vitamin D and sun exposure (daily outdoor playtime and background UVB radiation level). The average serum 25(OH)D concentration did not differ between children according to the level of vitamin D intake from food (high: middle: low, P-trend=0·26) or outdoor play time (15 min: 30 min: 45 min: 60 min: more than 60 min, P-trend=0·14). On the other hand, serum 25(OH)D levels were significantly higher among measurements conducted when UVB was above 15 kJ/m2 (April to September) compared with those conducted when UVB was below 15 kJ/m2 (October to March) (P<0·001), as well as those conducted when UVB was above 10 kJ/m2 (November to February) compared with months when UVB was above 10 kJ/m2 (March to October) (P<0·001). Measurements in July and August showed the highest values while those in January showed the lowest values (online Supplementary Fig. S1).

Fig. 1 Serum 25-hydroxyvitamin D (25(OH)D) levels by vitamin D intake (a), daily outdoor playtime (b) and background UVB radiation level at measurement (c and d). * P<0·001. The box plots show the median and interquartile range (IQR); the whiskers represent 2·5 times the IQR above and below the median for each variable. Data not included between the whiskers are shown as dots. UVB cut-off is 15 kJ/m2 in (c) and 10 kJ/m2 in (d). P values calculated for non-parametric test for trend is 0·257 for (a) and 0·142 for (b). P value calculated for Mann–Whitney U test is P<0·001 for (c) and (d).
Table 2 shows the association between vitamin D insufficiency and vitamin D intake from food, daily outdoor play time, background UVB radiation level, household income and parental educational background. In the adjusted model, background UVB radiation level showed the strongest association with vitamin D insufficiency, with measurements conducted in winter (when UVB <15 kJ/m2) having almost twice the odds of indicating vitamin D insufficiency compared with those obtained in summer when UVB >15 kJ/m2 (OR 1·89, 95 % CI 1·31, 2·74, P<0·001). Compared with children whose intake was in the highest tertile (>3·43 μg/d), children whose intake was in the middle tertile (2·24–3·43 μg/d) had 1·62 (95 % CI 1·03, 2·57) times higher odds of vitamin D insufficiency, while those in the lowest tertile (<2·24 μg/d) having 1·32 (95 % CI 0·83, 2·10) times higher odds of vitamin D insufficiency.
Table 2 Associations between socio-economic status, vitamin D intake from food, daily outdoor play time and season with the likelihood of vitamin D insufficiency (25-hydroxyvitamin D <20 nmol/l)† (Odds ratios and 95 % confidence intervals)

Ref., reference.
*P<0·05, ***P≤0·001.
†Adjusted for all covariates in this table.
Table 3 shows the association between serum 25(OH)D concentration and vitamin D intake from food, daily outdoor playtime, background UVB radiation level, household income and parental educational background. In this model, vitamin D intake did not show a significant association with serum 25(OH)D level after adjusting for other factors. Children whose intake was in the lowest tertile (<2·24 μg/d) had on average −0·25 (95 % CI −1·45, 0·94) ng/ml lower serum 25(OH)D levels than children whose intake was in the highest tertile (>3·43 μg/d). Background UVB radiation level and the father’s educational status were significantly associated with serum 25(OH)D concentration, with measurements conducted in winter (when UVB <15 kJ/m2) being on average −2·91 (95 % CI −3·89, −1·93) ng/ml lower than those conducted in summer when UVB >15 kJ/m2, and measurements in children missing data on paternal educational status were on average −3·90 (95 % CI −6·38, −1·43) ng/ml lower than in those who completed graduate school.
Table 3 Associations between socio-economic status, vitamin D intake from food, daily outdoor play time and season with serum 25-hydroxyvitamin D level† (Mean differences (MD) and 95 % confidence intervals)

Ref., reference.
*P<0·05, ** P≤0·01; *** P≤0·001.
†Adjusted for all covariates in this table.
Table 4 shows the Pearson correlations between serum 25(OH)D levels and vitamin D intake, outdoor playtime and background UVB radiation level. No significant correlation was observed between serum 25(OH)D levels and vitamin D intake (r 0·060, P=0·15; scatter plot with fitted linear regression line shown in Fig. 2). Outdoor play time was also not significantly correlated with serum 25(OH)D levels (r 0·067, P=0·11); however, background UVB radiation level was positively correlated with serum 25(OH)D levels (r 0·262, P<0·001).
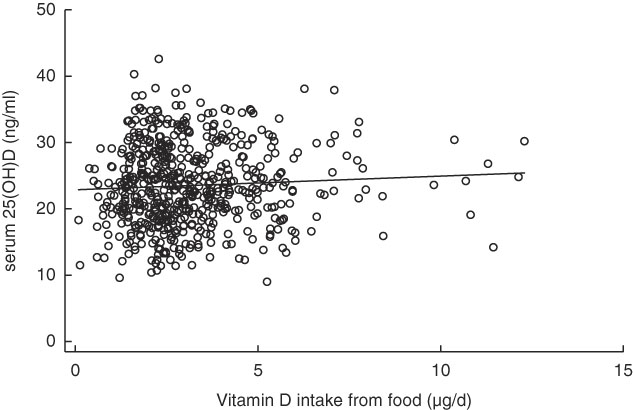
Fig. 2 Scatter plot between vitamin D intake from food and serum 25-hydroxyvitamin D (25(OH)D) levels with fitted linear regression line.![]() , Subjects;
, Subjects; ![]() , fitted values.
, fitted values.
Table 4 Correlations between vitamin D intake and sun exposure with serum 25-hydroxyvitamin D levels

Next, we performed ANOVA to assess the relative contribution of vitamin D intake from food, socio-economic factors and sun exposure on serum 25(OH)D levels simultaneously because vitamin D intake was significantly correlated with outdoor play time (r 0·15, P<0·001), suggesting that socio-economic status was influencing both. The ANOVA showed that the largest contributor to variations in the serum 25(OH)D level was background UVB radiation (63 %) followed by socio-economic factors (23 %). The contributions of variability in vitamin D intake from food (1·2 %) and variability in outdoor play time (2·7 %) were both small. In this analysis, the contribution of variability in vitamin D intake from food on the variability of serum 25(OH)D level was 1·8 % of that of UVB exposure.
In a subgroup analysis assessing whether the correlation between vitamin D intake and serum 25(OH)D levels was stronger among those with less UVB exposure (among measurements conducted when the background UVB radiation level was <15 and <10 kJ/m2), the correlation coefficient remained low (r 0·017 and 0·044) and statistically insignificant.
Fig. 3 shows the distribution of vitamin D intake among children with and without vitamin D insufficiency when the average monthly UVB radiation was below 15 and 10 kJ/m2. The values did not differ significantly. Similarly, the average vitamin D intake did not differ significantly between children with and without vitamin D insufficiency when the analysis was restricted to those with shorter outdoor playtime (data not shown).

Fig. 3 Vitamin D intake between those with and without vitamin D insufficiency among children with low UVB exposure, using different definitions ((a) UVB strength <15 kJ/m2, (b) UVB strength <10 kJ/m2). The box plots show the median and interquartile ranges (IQR); the whiskers represent 2·5 times the IQR above and below the median for each variable. Data not included between the whiskers are shown as dots. P value calculated for Mann–Whitney U test is 0·270 for (a) and 0·380 for (b).
Discussion
This study indicated that in Japanese preschool children, the prevalence of vitamin D insufficiency was relatively high at 29·6 %. Vitamin D intake from food did not have a significant association with the serum 25(OH)D level consistently regardless of the level of UVB exposure or other factors. Socio-economic factors and seasonality were stronger predictors of serum 25(OH)D levels.
Japanese (and other Asians) generally have been considered to have higher serum 25(OH)D levels as their diet includes more fish( Reference Yu, Kim and Kwon 30 – Reference Nakamura, Takebe and Tando 34 ), a very rich source of the nutrient( Reference Holick 2 , Reference Hilger, Friedel and Herr 12 , Reference Holick 35 ). However, interestingly, the prevalence of vitamin D insufficiency (29·6 %) was not lower in our study than in those done among children in Western, higher latitude countries where less fish is consumed (12–29 %)( Reference Casey, Slawson and Neal 3 , Reference Munasinghe, Yuan and Willows 17 – Reference Akkermans, van der Horst-Graat and Eussen 19 , Reference Gordon, Feldman and Sinclair 36 – Reference Petersen, Damsgaard and Dalskov 39 ). This was true despite the fact that the children included in our study reported high levels of fish intake (at least three times the amount consumed among children in other countries)( Reference Ni Chaoimh, McCarthy and Hourihane 18 , Reference Akkermans, van der Horst-Graat and Eussen 19 , Reference Soininen, Eloranta and Lindi 40 ). In addition, our subjects’ average amount of vitamin D intake was similar to the value recently reported by the National Health and Nutrition Survey Japan in 2016 (3·7 (sd 3·8) µg/d, median: about 2·1 µg/d vitamin D intake by children 1–6 years)( 41 ). Our findings suggest that vitamin D insufficiency may be highly prevalent throughout Japan despite the relatively high consumption of vitamin D-rich foods, a finding supported by a recent, population-based study, which revealed that rickets caused by vitamin D deficiency has increased nationwide( Reference Itoh, Tomio and Toyokawa 42 ).
This result may be partly due to certain lifestyle factors peculiar to Japan. Avoidance of excessive sun exposure has become more and more the rule, while access to vitamin D-fortified foods and vitamin D supplements for children remains very poor (vitamin D-fortified food itself is scarce in Japan, and there is no recommendation for vitamin D supplementation for children; vitamin D supplements for infants were introduced only in 2014)( Reference Itoh, Tomio and Toyokawa 42 ). Oily fish such as sardine are the most vitamin D-rich oily fish in Japan, but in order to consume 15 µg (600 IU) of vitamin D per d( Reference Golden and Abrams 14 , 15 ) as recommended by the IOM and AAP, children need to eat 300 g of sardines every week. This may not be realistic for 3-year-old children.
Serum 25(OH)D levels are influenced not only by dietary intake but also by vitamin D synthesised by the skin’s exposure to UVB radiation (280–320 nm)( Reference Holick 2 , Reference Hilger, Friedel and Herr 12 , Reference Wacker and Holick 13 , Reference Holick 35 , Reference Holick 43 , Reference MacLaughlin, Anderson and Holick 44 ). We found that the background UVB radiation level was significantly associated with serum 25(OH)D levels in line with previous studies, which have shown this association in infants and school-aged children( Reference Casey, Slawson and Neal 3 , Reference Munasinghe, Yuan and Willows 17 , Reference Ni Chaoimh, McCarthy and Hourihane 18 , Reference Dawodu, Davidson and Woo 20 , Reference Yu, Kim and Kwon 30 , Reference Petersen, Damsgaard and Dalskov 39 , Reference Soininen, Eloranta and Lindi 40 , Reference Thorisdottir, Gunnarsdottir and Steingrimsdottir 45 – Reference Han, Kang and Kim 48 ). Seasonal differences in serum 25(OH)D levels were large, with the prevalence of vitamin D insufficiency being two times higher in winter than in summer, underscoring the large effect of UVB exposure on serum 25(OH)D levels even at relatively low latitudes( Reference Holick 35 , Reference Holick 43 ). While a previous study estimated that, in adults, 15–42 % of vitamin D was derived from food whereas the rest was synthesised( Reference Bozzetto, Carraro and Giordano 5 , Reference Dawodu, Davidson and Woo 20 , Reference Macdonald, Mavroeidi and Fraser 21 ), the relative contributions of these two sources have not been reported for children. Our study found that in Japanese preschool children, the contribution of dietary vitamin D to the variability of serum 25(OH)D level was much smaller and only 1·8 % that of UVB exposure. Several reasons may have led to this discrepancy. Our population lived at a much lower altitude (35°N) than the subjects in the previous study (51°N); thus, while the amount of vitamin D consumed was similar, the relative contribution of UVB may have been higher. Our study used a FFQ with a greater possibility of measurement errors in estimating vitamin D intake compared with the previous study which used 4- and 7-d food diaries. Further studies evaluating the contribution of dietary vitamin D on vitamin D status in preschool children are required.
While we found seasonality to have a consistent and strong influence on vitamin D status, we failed to find a consistent significant association between dietary vitamin D and the risk of vitamin D insufficiency and failed to find any significant association between dietary vitamin D and the average serum 25(OH) level. Furthermore, the contribution of vitamin D intake on the risk of vitamin D insufficiency was moderate, with risk among children whose intake was in the lowest tertile estimated to be 1·3 times higher than in children whose intake was in the highest tertile, a much smaller value compared that of the effect of UVB exposure. Even when we repeated the analysis after restricting the population to those with low UVB exposure following previous reports suggesting the influence of dietary vitamin D intake was higher when UVB exposure was low( Reference Holick 35 , Reference Holick 43 ), the correlation between dietary vitamin D intake and serum 25(OH)D level remained weak and insignificant. Taken together, our study suggested that increasing the dietary intake of vitamin D may not substantially alter serum 25(OH)D levels in Japanese children.
This lack of association between dietary intake and serum 25(OH)D levels did not agree with the findings of previous studies, most of which showed a positive association in children. This discrepancy may be due to the very limited availability of vitamin D-fortified foods or (inactivated) vitamin D supplements in Japan( Reference Itoh, Tomio and Toyokawa 42 ). While the majority of the vitamin D intake in previous cohort studies was derived from fortified milk or supplements, and the amounts deriving from naturally vitamin D-rich foods (such as fish and eggs) contributed to only 9–12 % of total intake( Reference Ni Chaoimh, McCarthy and Hourihane 18 , Reference Soininen, Eloranta and Lindi 40 ), in the participants in our study, 85 % of the vitamin D intake came from fish (not fortified). Milk, which is not fortified with vitamin D in Japan and only contains 0·3 μg (12 IU)/100 g( 49 ) of the nutrient, contributed a mere 10 % to the total vitamin D intake. Our study suggested that increasing the consumption of natural (not fortified) vitamin D-rich foods may not be very effective in increasing serum 25(OH)D levels. Rather, fortification or supplementation may be the more realistic way of preventing vitamin D deficiency when sufficient UVB exposure is not available( Reference Munasinghe, Yuan and Willows 17 , Reference Akkermans, Eussen and van der Horst-Graat 50 ).
Our study also failed to find a significant association between outdoor playtime and the serum 25(OH)D level unlike previous studies of breastfed infants and school-aged children( Reference Dawodu, Davidson and Woo 20 , Reference Voortman, van den Hooven and Heijboer 47 , Reference Dawodu, Zalla and Woo 51 ). This may have been due to the crudity of our measurement of sunlight exposure, as we measured only outdoor playtime but did not consider the area of skin exposed, sunscreen use or time of day when the exposure occurred, since very little if any vitamin D is produced before 10.00 hours and after 15.00 hours( Reference Wacker and Holick 13 ).
Several recent studies showed that vitamin D levels could also vary according to social and environmental factors such as skin colour and socio-economic status( Reference Thorisdottir, Gunnarsdottir and Steingrimsdottir 45 , Reference Voortman, van den Hooven and Heijboer 47 , Reference Madsen, Rasmussen and Mejborn 52 – Reference Carpenter, Herreros and Zhang 54 ). In our study, we found the risk of vitamin D insufficiency to vary according to parental characteristics (children with the highest risk, that is, children whose mothers reported their own education status but omitted the father’s, were likely to be single mothers). In addition, outdoor playtime was significantly correlated to vitamin D intake from food (data not shown). These findings suggest that health-consciousness, which is likely related to socio-economic status, may be an important contributing factor to both vitamin D intake and outdoor playtime and may explain why we found socio-economic factors to be the second largest contributor to variability in serum 25(OH)D levels following UVB exposure when the relative contribution of each factor was analysed. Future studies on how and why socio-economic status influences serum 25(OH)D are required (Table 5).
Table 5 Relative contribution of vitamin D intake from food, socio-economic factors and sun exposure on serum 25-hydroxyvitamin D levels

*** P≤0·001.
†Percentage of relative contribution was derived by dividing the partial sum of squares for each variable by the partial sum of squares of the full model.
‡Socio-economic factors include household income, mother’s education and father’s education.
These findings suggested several policy implications. Due to the increasing knowledge that subclinical vitamin D deficiency, also called as vitamin D insufficiency, may be deleterious to children’s health( Reference Casey, Slawson and Neal 3 , Reference Wagner and Greer 4 ), it is recommended that a serum 25(OH)D concentration of 20 ng/ml (equivalent to 50 nmol/l) should be maintained in infants and children( Reference Casey, Slawson and Neal 3 , 15 ). As Asians consume relatively higher amounts of fish, a rich source of vitamin D, the risk of vitamin D insufficiency was assumed to be low in this population. However, we found that in Japanese children, the prevalence of vitamin D insufficiency was quite high even though their fish consumption was relatively high, outdoor playtime relatively long and latitude not high.
A possible explanation of the lack of an association between vitamin D intake and vitamin D insufficiency may be the recent, popular use of sunscreen and long-sleeved shirts to avoid UVB exposure( Reference Wacker and Holick 13 ). We showed, in our study, that the contribution of vitamin D intake to serum 25(OH)D levels was small compared with that of vitamin D synthesised through UVB exposure. Thus, small increases in vitamin D intake by increasing the consumption of vitamin D-rich foods may not be sufficient to reduce the risk of vitamin D insufficiency. If increasing UVB exposure by decreasing the use of sunscreen and long sleeves is not justifiable (a valid question, given that Asian populations including the Japanese have a relatively lower risk of skin cancer than Caucasians)( 55 ), increasing vitamin D intake through supplementation or fortification at least during seasons, when the background UVB radiation level is low, may be a realistic approach for reducing the prevalence of vitamin D insufficiency in preschool children.
The strengths of our study include the unified age range of the preschool participants (36 months). Our population was also ethnically homogeneous (all Japanese) and the latitude was also the same (Tokyo, 35°N), which maximises the study’s power to observe the influence of other factors on serum 25(OH)D concentrations. Another strength is that we used recorded UVB radiation data (reported by the Japan Meteorological Agency) rather than the crude categorises of season and were thus able to measure the contribution of UVB on serum 25(OH)D levels.
There were several limitations to our study. First, measurements of vitamin D intake from food may not be precise since previous validation disclosed that the Pearson and Spearman correlation coefficient for vitamin D was 0·35 and 0·30 for the BDHQ3y and the dietary records, respectively( Reference Asakura, Haga and Sasaki 23 ). However, the BDHQ3y has a detailed structure for estimating fish intake and is well suited to the dietary culture of Japan, and for nutrients such as EPA and DHA, which are also abundant in oily fish, the correlation between the BDHQ3y and dietary records (0·36–0·40, Asakura et al.( Reference Asakura, Haga and Sasaki 23 )) was similar to that between BDHQ3y estimates and serum values of EPA and DHA (E Ando, N Morisaki, K Asakura, K Ogawa, S Sasaki, R Horikawa and T Fujiwara, unpublished results). We, therefore, concluded that the BDHQ3y was able to estimate vitamin D intake from fish at a level acceptable enough to show a correlation between vitamin D intake and serum values if the influence of UVB were small. In addition, we did not have information on vitamin D supplementation; however, vitamin D supplementation is not commonly available in Japan( Reference Itoh, Tomio and Toyokawa 42 ), and 96 % of our subjects responded on the BDHQ that they did not consume any vitamin D-fortified foods or vitamin D supplements in the previous month (data not shown). Thus, we believe that measurement errors due to not measuring supplement intake are insignificant. Second, we used CPBA to measure serum 25(OH)D, but liquid chromatography–tandem MS-based methods, which are more accurate and reliable, are now becoming more readily available. Therefore, we may have over- or underestimated 25(OH)D concentrations in our study. Further studies using newer laboratory methods may be required. Third, our study omitted several factors influencing sun exposure, such as clothing, the use of sunscreen and the time of day on which the exposure occurred( Reference Wacker and Holick 13 ), which likely led to underestimating the effect of UVB exposure time on serum 25(OH)D concentration. Fourth, the sample size of our study, while comparable to those of previous studies, was relatively small (n 574). We may have failed to detect associations due to type 2 error, and further studies with larger samples are warranted to confirm our results. Finally, our study was not entirely representative of the general population as the study participants were not population-based but were volunteers from an affluent subpopulation of Tokyo (35°N). Thus, the families may have been more health conscious and as a result provided their children with vitamin D-rich food and taken their children outdoors more frequently but used more sunscreen than the general population. The smaller variability in vitamin D intake (with few children having low intake) may have led to a reduction in the power to detect its association with serum 25(OH)D levels.
In conclusion, in Japanese preschool children, vitamin D intake from food was not significantly associated with serum 25(OH)D levels regardless of UVB exposure and socio-economic factors. Our results suggest that increasing the intake of vitamin D from food may not substantially affect serum 25(OH)D levels in Japanese preschool children. Other methods of increasing serum 25(OH)D levels apart from promoting increased the consumption of vitamin D-rich food, such as increasing the availability of vitamin D supplementation, fortifying food and re-evaluating how much UVB exposure should be allowed for Asian children, may help reduce vitamin D insufficiency in Japan.
Conclusions
Nearly 30 % of Japanese children 3 years of age had vitamin D insufficiency despite high consumption of fish (naturally rich in vitamin D) and lived at relatively low latitude. In our study, we failed to observe a significant association between vitamin D intake and serum 25(OH)D level as well as the risk of vitamin D insufficiency, which may be due to the extremely limited access to vitamin D-fortified food and supplements for children in Japan. Promoting increases in vitamin D-rich food may not be sufficient to reduce risk of vitamin D insufficiency for children in Japan.
Acknowledgements
The authors are deeply indebted to all participants in the Seiiku Boshi Cohort Study.
This work was supported by the Research Development Grant for Child Health and Development (grant no. H25-4) and the Japan Agency for Medical Research and Development (grant no. AMED-6013).
The authors’ responsibilities were as follows: N. M., E. A., K. A., T. F. and R. H. designed the study; N. M. and R. H. conducted research; K. A. and S. S. provided essential materials; E. A. and N. M. analysed the data; E. A. and N. M. wrote the manuscript to which K. A. provided substantial comments; N. M. had primary responsibility for final content; and all authors read and approved the final manuscript.
The authors declare that there are no conflicts of interest.
Supplementary material
For supplementary material/s referred to in this article, please visit https://doi.org/10.1017/S0007114518002258


