


People’s food choices and dietary patterns, in addition to their health status, have indelible effects on ecosystems and financial resources(Reference Duchin1,2) . The agriculture and food sector is responsible for more than 25 % of all greenhouse gas emissions (GHGe)(Reference Tilman and Clark3) and 86 % of the water footprint of humanity(Reference Chapagain and Hoekstra4). Also, on average, 42 % of household income is spent on food globally(Reference Miller, Yusuf and Chow5). A sustainable diet is a concept advocated by the FAO to have a multidimensional definition of a diet including health, affordability and environment. According to the FAO definition, ‘Sustainable diets are those diets with low environmental impacts which contribute to food and nutrition security and healthy life for present and future generations. Sustainable diets are protective and respectful of biodiversity and ecosystems, culturally acceptable, accessible, economically fair and affordable; nutritionally adequate, safe and healthy; while optimising natural and human resources’(Reference Gold, McBurney, Baumung and Hoffmann6). Balancing health, affordability and environmental dimensions to achieve a sustainable diet needs an optimisation approach that uses mathematical programming like linear programming (LP)(Reference Donati, Menozzi and Zighetti7) and goal programming (GL)(Reference Ribal, Fenollosa and García-Segovia8). Previously, the LP model was used to optimise a sustainable diet for the UK(Reference Macdiarmid, Kyle and Horgan9), New Zealand(Reference Wilson, Nghiem and Mhurchu10), Italy(Reference Donati, Menozzi and Zighetti7) and Sweden(Reference Colombo, Patterson and Lindroos11). Javier Ribal et al. used GL to consider nutritional, climate change and economic aspects in dietary menus for schoolchildren in Spain(Reference Ribal, Fenollosa and García-Segovia8).
Alongside social and economic changes, the food consumption pattern has changed among the Iranian population during recent years(Reference Ghassemi, Harrison and Mohammad12). Despite the total energy intake’s declining trend since 2005, it is still higher than the recommended value. Also, the intake of vegetables, fruits and dairy is lower than the recommended values(Reference Sobhani, Eini-Zinab and Rezazadeh13). On average, the Iranians family food budget has increased in recent years and it is approximately 24 % of income now(14). On the other hand, Iran suffers from an increasing trend of a shortage of water resources and the severity of the drought during the last 30 years(Reference Zarghami, Abdi and Babaeian15,Reference Abarghouei, Zarch and Dastorani16) . Besides, CO2 emission has been increased by about 610 % during 1967–2007(Reference Lotfalipour, Falahi and Ashena17), and the climate is growing warmer since the 1970s(Reference Tabari, Somee and Zadeh18).
A sustainable food basket which is in line with recommendations for a healthy diet and considers the economic and environmental aspect of the diet is essential and efficient to achieve a more sustainable diet in Iran(Reference Sobhani, Rezazadeh and Omidvar19). Therefore, this study was aimed to develop a healthy, low-cost and environmental-friendly food basket for Iran based on current consumption patterns.
Methods
Food data
The Households Income and Expenditure Survey (HIES) data related to the last 3 years (from 2016 to 2018) were used in this study. HIES data are collected yearly by the Statistical Centre of Iran. All private and institutional households in urban and rural areas of the country are the target population of HIES. A three-stage cluster sampling method with strata was used in the Survey(20). The sample size for the whole study period (from 2015 to 2018) was 102 303.
Food cost data of HIES included the amount and price of 194 food items in the household food basket during last month and purchased foods, foods received as gifts or donations or food produced by household members. They were converted to daily amounts. Since the household food basket data were collected for households as the sampling unit, the total household intake should be divided by the number of household members to estimate nutrient intakes for individual household members and be comparable with the recommended amount. However, due to the differences in age, sex and hence energy requirements, family members do not receive an equal share of the food available for consumption(Reference Weisell and Dop21). Therefore, instead of calculating the per capita amount, Adult Male Equivalent (AME) units were calculated for each household member(Reference Weisell and Dop21). AME are the ratio of the energy requirement of a household member of a particular age and sex to the energy requirement of an adult male 18–30 years of age, with moderate physical activity, as recommended by the FAO and WHO(22). Unlike per capita measurements, this measure allows identification of the contribution of various family members to the overall household food consumption pattern(Reference Claro, Levy and Bandoni23). In this study, based on the age and sex of household members, the amount of total AME of the household was calculated. Then, the amount of each food item was divided into total AME of household, and AME of each food item was obtained to have an individual intake amount. Since part of the food purchased is wasted, we used FAO estimated waste percentages for each food group in the consumption step of ‘from supply to consumption chain’ to estimate the real amount of consumed foods(Reference Gustafsson, Cederberg and Sonesson24). Then, NUTRITIONISTIV software that was adapted for the Iranian food composition table was used to assess the energy, macronutrient and micronutrient intakes. Households reporting energy intake of less or more than 3 sd from the average energy intake (n 1803) were excluded from the study.
HIES data included the price of each food item paid by households. The average price paid for 1 g of each food item was used in the models to consider the economic aspect of the sustainable diet.
The Nutrient Rich Food (NRF) index was used as a profile of the quality of diet. NRF index provides an overall nutrient density score based on several nutrients. The nutrient density of foods is defined as the amount of selected nutrients per reference amount of food (100 kcal, 100 g or a serving size)(Reference Drewnowski25). The development of NRF index scores involves several methodological issues, including the selection of key nutrients, the choice of RDA and the basis of calculation (per 100 g, 418·4 kJ or portion sizes)(Reference Sluik, Streppel and van Lee26,Reference Drewnowski, Maillot and Darmon27) . The NRF index has been used to assess Iranian diets in previous studies(Reference Rouhani, Larijani and Azadbakht28,Reference Khankan, Jazayeri and Shidfar29) . In the present study, NRF was calculated in 100 g of food items and based on nineteen nutrients encouraged and three nutrients limited. The positive scores, that is, encouraged nutrients, considered include protein, PUFA, MUFA, dietary fibre, K, vitamin A, vitamin C, vitamin D, vitamin E, thiamin, riboflavin, niacin, vitamin B6, folate, vitamin B12, Mg, Zn, Ca and Fe; the negative scores, that is nutrients recommended to be limited, comprise saturated fat, Na and total sugar(Reference Sluik, Streppel and van Lee26,Reference Drewnowski, Maillot and Darmon27) . By subtracting the negative from the positive sub score, NRF in 100 g of each food item was calculated. RDA introduced by the WHO and FAO was used in the present study(22,30,31) .
Environmental footprint
Water footprint and carbon footprint were used in the present study to consider the environmental dimension of the sustainable diet. The water footprint is defined as ‘the total volume of freshwater that is used to produce the goods and services consumed by an individual or community’. Footprint data for each food item are usually reported as water volume, in cubic metres per tonne (m3/tonne). The water footprint data were available for Iran(Reference Mekonnen and Hoekstra32,Reference Mekonnen and Hoekstra33) . In this research water, footprint data were converted to water volume in cubic metre per gram (m3/g). The amount of water used for any food item was calculated by multiplying the water footprint by the amount of consumption. To calculate the amount of carbon dioxide emission produced during food production, the ‘carbon footprint’ method was used. ‘The carbon footprint is a measure of the exclusive total amount of carbon dioxide emission that is directly and indirectly caused by an activity or is accumulated over the life stages of a product’(Reference Wiedmann and Minx34). We used a global database for carbon dioxide emissions of each food item from ‘BCFNDOUBLEPYRAMIDDATABASE’(35)
Optimised model
LP and GL techniques were used to optimise the sustainable food basket in the present study. The MS Excel (version 2013) Solver add-on was used to incorporate the LP and GL techniques(Reference Darmon, Ferguson and Briend36).
The main elements of LP models are objective (goal), changing variables and constraints. LP models were utilised to obtain the optimal diets, separately, for each goal of the sustainable food basket: (1) diet with maximum NRF, (2) diet with minimum cost, (3) diet with the minimum water footprint and (4) diet with the minimum carbon footprint. Changing variables are those decision variables manipulated to reach the objective by considering constraints to reach the goal. The decision variables in this study were the amount of 194 food items. These amounts are actually the model-produced optimal consumption. The constraints are those conditions that must be fulfilled to reach the objective goal. The model-produced diet constrained to have energy intake, macronutrients and four micronutrients (Ca, Fe, vitamin A and Riboflavin that considered in the Iranian food basket as essential) is equal to the recommended amount(22,30,31) . Also, the salt intake was limited to be <5 mg, according to the WHO salt recommendation(37). The decision variables are also constrained to follow the advised serving size of food groups by the dietary pyramid. Based on Food-Based Dietary Guidelines for Iranians, the recommended amount of servings for ‘bread, rice, pasta, and cereals’: 6–11 (minimum–maximum); vegetables: 3–5; fruit: 2–4; dairy: 2–3 and ‘meat, poultry, fish, eggs, legumes, and nuts’: 2–3(Reference Safavi, Omidvar and Djazayery38). To consider the food preference (cultural acceptance) of the studied population, the decision variables were constrained to vary between 50 % lower and 50 % higher than usual food intake(Reference Gazan, Brouzes and Vieux39). In the case of the dairy were 50 % higher than usual food intake, cut point was less than a recommended serving, the weight of one serving was used as a maximum.
As mentioned above, maximising the NRF index, minimising cost, water footprint and carbon footprint were main goals and their initial values were determined by applying LP for each goal, separately. However, for having the sustainable food basket, these four goals should be considered in one model simultaneously. When there is more than one objective and these objectives may conflict with each other, GL can be used for decision-making(Reference Jones and Tamiz40). In the present study, GP was used to find an optimal solution (‘optimal model’). Each GP has an objective function to be optimised, which usually consists of minimising the unwanted deviations of some goals(Reference Ribal, Fenollosa and García-Segovia8). These goals in the present study were the calculated amount as maximum NRF, minimum cost, minimum water footprint and minimum carbon footprint by LP in the previous step. Negative deviations (d−) are set from the goals to be encouraged including NRF and positive deviations (d+) from those to be limited including cost, water footprint and carbon footprint.
The goals of these constraints are termed the right-hand side (RHS) of each equation. Since different variables have different units (e.g. cost is Rial and water footprint is cubic metres), One Percent Deviation from the Goal for each variable was calculated which showed in the equation by OPDG. A weight (wi) of 12·5 % for water footprint, 12·5 % for carbon footprint, 25 % for cost and 50 % for NRF have been applied based on the suggestion of the experts and researchers(Reference Sobhani, Sheikhi and Eini-Zinab41). LP and GL models can be written this way:
Decision variables
The amounts of each food items in a day (X(1,….,194))
Objective function
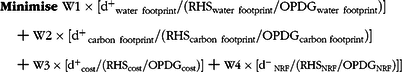 $$\eqalign{
& {\bf{Minimise}}{\mkern 1mu} {\mkern 1mu} {\rm{W1}} \times [{\rm{d}}_{{\rm{water}}\;{\mkern 1mu} {\rm{footprint}}}^{\rm{ + }}{\rm{/}}({\rm{RH}}{{\rm{S}}_{{\rm{water}}{\kern 1pt} {\kern 1pt} {\kern 1pt} {\rm{footprint}}}}{\rm{/OPD}}{{\rm{G}}_{{\rm{water}}{\kern 1pt} {\kern 1pt} {\kern 1pt} {\rm{footprint}}}})] \cr
& {\rm{ + }}\,{\rm{W2}} \times [{\rm{d}}_{{\mkern 1mu} {\rm{carbon}}{\mkern 1mu} {\mkern 1mu} {\mkern 1mu} {\rm{footprint}}}^{\rm{ + }}{\rm{/}}({\rm{RH}}{{\rm{S}}_{{\rm{carbon}}{\kern 1pt} {\kern 1pt} {\kern 1pt} {\rm{footprint}}}}{\rm{/OPD}}{{\rm{G}}_{{\rm{carbon}}{\kern 1pt} {\kern 1pt} {\rm{footprint}}}})] \cr
& {\rm{ + W3}} \times [{\rm{d}}_{{\rm{cost}}}^{\rm{ + }}{\rm{/}}({\rm{RH}}{{\rm{S}}_{{\rm{cost}}}}{\rm{/OPD}}{{\rm{G}}_{{\rm{cost}}}})]{\rm{ + W4}} \times [{{\rm{d}}^{\rm{ - }}}{{\mkern 1mu} _{{\rm{NRF}}}}{\rm{/}}({\rm{RH}}{{\rm{S}}_{{\rm{NRF}}}}{\rm{/OPD}}{{\rm{G}}_{{\rm{NRF}}}})]] \cr} $$
$$\eqalign{
& {\bf{Minimise}}{\mkern 1mu} {\mkern 1mu} {\rm{W1}} \times [{\rm{d}}_{{\rm{water}}\;{\mkern 1mu} {\rm{footprint}}}^{\rm{ + }}{\rm{/}}({\rm{RH}}{{\rm{S}}_{{\rm{water}}{\kern 1pt} {\kern 1pt} {\kern 1pt} {\rm{footprint}}}}{\rm{/OPD}}{{\rm{G}}_{{\rm{water}}{\kern 1pt} {\kern 1pt} {\kern 1pt} {\rm{footprint}}}})] \cr
& {\rm{ + }}\,{\rm{W2}} \times [{\rm{d}}_{{\mkern 1mu} {\rm{carbon}}{\mkern 1mu} {\mkern 1mu} {\mkern 1mu} {\rm{footprint}}}^{\rm{ + }}{\rm{/}}({\rm{RH}}{{\rm{S}}_{{\rm{carbon}}{\kern 1pt} {\kern 1pt} {\kern 1pt} {\rm{footprint}}}}{\rm{/OPD}}{{\rm{G}}_{{\rm{carbon}}{\kern 1pt} {\kern 1pt} {\rm{footprint}}}})] \cr
& {\rm{ + W3}} \times [{\rm{d}}_{{\rm{cost}}}^{\rm{ + }}{\rm{/}}({\rm{RH}}{{\rm{S}}_{{\rm{cost}}}}{\rm{/OPD}}{{\rm{G}}_{{\rm{cost}}}})]{\rm{ + W4}} \times [{{\rm{d}}^{\rm{ - }}}{{\mkern 1mu} _{{\rm{NRF}}}}{\rm{/}}({\rm{RH}}{{\rm{S}}_{{\rm{NRF}}}}{\rm{/OPD}}{{\rm{G}}_{{\rm{NRF}}}})]] \cr} $$
Subject to
 $$\displaylines{
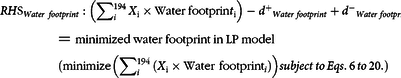
RH{{\rm{S}}_{Water{\kern 1pt} {\kern 1pt} footprint}}:\left( {\sum\nolimits_i^{194} {{X_{\rm{i}}}} \times {\rm{Water}}{\mkern 1mu} \,{\rm{footprin}}{t_{\rm{i}}}} \right) - {d^ + }_{Water{\kern 1pt} footprint} + {d^ - }_{Water{\kern 1pt} footprint} \cr
= {\rm{minimized}}{\mkern 1mu} \,{\rm{water}}{\mkern 1mu} \,{\rm{footprint}}\,{\rm{LP}}{\mkern 1mu} \,{\rm{model}} \cr
({\rm{minimize}}\left( {\sum\nolimits_i^{{\rm{194}}} {({X_{\rm{i}}} \times {\rm{Water}}{\mkern 1mu} {\mkern 1mu} {\rm{footprin}}{{\rm{t}}_i})} } \right)subject{\mkern 1mu} to{\mkern 1mu} Eqs.{\mkern 1mu} 6{\mkern 1mu} to{\mkern 1mu} 20.) \cr} $$
$$\displaylines{
RH{{\rm{S}}_{Water{\kern 1pt} {\kern 1pt} footprint}}:\left( {\sum\nolimits_i^{194} {{X_{\rm{i}}}} \times {\rm{Water}}{\mkern 1mu} \,{\rm{footprin}}{t_{\rm{i}}}} \right) - {d^ + }_{Water{\kern 1pt} footprint} + {d^ - }_{Water{\kern 1pt} footprint} \cr
= {\rm{minimized}}{\mkern 1mu} \,{\rm{water}}{\mkern 1mu} \,{\rm{footprint}}\,{\rm{LP}}{\mkern 1mu} \,{\rm{model}} \cr
({\rm{minimize}}\left( {\sum\nolimits_i^{{\rm{194}}} {({X_{\rm{i}}} \times {\rm{Water}}{\mkern 1mu} {\mkern 1mu} {\rm{footprin}}{{\rm{t}}_i})} } \right)subject{\mkern 1mu} to{\mkern 1mu} Eqs.{\mkern 1mu} 6{\mkern 1mu} to{\mkern 1mu} 20.) \cr} $$
 $$\displaylines{
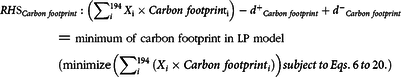
RH{{\rm{S}}_{Carbon{\kern 1pt} {\kern 1pt} footprint}}:\left( {\sum\nolimits_i^{194} {{X_{\rm{i}}}} \times Carbon{\mkern 1mu} {\mkern 1mu} footprin{{\rm{t}}_{\rm{i}}}} \right) - {d^ + }_{Carbon{\kern 1pt} {\kern 1pt} footprint} + {d^ - }_{Carbon{\kern 1pt} {\kern 1pt} footprint} \cr
= {\rm{minimum}}{\mkern 1mu} {\mkern 1mu} {\rm{of}}{\mkern 1mu} {\mkern 1mu} {\rm{carbon}}{\mkern 1mu} {\mkern 1mu} {\rm{footprint}}{\mkern 1mu} {\mkern 1mu} {\rm{in}}{\mkern 1mu} {\mkern 1mu} {\rm{LP}}{\mkern 1mu} {\mkern 1mu} {\rm{model}} \cr
({\rm{minimize}}\left( {\sum\nolimits_i^{194} {({X_i} \times Carbon{\mkern 1mu} {\mkern 1mu} footprin{t_i})} } \right)subject{\mkern 1mu} to{\mkern 1mu} Eqs.{\mkern 1mu} 6{\mkern 1mu} to{\mkern 1mu} 20.) \cr} $$
$$\displaylines{
RH{{\rm{S}}_{Carbon{\kern 1pt} {\kern 1pt} footprint}}:\left( {\sum\nolimits_i^{194} {{X_{\rm{i}}}} \times Carbon{\mkern 1mu} {\mkern 1mu} footprin{{\rm{t}}_{\rm{i}}}} \right) - {d^ + }_{Carbon{\kern 1pt} {\kern 1pt} footprint} + {d^ - }_{Carbon{\kern 1pt} {\kern 1pt} footprint} \cr
= {\rm{minimum}}{\mkern 1mu} {\mkern 1mu} {\rm{of}}{\mkern 1mu} {\mkern 1mu} {\rm{carbon}}{\mkern 1mu} {\mkern 1mu} {\rm{footprint}}{\mkern 1mu} {\mkern 1mu} {\rm{in}}{\mkern 1mu} {\mkern 1mu} {\rm{LP}}{\mkern 1mu} {\mkern 1mu} {\rm{model}} \cr
({\rm{minimize}}\left( {\sum\nolimits_i^{194} {({X_i} \times Carbon{\mkern 1mu} {\mkern 1mu} footprin{t_i})} } \right)subject{\mkern 1mu} to{\mkern 1mu} Eqs.{\mkern 1mu} 6{\mkern 1mu} to{\mkern 1mu} 20.) \cr} $$
 $$\eqalign{
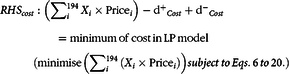
& RH{S_{cost}}:\left( {\sum\nolimits_i^{194} {{X_i}} \times {\rm{Pric}}{{\rm{e}}_i}} \right) - {{\rm{d}}^ + }_{Cost} + {{\rm{d}}^ - }_{Cost} \cr
& = {\rm{minimum}}{\mkern 1mu} {\rm{of}}{\mkern 1mu} {\rm{cost}}{\mkern 1mu} {\rm{in}}{\mkern 1mu} {\rm{LP}}{\mkern 1mu} {\rm{model}} \cr
& ({\rm{minimise}}\left( {\sum\nolimits_i^{194} {({X_i} \times {\rm{Pric}}{{\rm{e}}_i})} } \right)subject{\mkern 1mu} to{\mkern 1mu} Eqs.{\mkern 1mu} 6{\mkern 1mu} to{\mkern 1mu} 20.) \cr} $$
$$\eqalign{
& RH{S_{cost}}:\left( {\sum\nolimits_i^{194} {{X_i}} \times {\rm{Pric}}{{\rm{e}}_i}} \right) - {{\rm{d}}^ + }_{Cost} + {{\rm{d}}^ - }_{Cost} \cr
& = {\rm{minimum}}{\mkern 1mu} {\rm{of}}{\mkern 1mu} {\rm{cost}}{\mkern 1mu} {\rm{in}}{\mkern 1mu} {\rm{LP}}{\mkern 1mu} {\rm{model}} \cr
& ({\rm{minimise}}\left( {\sum\nolimits_i^{194} {({X_i} \times {\rm{Pric}}{{\rm{e}}_i})} } \right)subject{\mkern 1mu} to{\mkern 1mu} Eqs.{\mkern 1mu} 6{\mkern 1mu} to{\mkern 1mu} 20.) \cr} $$
 $$\displaylines{
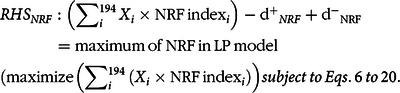
RH{S_{NRF}}:\left( {\sum\nolimits_i^{194} {{X_i}} \times {\rm{NRF}}{\mkern 1mu} {\rm{inde}}{{\rm{x}}_i}} \right) - {{\rm{d}}^ + }_{NRF} + {{\rm{d}}^ - }_{{\rm{NRF}}} \cr
= {\rm{maximum}}{\mkern 1mu} {\rm{of}}{\mkern 1mu} {\rm{NRF}}{\mkern 1mu} {\rm{in}}{\mkern 1mu} {\rm{LP}}{\mkern 1mu} {\rm{model}} \cr
({\rm{maximize}}\left( {\sum\nolimits_i^{194} {({X_i} \times {\rm{NRF}}{\mkern 1mu} {\rm{inde}}{{\rm{x}}_i})} } \right)subject{\mkern 1mu} to{\mkern 1mu} Eqs.{\mkern 1mu} 6{\mkern 1mu} to{\mkern 1mu} 20.) \cr} $$
$$\displaylines{
RH{S_{NRF}}:\left( {\sum\nolimits_i^{194} {{X_i}} \times {\rm{NRF}}{\mkern 1mu} {\rm{inde}}{{\rm{x}}_i}} \right) - {{\rm{d}}^ + }_{NRF} + {{\rm{d}}^ - }_{{\rm{NRF}}} \cr
= {\rm{maximum}}{\mkern 1mu} {\rm{of}}{\mkern 1mu} {\rm{NRF}}{\mkern 1mu} {\rm{in}}{\mkern 1mu} {\rm{LP}}{\mkern 1mu} {\rm{model}} \cr
({\rm{maximize}}\left( {\sum\nolimits_i^{194} {({X_i} \times {\rm{NRF}}{\mkern 1mu} {\rm{inde}}{{\rm{x}}_i})} } \right)subject{\mkern 1mu} to{\mkern 1mu} Eqs.{\mkern 1mu} 6{\mkern 1mu} to{\mkern 1mu} 20.) \cr} $$
 $$\left( {\sum\nolimits_i^{194} {{{{X}}_{{i}}} \times {\rm{Energ}}{{\rm{y}}_{{i}}}} } \right) = 2800\,\rm{Kcal}$$
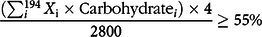 $${{\left( {\mathop \sum \nolimits_{{i}}^{194} {{{X}}_{\rm{i}}} \times {\rm{Carbohydrat}}{{\rm{e}}_{{i}}}} \right) \times 4} \over {2800}} \ge 55{\rm{\% }}$$
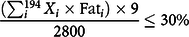 $${{\left( {\mathop \sum \nolimits_{{i}}^{194} {{{X}}_{{i}}} \times {\rm{Fa}}{{\rm{t}}_{{i}}}} \right) \times 9} \over {2800}} \le 30{\rm{\% }}$$
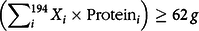 $$\left( {\sum\nolimits_i^{194} {{{{X}}_{{i}}} \times {\rm{Protei}}{{\rm{n}}_{{i}}}} } \right) \ge 62\,g$$
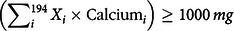 $$\left( {\sum\nolimits_i^{194} {{{{X}}_{{i}}} \times {\rm{Calciu}}{{\rm{m}}_{{i}}}} } \right) \ge 1000\,{{mg}}$$
 $$\left( {\sum\nolimits_i^{194} {{{{X}}_{{i}}} \times {\rm{Iro}}{{\rm{n}}_{{i}}}} } \right) \ge 17\,{{mg}}$$
 $$\left( {\sum\nolimits_i^{194} {{{{X}}_{{i}}} \times {\rm{Vitamin}}\,{{\rm{A}}_{{i}}}} } \right) \ge 600\,{{ug}}$$
 $$\left( {\sum\nolimits_i^{194} {{{{X}}_{{i}}} \times {\rm{Vitamin\,\,Riboflavi}}{{\rm{n}}_{{i}}}} } \right) \ge 1.3\,{{mg}}$$
 $$6 \le {\rm{the\;serving\;size\;of\;cereals\;for}}\mathop \sum \nolimits_{{i}}^{194} {{{X}}_{{i}}} \le 11$$
 $$3 \le {\rm{the\;serving\;size\;of\;vegetables\;for}}\mathop \sum \nolimits_{{i}}^{194} {{{X}}_{{i}}} \le 5$$
 $$2 \le {\rm{the\;serving\;size\;of\;fruit\;for}}\mathop \sum \nolimits_{{i}}^{194} {{{X}}_{{i}}} \le 4$$
 $$2 \le {\rm{the\;serving\;size\;of\;dairy\;for}}\mathop \sum \nolimits_{{i}}^{194} {{{X}}_{{i}}} \le 3$$
 $$2 \le {\rm{the}}\;{\rm{serving}}\;{\rm{size}}\;{\rm{of}}\;{\rm{meat}},\;{\rm{eggs}},\;{\rm{beans}},\;{\rm{and}}\;{\rm{nuts}}\;{\rm{for}}\sum\nolimits_i^{194} {{X_i}} \le 3$$
 $${\rm{Total}}{\mkern 1mu} {\mkern 1mu} {\rm{daily}}{\mkern 1mu} {\mkern 1mu} {\rm{salt}}{\mkern 1mu} {\mkern 1mu} {\rm{intake}}\, \le {\mkern 1mu} {\rm{5}}{\mkern 1mu} {\rm{g}}$$
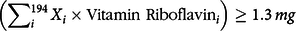
 $$\eqalign{
& 50\% \;{\rm{lower}}\;{\rm{than}}\;{\rm{the}}\;{\rm{usual}}\;{\rm{intake}}\;{\rm{of}}\;{X_i} \le \sum\nolimits_i^{194} {{X_i}} \cr
& \le 50\% \;{\rm{higher}}\;{\rm{than}}\;{\rm{usual}}\;{\rm{intake}}\;{\rm{of}}\;{X_i} \cr} $$
$$\eqalign{
& 50\% \;{\rm{lower}}\;{\rm{than}}\;{\rm{the}}\;{\rm{usual}}\;{\rm{intake}}\;{\rm{of}}\;{X_i} \le \sum\nolimits_i^{194} {{X_i}} \cr
& \le 50\% \;{\rm{higher}}\;{\rm{than}}\;{\rm{usual}}\;{\rm{intake}}\;{\rm{of}}\;{X_i} \cr} $$
where all X i and d variables are nonnegative.
Results
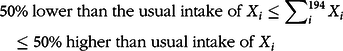
The food consumption data of 100 500 households were used in the present study. The mean of energy intake was 2912·2 (sd 896) kcal. The daily intake status (equivalent to an adult male) of six food groups and twenty-one subgroups (Appendix A) in the studied population, that we called it “usual consumptions”, is presented in Table 1. Also, the calculated amount by four LP models and one GP model for different food groups and subgroups is presented in this table. Water footprint, carbon footprint, cost and NRF index of diet for usual consumption, four LP models and GP model are presented in Table 2. The “Minimum water footprint model” showed a reduction in “bread, cereal, rice, and pasta” group and “meat, poultry, fish, eggs, legumes, and nuts” group and increase in other food groups compared with the usual consumption (Table 1). This model led to a 30 % decrease in total water footprint compared with the usual consumption. Although the NRF index of diet in this model was increased by 1·5 %, the total carbon footprint and cost were increased by 4 % and 15 %, respectively. In the case of the “Minimum carbon footprint model”, the “bread, cereal, rice, and pasta” group and “fats, oils, sugars, and sweets” group were decreased, while other food groups were increased (Table 1). Alongside a 22 % cut in the total carbon footprint, water footprint and costs were decreased by 14 % and 9 %, respectively. However, the NRFINDEX of diet in this model was decreased by 12 % (Table 2). In the Minimum cost model, vegetables, fruits and dairy were increased and other food groups were decreased (Table 1). In addition to a 30 % decrease in the cost of diet, water footprint, carbon footprint and NRF index were declined by 6 %, 2 % and 3 %, respectively, in this model. The “bread, cereal, rice, and pasta” group and “fats, oils, sugars, and sweets” group in the “Maximum NRF index model” were decreased, and other food groups were increased. Although this model led to a 46 % increase in the NRF index, there was a 49 % increase in the water footprint, a 106 % increase in the carbon footprint and a 21 % increase in the cost of the diet. In the “optimal model” which considered all mentioned goals, the “bread, cereal, rice, and pasta” group, the “meat, poultry, fish, eggs, legumes, and nuts” group and “fats, oils, sugars, and sweets group” were decreased. Contrariwise, inside those food groups, cereals, poultry and vegetable oils subgroups were increased. Also, dairy, fruits and vegetable groups were increased. In this model, there was a 14 % reduction in the total water footprint, a 14 % decrease in the total carbon footprint, a 23 % decrease in the cost and a 7 % increase in the NRF index of diet compared with the usual consumption. The percentage change of four dimensions of the sustainable diet in the five mentioned models is shown in the form of a quadrilateral in Fig. 1. To align the changes of the NRF index with other dimensions, the sign of its value changed and used in the figure. As shown in Fig. 1, the “Optimal model”, from every dimension, is appropriate compared with the other models.
Table 1 Comparison between usual consumption and calculated amount by the optimal models
NRF, Nutrient Rich Food.
* Percentage change compared with the usual consumption.
Table 2 Sustainable diet dimensions of usual consumption and the sustainable diet models

NRF, Nutrient Rich Food.
* Percent change compared with the usual consumption.
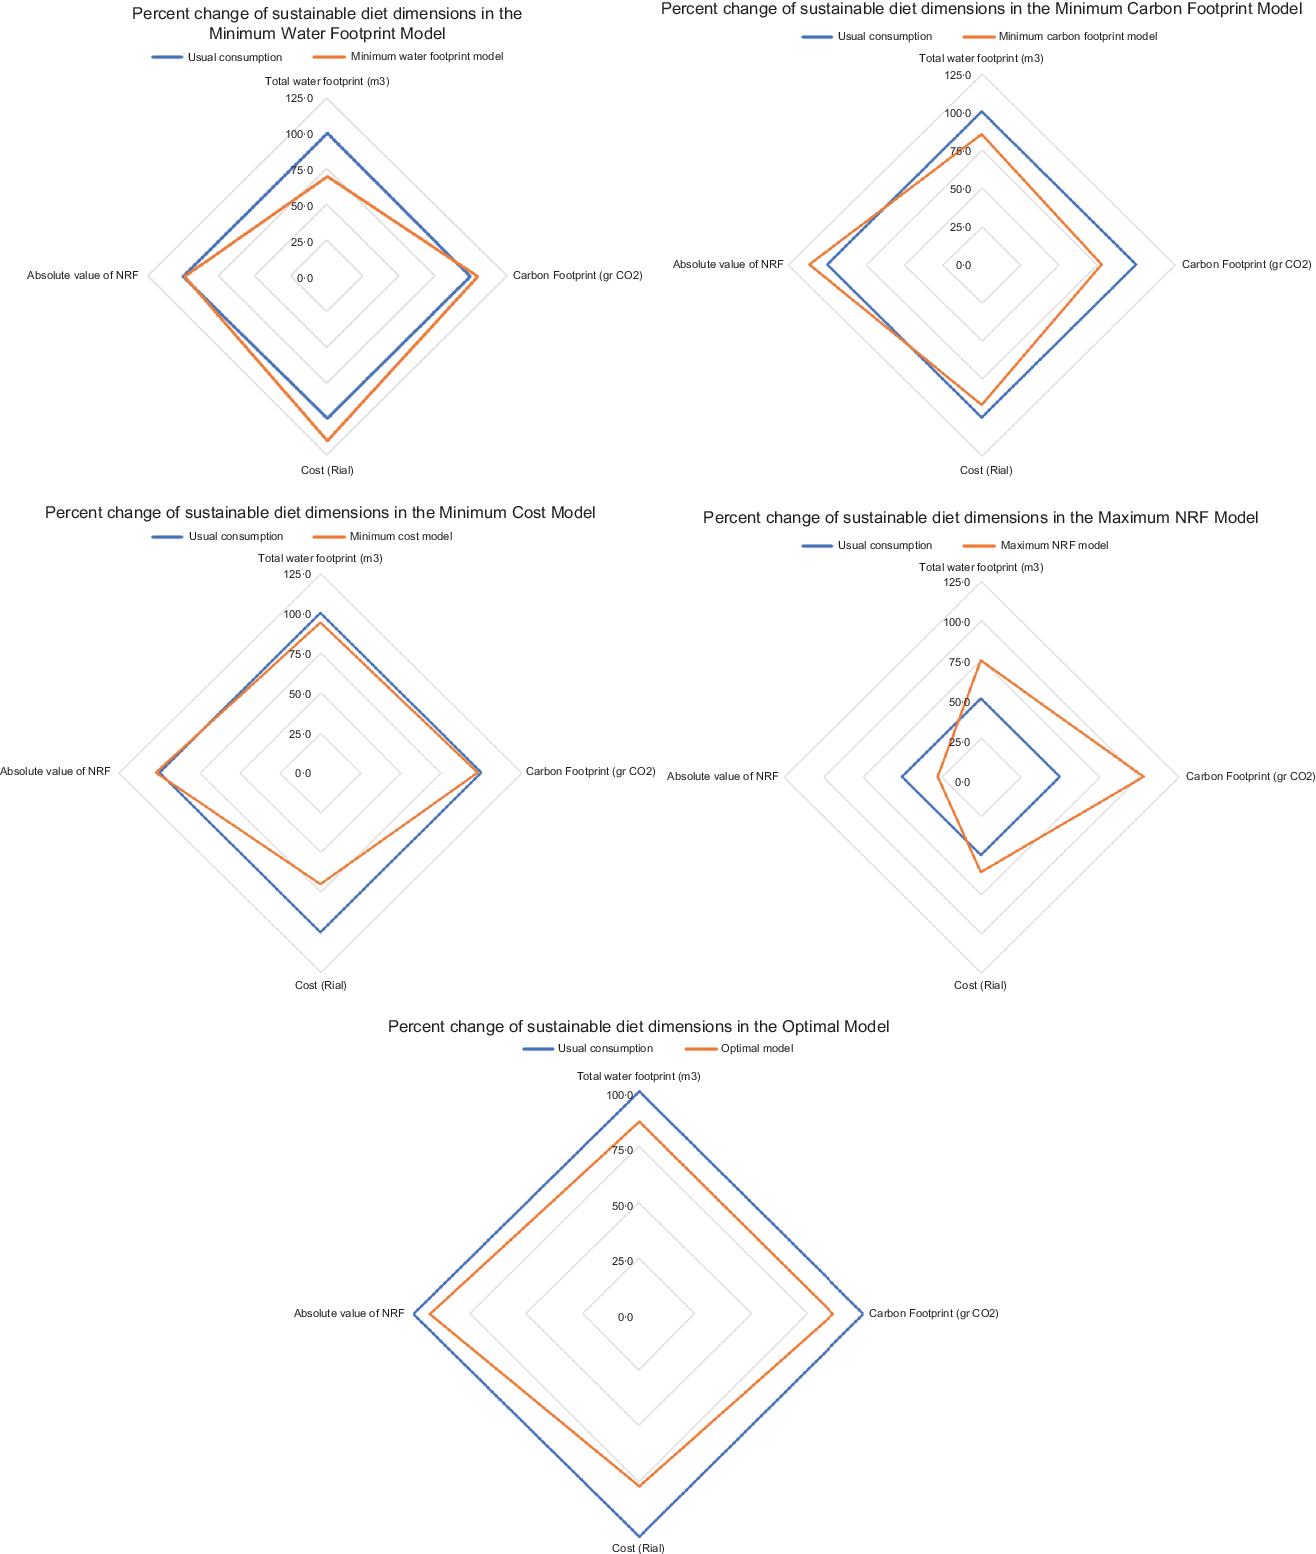
Fig. 1 Percentage change of four dimensions of the sustainable diet models in different models
Discussion
The present study showed that a food basket with a minimum water footprint was healthier than the usual consumption but with the higher cost and carbon footprint. The food basket with a minimum carbon footprint had a lower cost and water footprint but was less healthy than the usual consumption. The minimum cost food basket had lower water and carbon footprint, but it was not healthier than usual consumption either. Also, the most nutritious food basket had a higher water footprint, carbon footprints and cost. Considering all goals in one model (optimal model) showed that a food basket with more consumption of dairy, fruits, vegetables, cereals, poultry and vegetable oils and less consumption of bread, rice and pasta, meat, fish, eggs, legumes, nuts, hydrogenated fats, sugars, and sweets, compared with current consumption, was a healthy, low-cost and environmentally sustainable food basket for the Iranian population.
As shown above, defining just one goal for a diet does not lead to a sustainable diet and at least one of the goals of a sustainable diet cannot be achieved. Similar to the present study, in the study of Parlesak et al., the food baskets that cover both dietary guidelines and nutrient recommendations doubled the cost, while also being culturally acceptable tripled it(Reference Parlesak, Tetens and Jensen42). In the study of Moraes et al., total diet cost was increased when emissions of methane were assumed to be reduced(Reference Moraes, Wilen and Robinson43). Goals sometimes conflict with each other, and the composition of the food basket is changed according to a certain purpose. For example, the amount of ‘Meat, Poultry, Fish, Eggs, Legumes, and Nuts’ food group in the ‘Minimum water footprint’ food basket(Reference Mekonnen and Hoekstra44) and in the ‘Minimum cost’ food basket(Reference Kenny, Fillion and MacLean45) was reduced due to the higher water footprint of meats and the higher price, respectively. However, in the ‘Maximum NRF index model’ due to the higher nutrient content of ‘Meat, Poultry, Fish, Eggs, Legumes, and Nuts’ food group, its quantity was increased(Reference Kenny, Fillion and MacLean45).
Therefore, defining a sustainable food basket needs a balance among different dimensions of sustainability conducted in the optimal model in the present study. This sustainable food basket, while considered cultural preferences, can lead to a 14 % decrease in the total water and carbon footprint, a 23 % decrease in the cost and a 7 % increase in the NRF index. This food basket provides the recommended amounts of energy, macronutrient, Ca, Fe, vitamin A, riboflavin and the advised serving size of food groups by the Iranian dietary pyramid. The sustainable diet modelled in the study of Donati et al. showed that despite a reduction of 51 % in CO2 emissions, 9 % in water consumption and 26 % in land usage compared with the current diet, there was no decrease in the cost of diet and cultural preferences were not considered in the model(Reference Donati, Menozzi and Zighetti7). Lower reduction in carbon footprint in our study compared with this study is because of including the effect of cost and culture in the model. It has been shown previously that while moderate GHGe reduction (≤ 30 %) is compatible with nutritional adequacy and affordability, higher GHGe reductions either impaired nutritional quality or required drastic changes in the usual diet(Reference Perignon, Masset and Ferrari46).Usually to avoid these changes, cultural acceptance or food preference is considered in the sustainable diet models. Without including cultural acceptance in the model, the UK diets could achieve not only 90 % reductions in GHGe but also with drastic changes compared with the usual diet. By considering cultural acceptance in the model, the diet had reached 36 % lower GHGe(Reference Macdiarmid, Kyle and Horgan47).
The present sustainable food basket compared with the usual consumption food basket contained higher dairy, fruits, vegetables, cereals, poultry, and vegetable oils and lower bread, rice and pasta, meat, fish, eggs, legumes, nuts, hydrogenated fats, sugars, and sweets. Similarly, the sustainable diet modelled in the study of Donati et al. decreased meats and increased fruits, vegetables and dairy(Reference Donati, Menozzi and Zighetti7). In the more Sustainable diets in the study of Masset et al., the energy share of plant-based products was increased by 20 % and 15 % compared with the average for men and women(Reference Masset, Vieux and Verger48). In the study of Parlesak et al., the lowest cost was achieved by including the foods that contain high levels of vitamins D, C, B2 and I, K and Ca: whole-grain products, root vegetables, fatty fish and milk(Reference Parlesak, Tetens and Jensen42). In the study of Green et al. in the UK, around 40 % reductions in GHGe achieved by a diet contained fewer animal products and processed snacks and more fruit, vegetables and cereals(Reference Green, Milner and Dangour49). In comparison with the usual consumption in Iran, a healthy and lower water footprint food basket had a greater proportion of energy from fruit and dairy instead of a ‘meat–fish–poultry–eggs’ and ‘bread–cereal–rice–pasta’ food groups(Reference Sobhani, Rezazadeh and Omidvar19). According to the EAT-lancet recommendation, a diet rich in plant-based foods and with fewer animal source foods confers both improved health and environmental benefits(Reference Willett, Rockström and Loken50). Contrary to the results of the present study, EAT-lancet recommendation emphasises higher consumption of legumes and nuts and reduced dairy consumption. Since the average intake of dairy in Iran is far below the recommended level(Reference Sobhani, Eini-Zinab and Rezazadeh13), it should be increased to have a sustainable food basket. Also, in addition to the health and environment dimensions considered in EAT-lancet recommendation, in the present study, cultural and economic dimensions were added to have a sustainable food basket. Therefore, due to the high price of nuts and legumes in Iran, it has been recommended to reduce in the present sustainable diet.
As mentioned above, increase in dairy, fruits, vegetables, cereals, poultry and vegetable oils and decline in bread, rice and pasta, meat, fish, eggs, legumes, nuts, hydrogenated fats, sugars and sweets are needed to have a sustainable diet in Iran. Although the recent study in Iran with HIES data shows that there was an increasing trend in vegetables and fruits intake, the consumption of these food groups was lower than the recommended values. Also, the consumption of dairy decreased in recent years(Reference Sobhani, Eini-Zinab and Rezazadeh13). Although the sustainability impacts of the food sector are widely accepted, efforts to design and implement integrated sustainable food production and consumption policies have been largely absent(Reference Sedlacko, Reisch and Scholl51). For example, the compliance of the Iranian National Nutrition and Food Security Policy (2012–2020) with the components of the framework of the sustainable diet was weak and just only 42 %. In this national document, the social, cultural and political components have received less attention compared with health and nutrition dimensions(Reference Sobhani, Sheikhi and Eini-Zinab41). Hence, policy action in the area of food and nutrition system is required to have sustainable food consumption. To achieve a sustainable food and nutrition system, environmental, cultural and economic dimensions are needed to be considered in food and nutrition policies as well as nutrition and health dimension(Reference Sobhani, Sheikhi and Eini-Zinab41).
The main strength of the present study was taking into account simultaneously nutritional, environmental, affordability and cultural acceptability dimensions of the sustainable diet. The present study showed that LP and GL are valuable tools to determine the sustainable diet. These methods enable food and nutrition decision-makers to determine policies and guidelines, while all aspects are considered. Also, in the present study, the sample size was huge and at the national level. However, a limitation of the present study was that the GHGe data were from the global data and there was no specific data for the carbon footprint of food in Iran. Further, the land footprint was another environmental dimension of the sustainable diet(Reference Donati, Menozzi and Zighetti7) that due to a lack of necessary data for Iran, was not considered in the present study. Also, food consumption was calculated based on Households’ food Expenditure data. Although AME and FAO estimated waste percentages used to estimate individual real consumption, some overestimation is expected.
Conclusions
This study was able to identify a healthy, low-cost and environmentally sustainable food basket for Iran. This sustainable food basket, which considered cultural preferences, provides the recommended amount of energy, macronutrient, Ca, Fe, vitamin A and riboflavin and advised serving size of food groups by the Iranian dietary pyramid. Following the sustainable food basket leads to a 14 % decrease in the total water and carbon footprint, a 23 % decrease in the cost and a 7 % increase in the NRF index. Given the current situation in the food consumption, to achieve sustainable food consumption, policy action in the area of food and nutrition system is required to increase consumption of dairy, fruits, vegetables, cereals, poultry and vegetable oils and reduction in consumption of bread, rice, pasta, meat, fish, eggs, legumes, nuts, hydrogenated fats and sugars. Improving food availability and accessibility and raising public awareness to promote sustainable food consumption are required. Although Iran is an important agricultural producer, food production is not alone able to access food at the household level, mainly because of the pre-existing inequalities in society regarding income, wealth, etc.(Reference Shakoori52). Iran has experienced an economic downturn and rising food prices over the past years(53). Also, the rate of food loss is high in Iran food system(53). Therefore, economic incentives, food assistance, reduction of food loss and design and promotion of the related guidelines are the possible strategies to achieve a sustainable diet.
Acknowledgements
Acknowledgement: The authors would like to thank Dr Nasrin Omidvar for her special support during the study. Financial support: This study was supported by the National Nutrition and Food Technology Research Institute (NNFTRI) (grant number 501) for funding the study. The NNFTRI had no role in the design, analysis or writing of this article. Conflict of interest: ‘None.’ Authorship: H.E.-Z.: Conceptualisation, methodology, data curation and supervision. S.R.S.: Writing-Original draft preparation, methodology, software and investigation. A.R.: Supervision, validation, writing-reviewing and editing. Ethics of human subject participation: This study was conducted according to the guidelines laid down in the Declaration of Helsinki, and all procedures involving human subjects were approved by the Ethical Committees of the NNFTRI and the Faculty of Nutrition Sciences and Food Technology, Shahid Beheshti University of Medical Sciences. Written informed consent was obtained from all subjects.
Supplementary material
For supplementary material accompanying this paper visit https://doi.org/10.1017/S1368980020003729


