


Visual impairment can compromise daily activities and generate a great impact on the social well-being of the people affected by this disability(Reference Kostyra, Żakowska-Biemans and Śniegocka1–Reference Jones and Bartlett6). Acquiring and maintaining good eating habits are frequently more difficult for individuals with vision disorders(Reference Kostyra, Żakowska-Biemans and Śniegocka1,Reference Lappalainen, Saba and Holm7) , since the selection and preparation of meals are often compromised(Reference Kostyra, Żakowska-Biemans and Śniegocka1,Reference Jones and Bartlett6) . Difficulties in tasks such as purchasing foodstuffs autonomously, measuring and portioning foods and pre-preparing and cooking meals can influence their food choices and dietary intake(Reference Kostyra, Żakowska-Biemans and Śniegocka1) and consequently affect nutritional status(Reference Vági, Deé, Lelovics and Lakatos8).
Studies addressing to visually impaired people food consumption and nutrient intake are scarce worldwide, prevailing those focusing on nutritional status(Reference Jones and Bartlett6,Reference Vági, Deé, Lelovics and Lakatos8–Reference Holbrook, Caputo and Perry10) and feeding difficulties(Reference Kostyra, Żakowska-Biemans and Śniegocka1,Reference Lappalainen, Saba and Holm7,Reference Vági, Deé, Lelovics and Lakatos8) . When dietary intake was assessed, the methods employed did not ensure subjects’ autonomy and had questionable validity for this population, such as the 24-h recall(Reference Barreto, Panziera and Sant´Anna11,Reference Baker, Sivyer and Towell12) .
The photographic record of the foods consumed throughout the day could be a quick and practical alternative for assessing dietary intake of visually impaired people, since the photos obtained by these subjects could be presented to the health professional during nutritional care. This strategy has already been validated for non-disabled populations at the international level(Reference Nicklas, O’Nei and Stuf13–Reference Williamson, Allen and Martin17), and the creation of specific protocols for subjects with vision disorders may contribute to the advancement in their nutritional care process, safeguarding their autonomy in health care and providing a more reliable analysis of the diet.
Considering the potential of such an alternative dietary assessment strategy to make health promotion and disease prevention actions feasible in visually impaired people, in particular, obesity and chronic non-communicable diseases(Reference Augestad and Jiang18,Reference Court, McLean and Guthrie19) , which have a high prevalence in this population, the present study aimed to develop and validate protocols for photographed food record directed to visually impaired people using a smartphone.
Materials and methods
Study design, location and population
This study of development and validation of protocols was carried out with people diagnosed with different degrees of visual impairment according to the International Classification of Diseases (ICD)-10(20).
The participants were selected by convenience using the snowball strategy, which is often used to access hard to reach populations(Reference Bernard21,Reference Emerson22) . Initially, subjects attending a philanthropic institution for the rehabilitation of people with vision disorders and a federal university in the capital of Rio Grande do Norte, Brazil, were invited to participate. Then, the individuals enrolled in the study indicated friends and acquaintances with visual impairment, who were invited to participate by the researchers through a face-to-face meeting, or by email, telephone or social network application.
Considering the difficulty of reaching a large sample size in research conducted with visually disabled people(Reference Emerson22), the minimum sample size defined for this study was 30 subjects. As the df increases (n-1), the ‘t’ distribution approaches the normal distribution, and after 30 df, the 95 % confidence limit of the ‘t’ distribution is very similar to the ‘z’ distribution.
Eligibility, inclusion and exclusion criteria
Visually impaired individuals of both sexes, aged 16 years and over, were considered eligible. Subjects with other types of disabilities or health problems, who were unable to use smartphones properly as well as those who had difficulty understanding and executing the procedures as instructed by the researchers (e.g. amputation, paresis or paralysis of upper limbs, hearing loss, mental disorders), were considered ineligible.
To compose the panel of experts to validate the protocols, non-probabilistic intentional sampling was used, aiming to include highly qualified professionals with experience in the studied subject(Reference Grant and Davis23). Were considered eligible professional photographers with experience in food portion photographs and nutritionists with experience in the past 5 years in assessing food consumption, who attended two or more of the following requirements: (1) university professor responsible for teaching dietary intake assessment; (2) health system worker who routinely assesses patients’ food consumption; (3) responsible for researches involving food consumption and dietary intake and (4) experienced in using photo album of food portions/preparations in food surveys or clinical practice. Professionals who did not have regular access to computers and internet were considered ineligible, since the panel of experts would participate exclusively by digital means.
Data collection
The study was divided into three subsequent stages: the development of the protocols by the researchers, the photographic record of standard meals by the visually impaired participants and the validation of the protocols by the panel of experts. All participants involved in the study also responded to a brief interview on socio-economic, demographic and health aspects.
Stage 1: The establishment of the photographic techniques and the writing of the protocols
With the assistance of a professional photographer, and taking into account the internationally validated recommendations for the photographed food record(Reference Martin, Han and Coulon15–Reference Williamson, Allen and Martin17,Reference Christoph, Loman and Ellison24,Reference Ptomey, Willis and Goetz25) , body positions were defined so that the photographs could be easily taken by a smartphone and could have good overall quality.
Protocols were established so that the smartphone could be used in two different positions: facing the meal, with camera at 45º (‘Frontal Photo’), and above the meal, with camera at 90º (‘Aerial Photo’). The body positions and the steps of the protocols to be followed by the visually impaired subjects were defined considering four basic elements:
1. Image quality: they should allow good framing, focus and angle to enable the identification of all food items and their amount.
2. Subject’s autonomy: they should lead to feasible body positions of autonomous performance (i.e. without the help of others) and in any environment (e.g. at home, in restaurants, cafeterias and bars);
3. Subject’s safety: they could not pose a risk of accidents or inconvenience (e.g. dropping objects, spilling food, hitting other people and stumbling);
4. Discretion: they should be performed quickly and discreetly before any meal, without disturbing the individual’s routine or causing embarrassment in any environment.
The protocols’ steps commands were written in order to clarify the visually impaired person how to position the body (trunk, arms and hands) and to enable the identification of the location of the meal on the table and thus adjust the distance and positioning of the smartphone so that it could capture all the items that comprised the meal.
Multiple photo sessions were carried out following the developed protocols, using the standard smartphone (Asus® 16megapixel rear camera) to be used by the participants in Stage 2 of the study. From the comparison of these images with those obtained by a digital camera (Canon® 6D Fullframe, 70 mm lens) following the gold standard technique referenced in the literature(Reference Martin, Correa and Han16,Reference Christoph, Loman and Ellison24) , the researchers defined the protocols whose photographs most resembled the images obtained by the gold standard. Then, they were tested in two subsequent pilot studies to refine the photographic techniques and the steps to be followed: the first with four individuals without vision impairment and the second with four visually impaired subjects.
Stage 2: The photographic record by the visually impaired participants
Three standardised meals were prepared, representing one of the main daily meals of Brazilians: breakfast (coffee with milk, bread with cheese and banana), lunch/dinner (rice, beans, chicken fillet, lettuce, tomatoes, carrots and natural juice) and snack (cake and industrialised juice). The foods chosen for each meal were the most consumed items in the country, disclosed in Brazil’s Family Budget Survey 2008–2009(26) .
Solid foods were placed on a white dinner plate, and the portioning was without overlapping to avoid difficulties in identifying the food items through photographs. Each meal was placed on a separate table at the data collection room, apart from each other. Multiple locations were used for data collection to simulate certain aspects of real life, such as the lack of control over the type of background in the photo and the quality of the lighting.
When entering the room, the participant was instructed on the number of photos to capture (three subsequent photos of each meal, captured with body in exactly the same position indicated by the protocol), on the location of the smartphone’s camera (rear camera, positioned centrally on the top of the device), on the position in which the smartphone should be held when taking photos (horizontally), and, finally, on how to use of the accessibility tool (screen reader) of the standardised smartphone during the photographic record.
With the assistance of the researcher, the participant stood in front of the breakfast table and received the smartphone with the accessibility tool activated. Then, the researcher read the protocol out loud to the participant (Fig. 1), who autonomously performed the procedures as they were informed. After taking the three subsequent photos of breakfast, the participant was directed to the lunch/dinner table, and the researcher read the protocol again to guide the participant’s body position. Finally, the participant was conducted to the snack table, before which the photographs were captured after listening again to the researcher’s instructions.
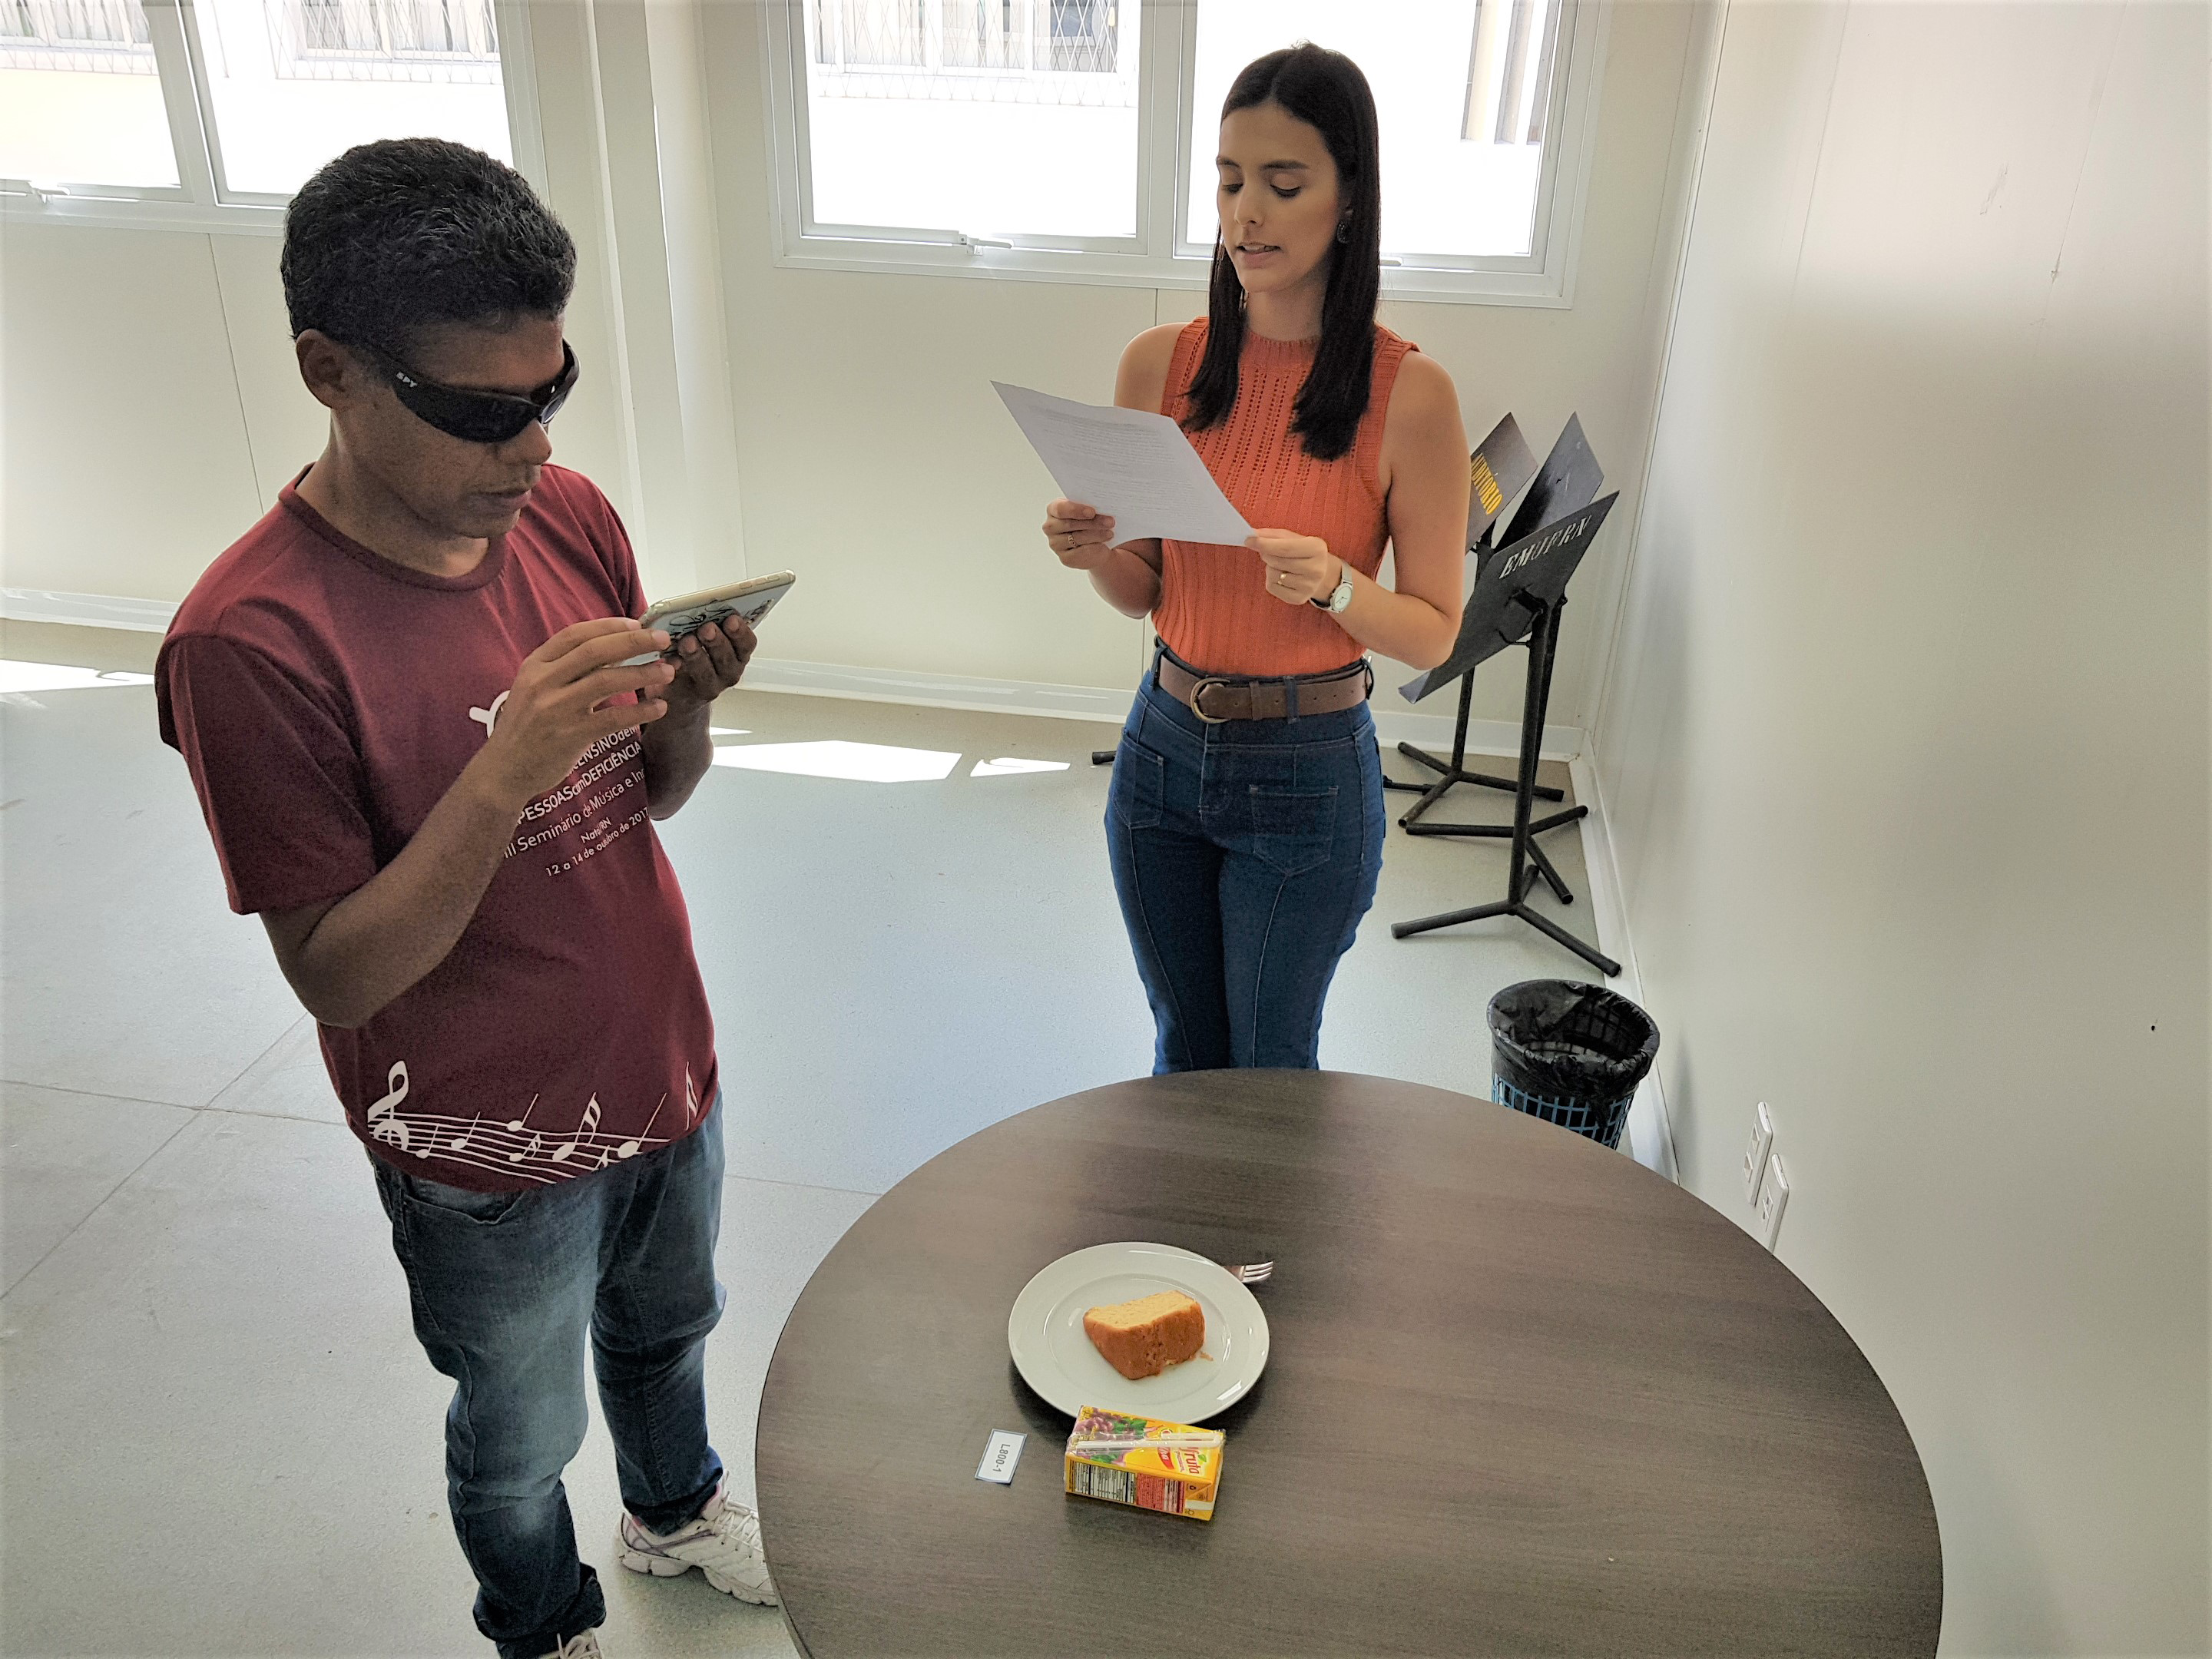
Fig. 1 Researcher reading the protocol out loud to the participant
This cycle was performed twice: the first time for the Frontal Photo and the second time for the Aerial Photo. In both cycles, for each participant, a different random code was placed next to the plate of each meal, aiming to blind the validation process by the panel of experts in the Stage 3 of the study.
Stage 3: The analysis of the photographs by the panel of experts
The panel of experts evaluated, in a single round, the quality of the images obtained by the participants in Stage 2, aiming to answer the following question: the photos captured by visually impaired people would be of sufficient quality to allow the health professional to identify the types of food items, the portion sizes and the total amount of each food present in the meal?
For each meal, among the three subsequent photos obtained by the participant, only the one with the best quality regarding framing, focus and angle was sent for analysis by the expert, according to the researchers’ preliminary assessment. Thus, the experts received an online form containing six photos of each participant (breakfast Fontal Photo, breakfast Aerial Photo, lunch/dinner Fontal Photo, lunch/dinner Aerial Photo, snack Fontal Photo and snack Aerial Photo), randomly distributed. No digital corrections were made to the photos to improve the quality of the images.
Using a progressive Likert scale, the experts informed their degree of agreement (totally disagree, disagree partially, neither agree nor disagree, partially agree and totally agree) with the following nine statements: considering the framing of the photograph, it would be possible to accurately identify the types of food items (1), the portion sizes (2) and the total amount of each food (3) present in the meal; considering the focus of the photograph, it would be possible to accurately identify the types of food items (4), the portion sizes (5) and the total amount of each food (6) present in the meal; and considering the angle of the photograph, it would be possible to accurately identify the types of food items (7), the portion sizes (8) and the total amount of each food (9) present in the meal.
Statistical analysis
Considering the degree of agreement of the expert for each item evaluated (food type, food amount and portion size) in each dimension (framing, focus and angle), the quality of the photos was classified as ‘satisfactory’ (totally agree, partially agree and neither agree nor disagree) and ‘unsatisfactory’ (disagree partially and totally disagree).
The overall quality of the photo for each item evaluated (food type, food amount and portion size) was considered ‘satisfactory’ when the image was considered satisfactory in all the three dimensions (framing, focus and angle). The global quality of the photo was considered ‘satisfactory’ when the image was considered satisfactory for overall quality in all of the three items evaluated (food type, food amount and portion size).
It was performed Kendall’s coefficient of concordance to measure agreement between the experts. Fleiss’ Kappa was used to measure the level of agreement between the experts, since there were more than two professionals on the panel(Reference Landis and Koch27), interpreted as follows: 0·01–0·20 as slight, 0·21–0·40 as fair, 0·41–0·60 as moderate, 0·61–0·80 as substantial and 0·81–1·00 as almost perfect agreement.
Chi-square test was used to compare the proportion of satisfactory photos according to the protocol used (Frontal Photo and Aerial Photo). This test was also used to show whether the proportion of satisfactory photos for the items of overall quality (food type, food amount and portion size) and for global quality differed according to the socio-economic, demographic and health characteristics of the participants. Thus, for each protocol, the frequencies for each of these aspects of photography were presented separately, as well as the P-value for the comparison of the percentages of the categories of variables.
All data analysis was performed using the software Statistical Package for the Social Sciences (SPSS) version 23.0, adopting a level of statistical significance of 5 %. All participants completed data collection and there were no missing data for the variables.
Results
Development of protocols and photographic technique
For the Frontal Photo, the first protocol developed (‘F1’) stated that the photos should be taken with the person in a sitting position, considering that the subject could seat at the meal table and take the food pictures discreetly in public environments. After the pilot tests, this protocol was discarded, since the proximity of the participant’s body to the table precluded reaching the proper angle and distance of the camera from the dish, and therefore photos did not capture all the foods in the meal.
To overcome this limitation, another protocol was proposed (‘F2’), in which photos should also be taken with the person in a sitting position; however, the subject should place his/her hand on the edge of the table in front of his/her body and move the seat back until his/her arm is fully extended in order to increase the distance from the dish and favour the framing. But the seat movement brought multiple inconveniences and security risks to the subject, and so this protocol was also discarded. Then, a protocol for taking pictures with the person in a standing position was developed (‘F3’), which proved in the pilot tests to be satisfactory to obtain images with adequate angle and framing, and proceeded to use in Stage 2 of the study.
For the Aerial Photo, the first protocol developed (‘A1’) stated that the photos should be taken with the person in a sitting position, with the elbows leaning on the table and the hands holding the smartphone over the dish. Yet, the length of the arms and the height of both the table and seat interfered in the photo angle and framing, especially in the shorter subjects, as the camera was very close to the meal. As this protocol was discarded, another one was developed (‘A2’) to capture the photos with the person in a standing position, which was satisfactory to obtain images with adequate angle and framing in the pilot tests, and proceeded to use in Stage 2 of the study.
In the pilot studies, it became evident the subjects’ need to make tactile recognition of the meal items on the table (Fig. 2), and for this reason such a command was inserted in the final protocols to help their spatial orientation (Fig. 3).
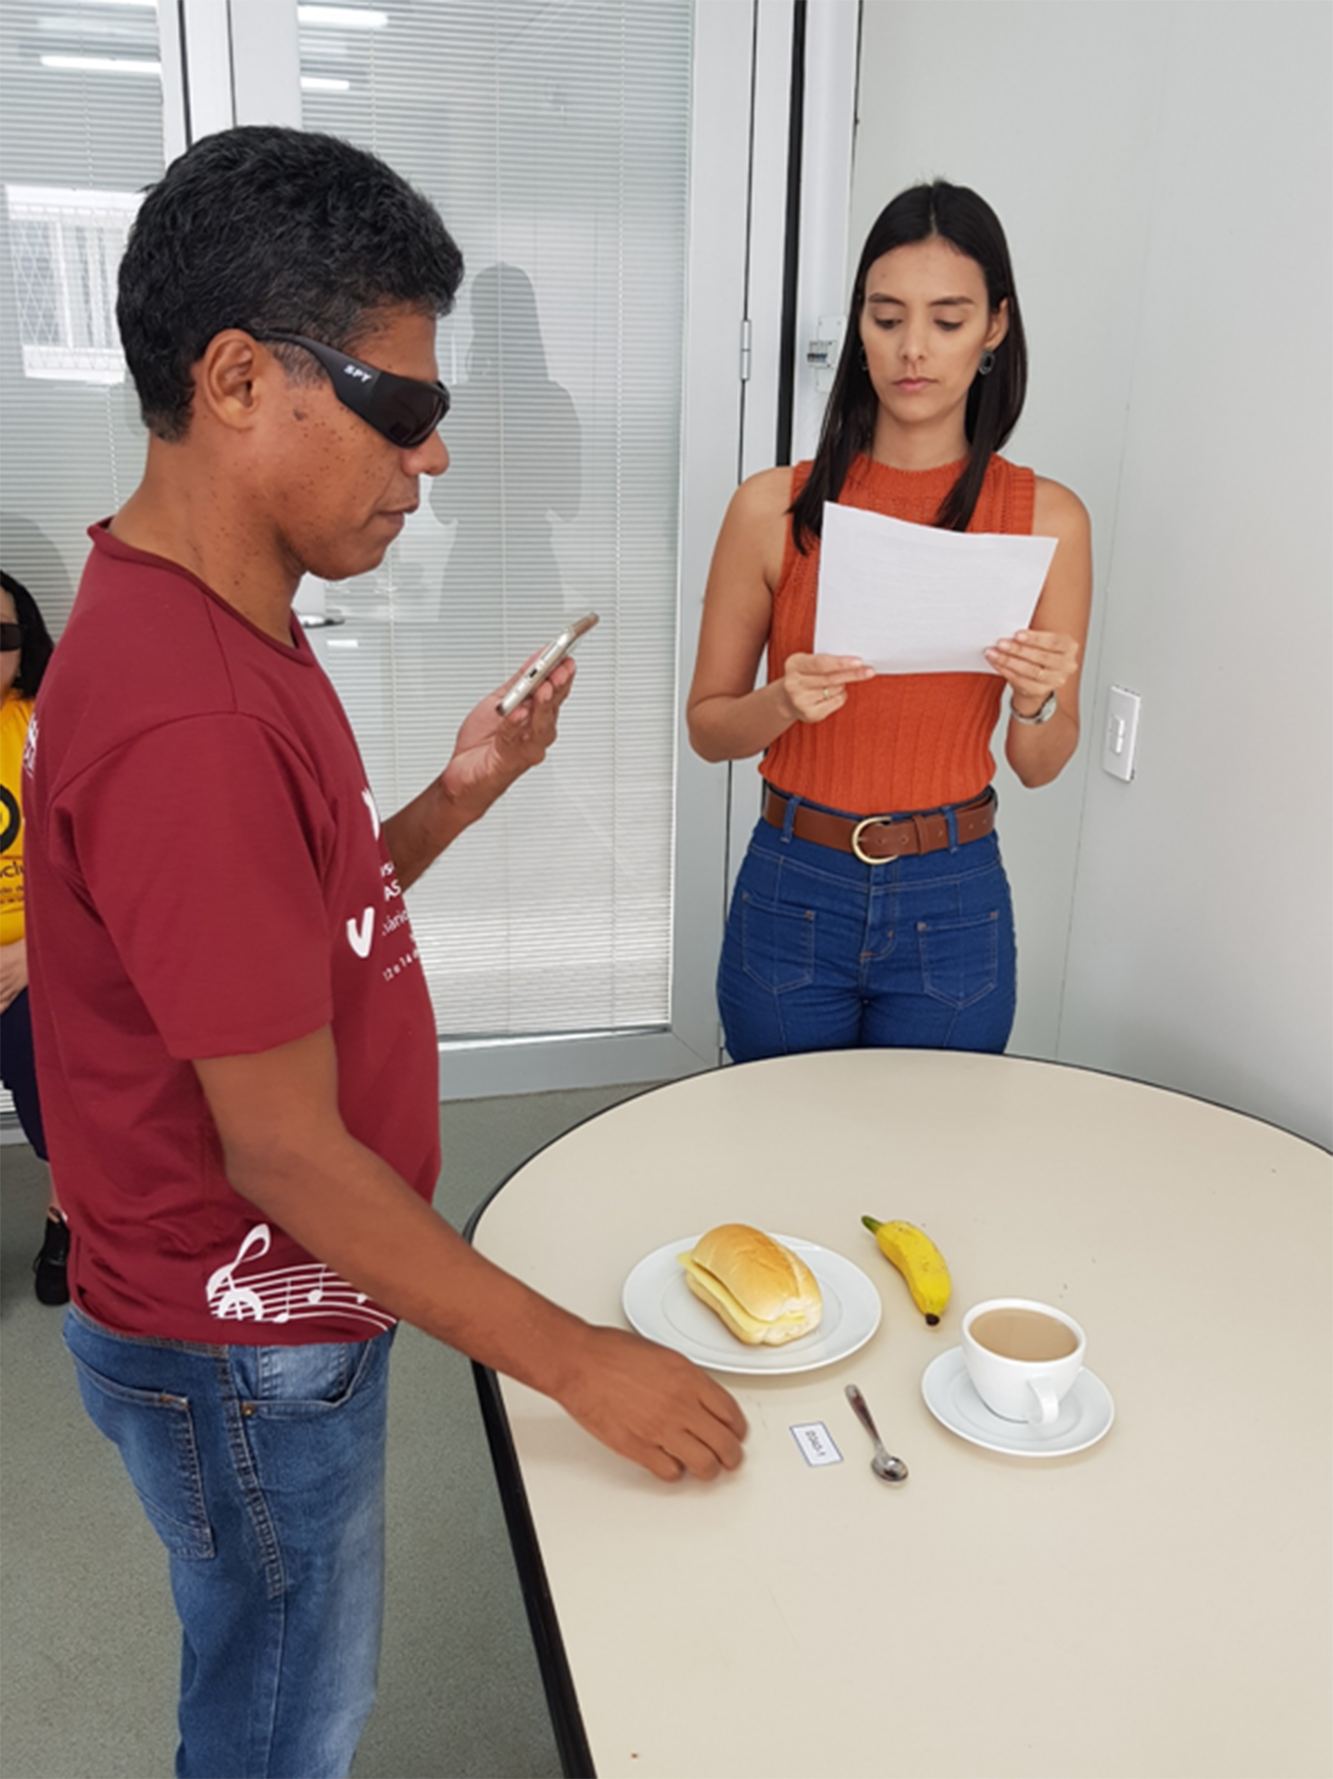
Fig. 2 Tactile recognition of food and utensils by a participant before taking pictures
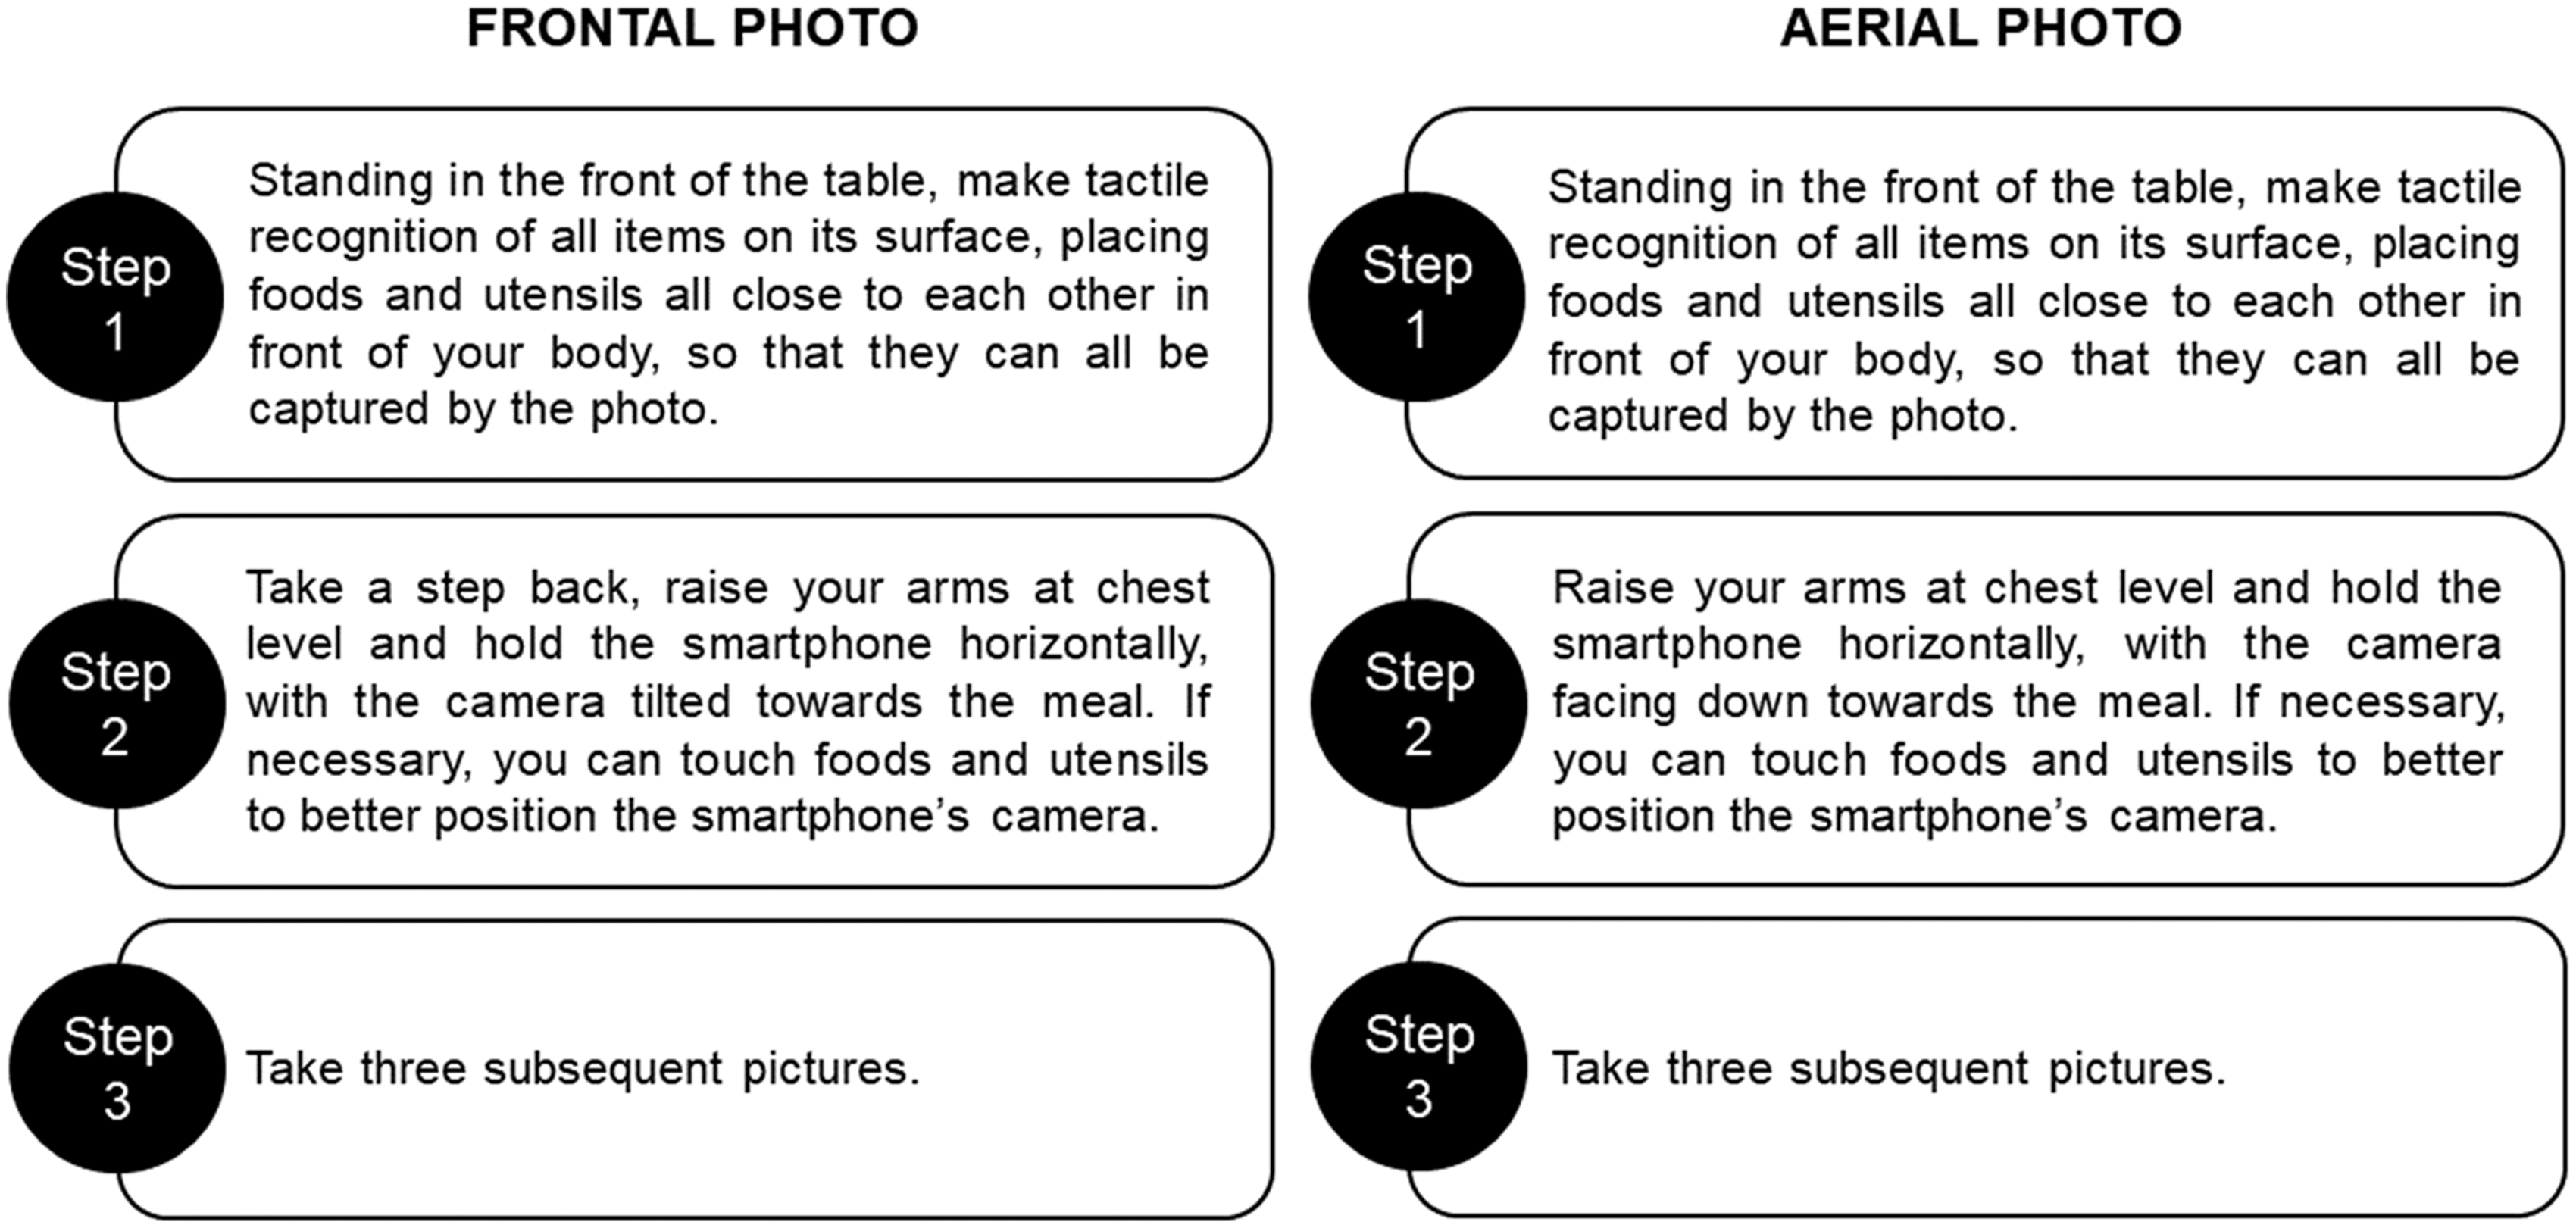
Fig. 3 Protocols for photographed food record directed to visually impaired people
Photographic record by visually impaired people
At this stage of the study, 40 visually impaired subjects were participated, predominantly male (67·5 %), aged ≥ 40 years (57·5 %; Min–Max: 16–70 years) and with high school or higher education (65 %). The majority had no other disability than visual (95 %), was blind (77·5 %) and had visual disorders onset in adulthood (62·5 %) (Table 1).
Table 1 Socio-economic, demographic and health conditions of the visually impaired participants (n 40). Natal, Rio Grande do Norte, 2019
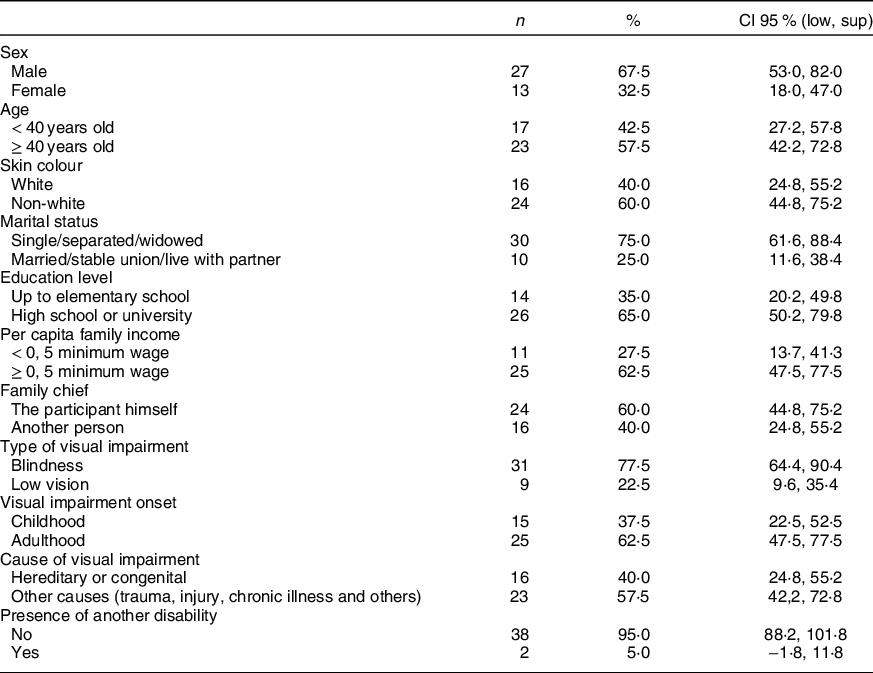
Statistically significant difference was admitted between the categories of the variables when the CI 95 % did not overlap.
Most participants habitually used smartphone-type cell phones (72·5 %); however, half did not use to take pictures using the cell phone camera. Still, the majority (82·5 %) reported not having any difficulties in making the photographic records based on the instructions provided in the protocols. Almost all the difficulties mentioned (85·7 %) were related to how to ensure the framing and focus. Figure 4 illustrates the participants taking photos and the images obtained from the meal.
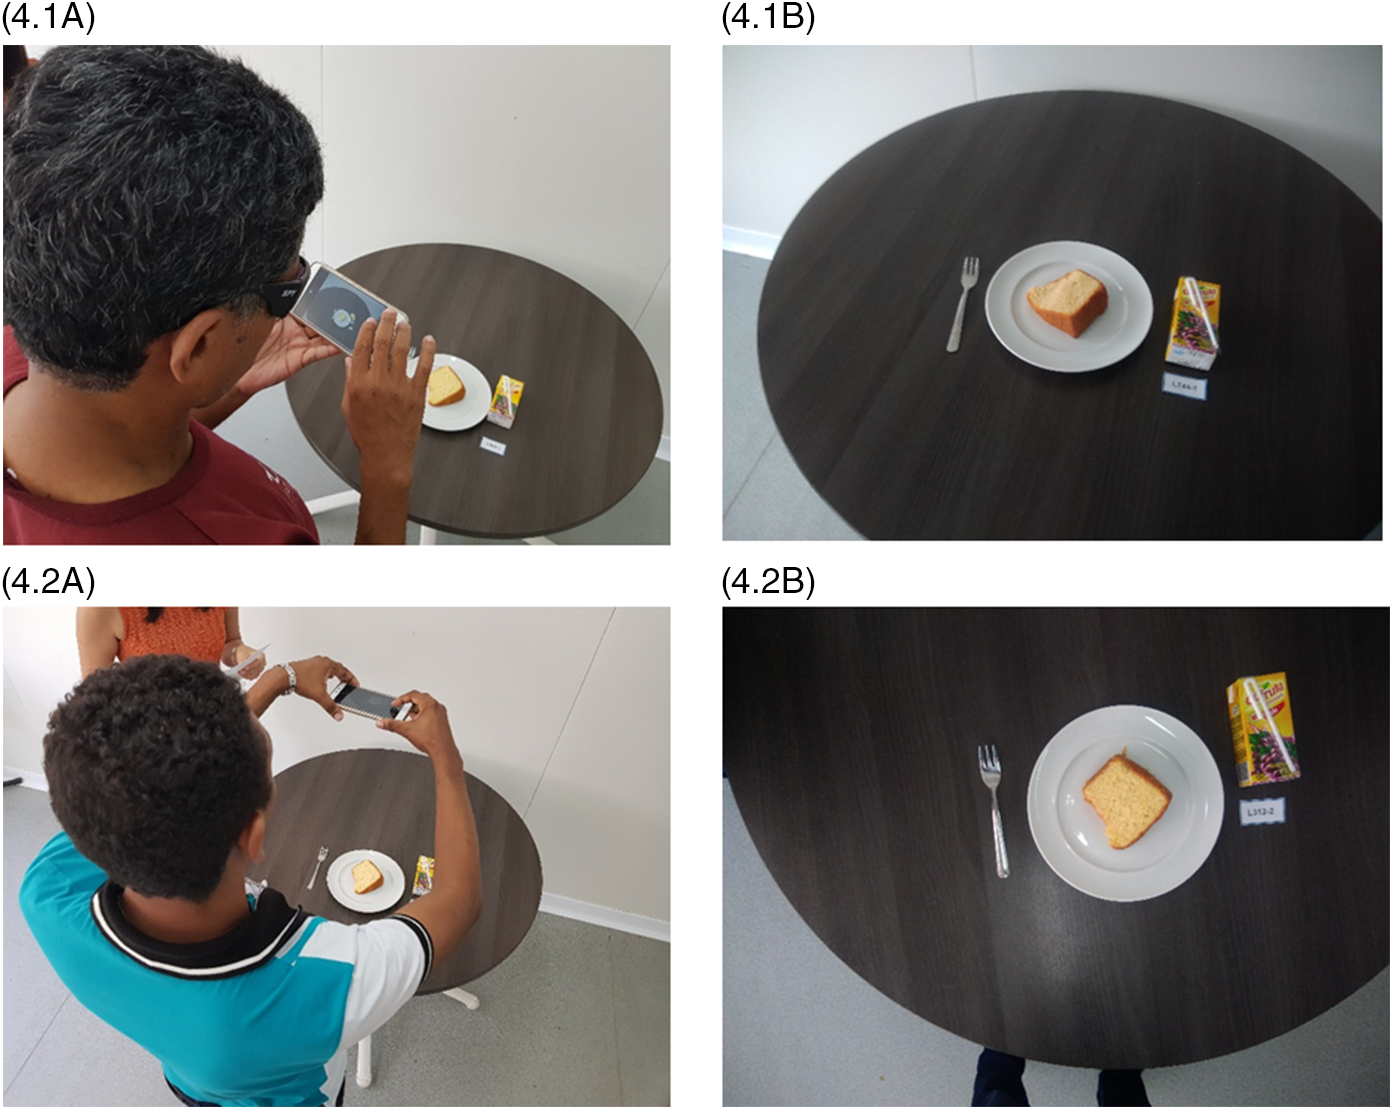
Fig. 4 Participants taking photos and their respective images of the meal, following the Frontal Photo protocol (4.1A, 4.1B) and the Aerial Photo protocol (4.2A, 4.2B)
Analysis of the photographs by the experts
According to the researchers’ preliminary assessment of the three subsequent photos, the one with the best quality regarding framing, focus and angle captured following the Frontal Photo protocol was the third (40·8 %), followed by the first (38·3 %) and the second (20·8 %). For the Aerial Photo protocol, the best photographs were the first (44·2 %), followed by the third (32·5 %) and the second (23·3 %), with no difference between protocols (P = 0·406).
The selected photographs were evaluated by a panel of experts composed of one professional photographer and two nutritionists, predominantly women (75 %), with master’s degree as the highest schooling (75 %), aged ≥ 40 years (50 %) and with professional experience ≥ 10 years (50 %). Each expert evaluated a total of 240 images: n 40 breakfast Fontal Photos; n 40 breakfast Aerial Photos; n 40 lunch/dinner Fontal Photo; n 40 lunch/dinner Aerial Photo; n 40 snack Fontal Photos and n 40 snack Aerial Photos.
Both protocols obtained a high proportion of satisfactory photos for all the items in the three dimensions investigated. Agreement by Kendall coefficient was low for all variables. When overall quality was assessed by Fleiss’ Kappa, there was a substantial agreement between experts that the Frontal Photos would adequately allow the identification of the food type (k = 0·70) and portion size (k = 0·62), while the Aerial Photos would allow both identification of food type (k = 0·68), food amount (k = 0·67) and portion size (k = 0·70). The degree of agreement that the photos presented a satisfactory global quality was moderate for the Frontal Photo (k = 0·43) and substantial for the Aerial Photo (k = 0·64) (Table 2).
Table 2 Proportion (%) of photos captured by the visually impaired participants (n 240) that were considered satisfactory by the experts, according to the image attributes. Natal, Rio Grande do Norte, Brazil, 2019
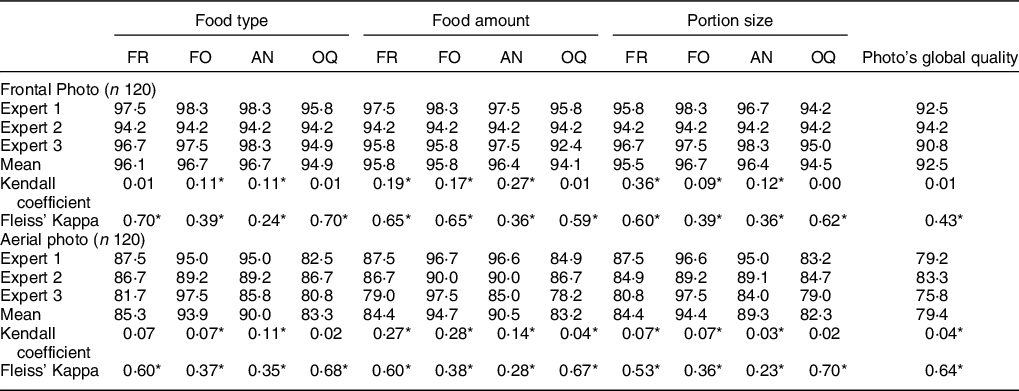
FR, framing; FO, focus; AN, angle; OQ, overall quality.
* P-value < 0·05
When investigating whether the proportion of satisfactory photos differed according to the socio-economic, demographic and health characteristics of the participants, it was identified that Frontal Photos captured by men, subjects aged ≥ 40 years and with a high education level would allow better identification of food type (P = 0·059, P = 0·019 and P < 0·001, respectively), food amount (P = 0·022, P = 0·005 and P = 0·015, respectively) and portion size (P = 0·008, P = 0·007 and P = 0·006, respectively), which was not observed for the Aerial Photos. Participants who used frequently smartphone-type cell phones also obtained better quality images for all these attributes for both protocols (Table 3).
Table 3 Proportion (%) of photos captured by the visually impaired participants (n 240) that were considered satisfactory by the experts*, according to the socio-economic, demographic and health characteristics of the participants and the aspects of photography. Natal, Rio Grande do Norte, Brazil, 2019
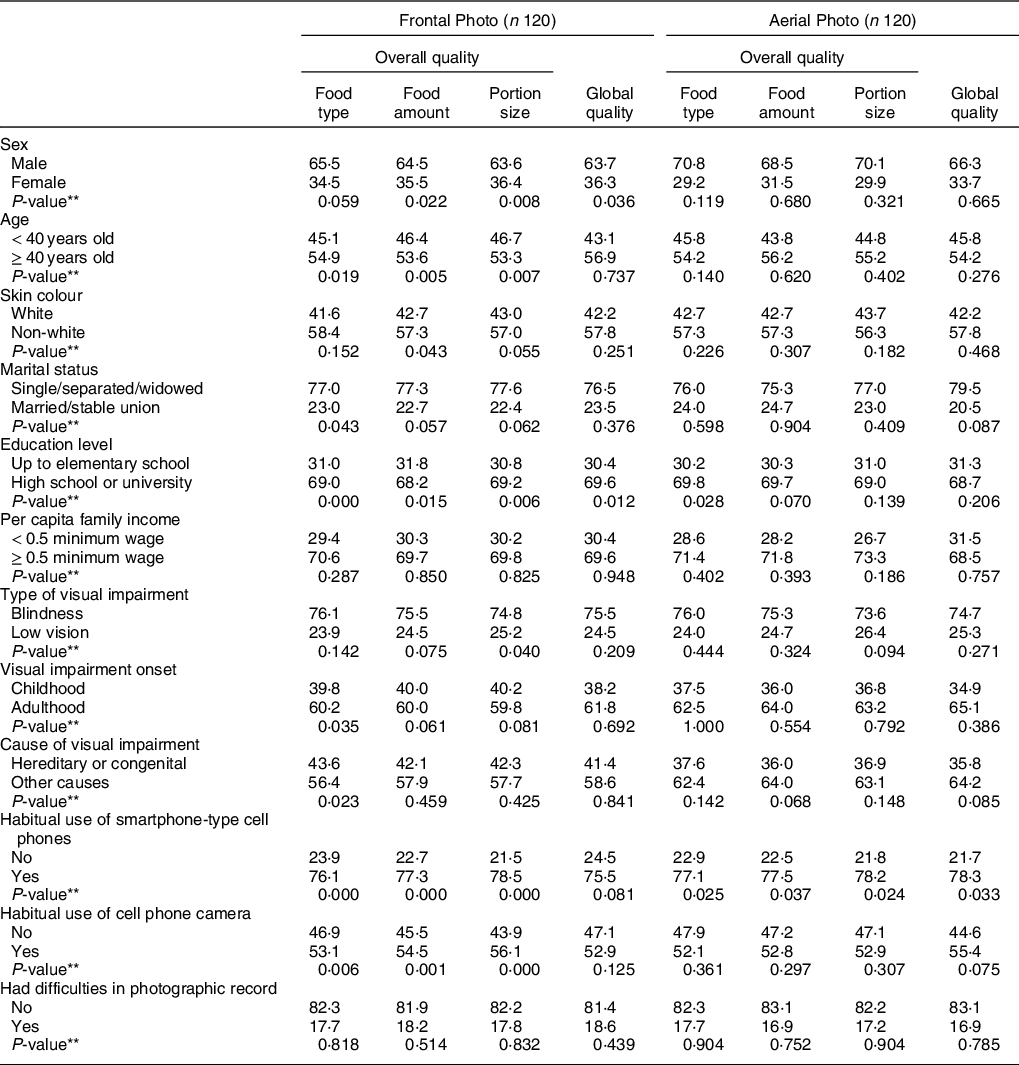
* The proportions of photos captured by the visually impaired participants that were considered unsatisfactory by the experts were not shown in the table but used to calculate the P-value.
** P-value for the comparison of the percentages of the categories of variables according to each aspect of photography, using the chi-square test.
Discussion
In this pioneering study, specific protocols were developed to enable visually impaired people to accomplish photographed food records, taking into account their limitations and possibilities for engaging in this task.
It became evident that, when using the protocols developed in this study, these subjects were capable to capture satisfactory photographs of meals regarding framing, focus and angle, enabling the assessment of their dietary intake by a health professional. This finding corroborates the study by Christoph et al. (Reference Christoph, Loman and Ellison24), which found concordant results between the experts regarding the identification of the foods selected for consumption and portion size in non-disabled people photographed food records.
Two different angles were tested, and the Aerial Photos presented higher global quality of the images than the Frontal Photos. To better interpret this outcome, it is important to take into account that visually impaired subjects need references to maintain their spatial orientation, defined as the ability to use the information captured through the senses to determine body’s position in space in relation to objects in the environment(Reference Sleeuwenhock, Boter and Vermeer28) . Although most of the participants did not report difficulties in making the photographic records based on the instructions provided in the protocols, following the Aerial Photo protocol was easier, since the smartphone’s camera should be simply facing down towards the meal. In the Frontal Photo protocol, the need to tilt the smartphone’s camera to towards the meal in order to reach a 45º angle may have led to a little confusion in spatial orientation.
Another finding that brings more reflection on the spatial orientation and the ability to achieve the correct body positioning based on the protocols was the definition of the best of the three subsequent photographs obtained for each meal in the preliminary assessment. For the Aerial Photos, the best images were mainly the firsts, indicating that this protocol may to be more feasible since the visually impaired subjects did not need many attempts to take a good picture. In contrast, for the Frontal Photos, the best images were mainly the lasts.
Studies that use photography to assess food consumption are basically concerned with the camera’s angle in relation to food and its distance from the meal(Reference Martin, Han and Coulon15–Reference Williamson, Allen and Martin17,Reference Bernard21,Reference Christoph, Loman and Ellison24,Reference Swanson29) . Although visual impairment is not an impediment for taking pictures(Reference Bacci30) , people with this disability generally photograph human figures and landscapes, and rarely food. And in this context, their concern with the framing, focus and angle is secondary, since the most important thing for them is the photo itself, as it represents the way they ‘see’ the world(Reference Soldera31) .
Thus, subjects with vision disorders need clear commands regarding the positioning of the body and the camera, since they cannot adopt the same visual cues used by non-disabled persons when taking pictures. It is essential for them to wisely use the remaining senses to photograph(Reference Bacci30) , and the suggestion for using tactile recognition of the foods and utensils was inserted in the protocols steps to help spatial orientation and improve image quality.
Another major innovation of this study is that the protocols were developed to ensured individual’s autonomy, since their steps can be followed without the help of others. Besides, the photograph eliminates the need for a non-disabled person to describe the visually impaired person’s diet during the nutritional care process, since the health professional himself can check what was really consumed and guarantee a more reliable analysis of the diet. Furthermore, it favours the person’s privacy and bond with the health professional. This is of particular importance, since the demand for public health services by people with disabilities is still low, and visual impairment is the one with the lowest adherence to rehabilitation services(32). When investigating the accessibility of visually impaired people in health services, Medeiros et al. (Reference Medeiros, Costa and Costa33) found that communication with the health professionals was highlighted as one of the main barriers faced, as they usually are unfamiliar with communication strategies and talk to the accompanying person rather than the disabled person.
The use of a standardised smartphone for all participants may be seen as an inherent limitation of this study. As the device had never been used by them and the training in how to handle it was quick, quality images could have been impaired. However, such difficulty was reported only by a small number of participants, possibly because most of them habitually used smartphone-type cell phones. On the other hand, most devices with accessibility features are manufactured similarly, which could justify why the participants who often used smartphone-type cell phones obtained better quality images for all the attributes for both protocols.
Another point for reflection is that this was a validation study conducted under controlled conditions, in which there was no consumption of standardised meals by the participants, and thus it would not be possible to compare photographs of before and after consumption. However, this possible limitation does not weaken the results of this investigation, since its central objective was to evaluate the framing, focus and angle of the images. We believe that the quality of images from photographs with complete meals would not differ from the photographs with only food remains, since the technique followed would be the same.
This study took place in the capital of Rio Grande do Norte, located in the north-east of Brazil, the macroregion with the lowest Human Development Index (0·663)(34). The state of Rio Grande do Norte presents Human Development Index (0·684) and its components (education: 0·597, income: 0·678 and life expectancy: 0·792) above the north-east average(34), but its prevalence of people with disabilities (27·8 %)(35) surpasses the average for the macroregion (26·6 %)(36) and country (23·9 %)(35). Visual impairment is the most prevalent disability in Brazil (18·8 %), being even greater in the north-east region (21·2 %) and in Rio Grande do Norte (22·0 %)(36). Even so, the number of visually impaired people enrolled in the study was still limited, as the snowball sampling technique reached a saturation point in the indications of new participants, which converged to the subjects who had already participated in the data collection. Other limitations inherent to the snowball sampling must also be considered(Reference Bernard21).
Nevertheless, the validation process of these innovative protocols was carried out by a panel of experts with a number of members compatible with international surveys using photographic food records(Reference Williamson, Allen and Martin17,Reference Wang, Kogashiwa and Ohta37,Reference Williamson, Martin and Allen38) and with a bearable a sample size, considering the difficulty to access and enrol a large number of disabled persons in studies like this. Therefore, such protocols can be considered the best tool so far to autonomously assess the food consumption of visually impaired people, with the potential to be used both individually in nutritional assistance and in epidemiological studies, after being validated in uncontrolled circumstances for these purposes.
Conclusion
The protocols for photographed food record directed to visually impaired people developed in this study are feasible and the quality of the images obtained if sufficient to allow the health professionals to identify the types of food items, the portion sizes and the total amount of each food present in the meal, particularly for the Aerial Photos. Thus, this work may be considered the cornerstone of the use of the photographed food record in populations with visual disorders, evidencing that such strategy can provide a more reliable assessment of these subjects’ dietary intake, with information obtained safeguarding their autonomy and privacy, and avoiding communication barriers with health professionals during nutritional assistance.
Based on the results of the present study, further investigations can be carried out using the photographed food record, validating its use by visually impaired people in different scenarios.
Acknowledgements
Acknowledgements: We thank the Music School of the Federal University of Rio Grande do Norte (EMUFRN) and the Institute of Education and Rehabilitation of the Blind (IERC) of Rio Grande do Norte for the collaboration during the data collection for this study. Financial support: This work was supported by the Coordenação de Aperfeiçoamento de Pessoal de Nível Superior – Brazil – CAPES (Coordination for the Improvement of Higher Education Personnel) – financing code 001, according to Ordinance No. 206, of 4 September 2018. Conflict of interests: The authors declare that they have no known competing financial interests or personal relationships that could have appeared to influence the work reported in this paper. Authorship: Borges TLD performed data collection, analysis, discussion of results and writing of the article. Lima MFS, Lima SCVC and Bagni UV contributed to the analysis of the results and critical review of the content and final writing of the article. Ethics of human subject participation: This study was conducted according to the guidelines laid down in the Declaration of Helsinki, and all procedures involving research study participants were approved by the Research Ethics Committee of the Onofre Lopes University Hospital of the Federal University of Rio Grande do Norte (opinion 2·932·978; CAAE: 97423318·7·0000·5292). Written informed consent was obtained from all subjects.


