


Worldwide prevalence of childhood obesity has significantly increased in the last decades(Reference Viner and Cole1). Overweight and obesity during childhood and adolescence have been associated with immediate and long-term negative health consequences. There is compelling evidence showing that obesity at a young age increases the risk of being obese in adulthood, which results in higher risk of mortality and disability(Reference Bjørge, Engeland and Tverdal2). Moreover, obese children are more likely to suffer from depression, low self-esteem, eating disorders and anxiety(Reference Morrison, Shin and Tarnopolsky3,Reference Halfon, Larson and Slusser4) .
High consumption of ultra-processed foods is an important contributor to childhood obesity(Reference da C Louzada, Baraldi and Steele5,Reference Asfaw6) , increasing the risk of non-communicable diseases such as CVD, stroke, type 2 diabetes and several types of cancer(Reference Rauber, Campagnolo and Hoffman7). The majority of ultra-processed foods and beverages are highly dense in kilocalories, have high levels of nutrients of concern such as added sugars, saturated fats and Na and at the same time have low levels of beneficial nutrients(Reference Monteiro, Moubarac and Cannon8,Reference Moubarac, Batal and Louzada9) .
Children’s exposure to different marketing strategies of these products, from television advertising to tie-ins with films to strategies using toys, games and contests, has been linked to their consumption and to unhealthy dietary patterns overall(Reference Andreyeva, Kelly and Harris10,Reference Folkvord, Anschütz and Boyland11) . In the case of exposure to TV food advertisements, evidence shows that exposure to advertisements, especially child-directed advertisements, increases children’s buying attempts and requests to parents(Reference Aktaş Arnas12), leads to immediate eating behaviours(Reference Harris, Bargh and Brownell13,Reference Halford, Gillespie and Brown14) and modifies food preferences overtime(Reference Connell, Brucks and Nielsen15), indicating the importance of monitoring the nutritional quality of products advertised on TV.
Colombia exemplifies the changing eating habits taking place across Latin America(Reference Uauy, Albala and Kain16,Reference Popkin and Reardon17) , as well as the increase in the prevalence of obesity and overweight across age ranges in this region. According to a study conducted in Colombia, the consumption of processed and ultra-processed foods is also associated with lower quality nutritional profiles(Reference Cornwell, Villamor and Mora-Plazas18). The prevalence of obesity and overweight among Colombian children ages 5–12 years increased from 18·8 % in 2010 to 24·4 % in 2015(19). Around 80 % of food products available for purchase in Bogotá − the largest Colombian city − exceed recommended levels in one or more of the nutrients identified in the Pan American Health Organization (PAHO) Nutrient Profile Model, which categorises foods and beverages based on excess levels in Na, sugar, total fats, saturated fats or trans-fat or inclusion of non-caloric sweeteners(Reference Mora-Plazas, Gómez and Miles20). In parallel, TV continues to be a heavily consumed medium in Colombia(21) and the most consumed medium among Colombian youth(22). About 80 % of children between ages 5 and 11 years watch TV every day and 13 % do so several times a week(23). About 67·6 % of Colombian children between 6 and 12 years watch TV more than 2 hours per day(19).
Despite the importance of exposure to TV advertising of foods and beverages in influencing children’s diets, few studies have combined advertised product’s nutritional information with television audience ratings data to examine children’s exposure to unhealthy food and beverage advertising. The one study we found of this nature for Colombia counted the number of food ads considered ‘rich’ in sugar, Na and saturated fats based on the UK’s Food Standards Agency guidelines in a sample of 52 h of television programming recorded between 06.00 and 12.30(Reference Mejia-Diaz, Carmona-Garces and Giraldo-Lopez24). The current study found more ‘rich’ ads during the time frames on weekends, which were considered ‘children’s frames,’ compared to weekdays, which were considered ‘general audience frames.’ The current study assesses the nutritional quality of the food products seen by children across television from 06.00 to 22.00 shown within a full year, the food categories to which children are most exposed, and the differences in exposure to TV ads of products exceeding thresholds on PAHO-defined critical nutrients and products that do not exceed thresholds for the nutrients of concern.
Method
Overview
Data for all food/beverage television advertisements shown in 2017, including products featured in each advertisement and child audience ratings for each advertisement, were acquired from the media research company Kantar IBOPE Media. An audience rating is the percentage of a target audience exposed to a specific piece of media content at a given moment. One rating point corresponds to one percent of the total size of the target audience with a television in the home. Thus, a 1·0 rating means that the number of unique viewers for a particular media event constitutes 1 % of the universe of potential television viewers. In the current study, children are the target audience of interest. Advertising data were combined with the nutritional information of the food and beverages available for purchase in grocery stores in Bogotá, Colombia. Below, we describe each of the data sets and the procedures followed to link them together.
Ratings dataset
Advertising data included children’s (4–11 years old) ratings for each instance a food or beverage advertisement shown between 06.00 and 22.00 every day of 2017 in any of the 75 cable and over-the-air TV channels available for viewing in Colombia. A TV commercial instance refers to the showing of a given TV ad at a particular date and time in one of the TV channels included in the data set. Each TV ad had several instances, meaning the ad was shown multiple times over the course of the year.
Information about Colombian children’s exposure – expressed as rating points – was provided for each TV commercial instance in the data set. Rating points were provided for children overall, for male and female children, and for children living in low, mid and high socio-economic status (SES) households. In Colombia, households are classified into one of six social strata based on the internal and external characteristics of the dwelling and its surroundings(25). Stratum 1 corresponds to very low, 2 to low, 3 to mid-low, 4 to mid, 5 to mid-high and 6 to high SES. The lowest three social strata receive subsidies for some public services, including electricity and waste management. The upper two strata pay a contribution to support the subsidies of the lowest three strata. In this data set, low SES refers to children living in households of strata 1, 2 or 3; mid SES refers to children in households from stratum 4 and high SES refers to children from households in strata 5 and 6. Kantar IBOPE calculated the population ratings following the Colombian Administrative Department of Statistics (DANE) population projection estimates. DANE estimates that the population of children between 4 and 11 years old in 2017 was 2 470 700 children. About 50 % of these children were from low SES, 38 % from mid SES and 18 % from high SES. About 51 % were female.
The advertising data set also included information about the date and time of each TV commercial instance, its duration, the TV channel in which the instance was shown, the TV show in which the instance was featured and the advertised product and brand in the instance. A total of 1220 different food and beverages products were advertised across all instances in the data set. Since the interest of this research was children’s exposure to TV ads of food and beverages, all instances of commercials that registered zero child audience rating points were excluded, resulting in a total of 1081 different products advertised across TV commercial instances.
TV ad instances of alcoholic beverages, infant formula and culinary ingredients, such as cooking oil, sugar, honey and salt, were excluded from the data set, resulting in 853 different food and beverage products across the remaining instances. As our unit of analysis was food and beverages products, and in order to link ratings data with each product’s nutritional information, TV ads instances for the same product were grouped as follows. For each unique product, the rating points for each instance of that advertised product were averaged together to create an average ad rating across 2017 for total child audience, male children, female children and children in low, mid and high SES. In addition, the number of TV ads instances for each product was also recorded.
Nutritional data
Nutritional information used for the current study was obtained from nutritional facts panel data collected as part of a larger project involving the University of North Carolina at Chapel Hill, USA, and Pontificia Universidad Javeriana in Bogotá, Colombia. Details of this project are described elsewhere(Reference Mora-Plazas, Gómez and Miles20).
Product names, brands, lists of ingredients and nutritional information were extracted from the labels on food and beverage packages available in the largest retail supermarkets and grocery stores in Colombia in 2016. Based on the nutritional content, each product was classified into one of the following twelve food categories: (1) beverages (e.g. juices, nectars, soft drinks, waters, water ice cream and reconstituted powders); (2) bread and bakery products (e.g. breads, cookies, tortillas and flour arepas); (3) cereals (e.g. cereal bars, breakfast cereals, oatmeal, maize, rice, barley, wheat, pasta and quinoa); (4) convenience foods (e.g. readymade and frozen soups and meals); (5) dairy (e.g. milks, yogurts, kumis and cheese); (6) fish and seafood; (7) fruits, vegetables, nuts (e.g. walnuts, almonds) and legumes (e.g. beans, lentils, peas and chickpeas); (8) meats (e.g. sausages, hams, processed hamburgers and canned meats); (9) sauces, dressings and spreads (e.g. pasta bases, mayonnaise, butter, margarine and vinaigrettes); (10) snack foods (e.g. tubercles, roots, maize and plantain-based foods); (11) sweets (e.g. candies, chocolates) and (12) miscellaneous, like almond and soy-based beverages, or other foods for specific dietary uses.
The Pan American Health Organization (PAHO) Nutrient Profile Model (NP) classification was applied to each product to establish the product’s nutritional quality based on whether the product exceeded threshold levels for the nutrients of concern addressed in the model. The PAHO model is based on the NOVA classification and uses the ingredients and amount of nutrients of concern in food products to classify those products in one of four categories: (1) unprocessed or minimally processed (e.g. natural fruits, vegetables and legumes); (2) culinary ingredients (e.g. oils, salt and sugar); (3) processed (e.g. salted, cured or smoked meat) and (4) ultra-processed products (e.g. soft drinks and sweet or salty packaged snacks)(Reference Monteiro, Cannon and Levy26). Processed and ultra-processed products are classified as exceeding thresholds for nutrients of concern and therefore in need of regulation, if the products contain an: (1) excess of free sugars, when ≥ 10 % of total energy in the product is contributed by free sugars; (2) excess of total fat, when ≥ 30 % of total energy is contributed by total fat; (3) excess of saturated fat, when ≥ 10 % of total energy is contributed by saturated fats; (4) excess of trans-fat, when ≥ 1 % of total energy is contributed by trans-fat; (5) excess of Na, when there is ≥ 1 mg of Na per 1 kcal present in the product or (6) if there is any presence of a non-caloric sweetener ingredient (i.e. an ingredient that contributes sweetness with much fewer calories than sugars). The PAHO model includes any amount of non-caloric sweetener to be of concern and therefore excessive enough to warrant regulation. Thus, all products that exceeded thresholds for free sugars, total fat, saturated fat, Na or trans-fat were considered ‘in excess,’ as were any products containing any amount of non-caloric sweetener. Products that did not meet these criteria as well as unprocessed and minimally processed foods were considered ‘not in excess.’ It is important to note that the nutrition facts panel in Colombia does not report free sugar content of products. Sugar level was therefore estimated applying the method by PAHO to determine sugar content(27).
Linking audience ratings with nutritional data
Advertising data and nutritional data were linked using product names and brands, which appeared in each data set using MS Excel V16.4. All analyses were performed using this same software. A total of 292 products in the advertising data were identified as unavailable for purchase in Colombia – advertising of international products is common on cable TV because the majority of cable TV channels cover several countries in the Latin American region with the same content. These products were excluded from analysis, leaving 561 products.
A total of 347 of the 561 available products were linked to nutritional data based on their availability in the nutritional facts panel dataset. Nutritional information for an additional 70 products was obtained either through new searches undertaken in grocery stores and supermarkets for that product and brand or imputed from the nutritional data of a similar product available in the nutritional facts panel dataset. In total, nutritional information and ratings data were linked for 417 products.
The remaining 144 products listed in the advertising data set did not contain enough specificity (name, brand) to adequately identify the advertised product for a nutritional match. We approached Kantar IBOPE Media to acquire the TV ads with vague products, in order to visually identify the products in those ads. Ads for 119 of the 144 unidentifiable products were available, and these products were ultimately matched with their nutritional information. In sum, we were able to classify the ads of 95·5 % (n 536) of the 561 products advertised by product category and nutritional quality. See Fig. 1 for a flow chart of ads included for analysis. These ads feature only those foods and beverages available for purchase in Colombia, excluding alcoholic beverages, infant formula and culinary ingredients and excluding TV ads with zero child audience rating points (TV ads to which Colombian children were not exposed during 2017).
Statistical analysis
Frequencies were used to describe the number of commercial instances shown across 2017 per product category and for products within each category ‘in excess’ and ‘not in excess’ of PAHO thresholds. Average audience rating per commercial instance was calculated for the total child audience and for male children, female children and children by low, mid and high SES. We also calculated the average child reach per commercial, that is, the average number of unique children exposed to a food/beverage commercial instance in total, by product category, and for products ‘in excess’ and ‘not in excess’ per category. To calculate reach, the average rating of the given instance was multiplied by the population estimate for the respective target child audience (total, male, female, by SES), based on the definition of one rating point = 1 % of the target audience population.
We used the average reach, or average number of unique children exposed to the respective commercial instance (in total, by product category and by ‘in excess’ v. ‘not in excess’ within category) to derive weekly child audience impressions, a metric commonly used in advertising to measure the degree to which a target audience is exposed to media content. Whereas reach is defined as the number of unique viewers exposed to a piece of media content in a given time period (e.g. a day, week or month), impressions are the total number of times the content has been seen by members of the target audience, including unique and repeat viewers. In the current study, weekly impressions were assessed by multiplying the average reach for a product’s TV commercials (total, by product category, for ‘in excess’ and ‘not in excess’ per category) by the total number of instances of commercials for that product across 2017, then dividing this number by 52 (for 52 weeks in a year). This result provides an estimate of the number of child exposures to the respective type of ad (total, by product category, ‘in excess’ v. ‘not in excess’) within a typical week. This metric of exposure has the advantage of not only considering the number of people in a given population exposed to a single food or beverage ad but also considering the frequency in which that type of ad was shown within a week.
Results
Amount and type of foods advertised
A total of 536 products comprised the final data set. The products were advertised in 1327 different TV ads and 232 056 specific commercial instances across the year. The average rating per commercial per instance in 2017 for Colombian children in total was 1·4 %. This average rating converts to an average of 32 848 children exposed to a single food or beverage TV ad shown between 06.00 and 22.00 during 2017. Each TV ad seen by Colombian children was shown an average of 151·3 times (sd = 299·2), or in other words, each ad had an average of 151·3 instances. Ads had an average duration of 21 s. Table 1 illustrates average rating per commercial instance for all children, for males and females and for children based on SES.
Table 1 Average child audience rating and reach (average number of unique children exposed) per commercial instance
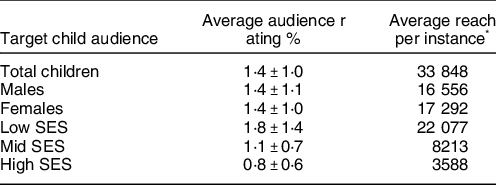
Average audience ratings and average reach (average number of unique children exposed) are per commercial instance. Commercial instance refers to each time a TV ad was shown during 2017 on any TV channel available in Colombia.
* Average reach per instance is calculated by multiplying the average audience rating by the number of children comprising 1 % of the total viewing audience for the respective child gender or SES category.
Of all TV commercial instances, 54·4 % were for products in the beverage and dairy categories. Bread and bakery and cereals followed with 8·2 and 10·6 % TV commercial instances, respectively. The fish and sea food category had the lowest number of TV commercial instances, with only 294 instances (0·1 %).
Table 2 shows the frequency and percentage of TV commercial instances for all products and within each product category that were ‘in excess.’ Of all instances of ads, 207 247 (89·3 %) were of products ‘in excess.’ Most of the TV ads instances in each category were of products ‘in excess.’ The dairy category alone accounted for 31·8 % of all TV commercial instances of all products ‘in excess.’ Beverages accounted for 16·1 % of TV ads instances of all products ‘in excess.’ All instances in the sweets, conveniences foods, fish and sea foods, sauces, dressings and spreads and snack food categories were for products ‘in excess.’
Table 2 Comparison of TV commercial instances by product category and for products ‘in excess’ and ‘not in excess’ within category

Commercial instance refers to each time a TV ad was shown during 2017 on any TV channel available in Colombia. Last column (percentage of all ‘in excess’ instances) is out of the total number of instances with products ‘in excess’ (n 207 247, 89·3 % of all instances) across all product categories.
Exposure to advertised products ‘in excess’ by food category and nutrient
Weekly impressions were derived to assess the number of exposures within the child audience to TV advertising for a given type of product across a typical week. Results for weekly impressions (see Table 3) showed that, on average, TV advertising for any food or beverage product had 349 244 impressions in the Colombian child population within a single week in 2017. We found more exposures for beverages (76 798 impressions/week) and dairy categories (72 059 impressions/week), compared with the number of times TV ads of products from other categories were seen by children. Weekly impressions for bread and bakery product advertising were also among the highest at 54 172 impressions/week.
Table 3 Child audience weekly impressions of TV food/beverage advertising by product category in total and among products ‘in excess’
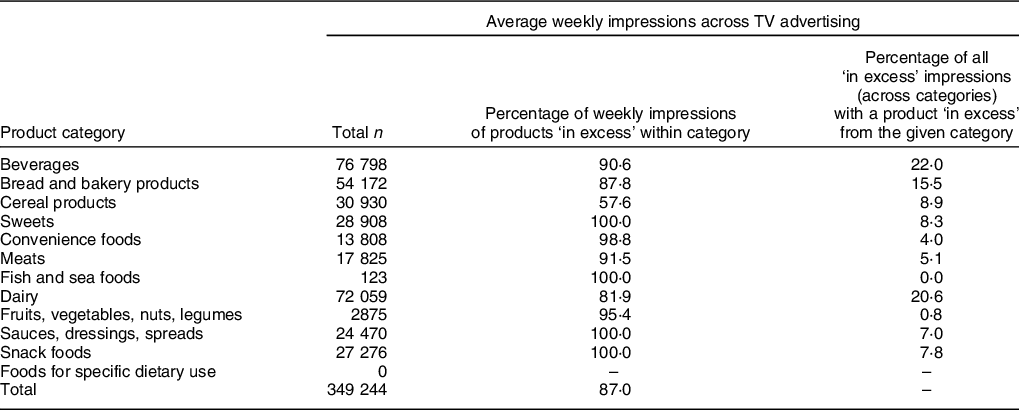
Commercial instance refers to each time a TV ad was shown during 2017 on any TV channel available in Colombia. Last column (percentage of all ‘in excess’ impressions) is out of the total number of impressions for products ‘in excess’ (n 303 842, 87 % of all impressions) across all product categories.
Further analyses of the data showed that weekly impressions for products ‘in excess’ accounted for 87 % of overall weekly impressions across all food categories. Beverages ‘in excess’ accounted for 22 % of overall children’s weekly impressions. Dairy products ‘in excess’ accounted for almost 20·6 % of all child audience weekly impressions, and breads and bakery products ‘in excess’ accounted for 15·5 % of weekly impressions. Weekly impressions for products ‘in excess’ within each category were much higher compared with weekly impressions for TV ads of products ‘not in excess.’ For beverage and diary categories, which were the most advertised products, approximately 91 and 82 % of the weekly impressions within each of those categories, respectively, were for products ‘in excess.’ With the only exception of cereals (57·6 %), weekly impressions within each of the other categories for products ‘in excess’ ranged between 81·9 and 100 %. In other words, the overwhelming majority of TV food/beverage ads to which children were exposed across the year was for products ‘in excess.’
Figure 2 shows the percentage of weekly impressions of products ‘in excess’ by nutrients of concern. As the figure indicates, within a typical week children saw a higher proportion of advertised products classified as excessive in free sugars than products below PAHO-defined sugar thresholds. However, weekly impressions were lower for products ‘in excess’ of the other nutrients of concern. These findings suggest children’s exposure to advertising of products ‘in excess’ is driven by advertising for products excessive in sugar, specifically.

Fig. 1 Data set construction flow chart
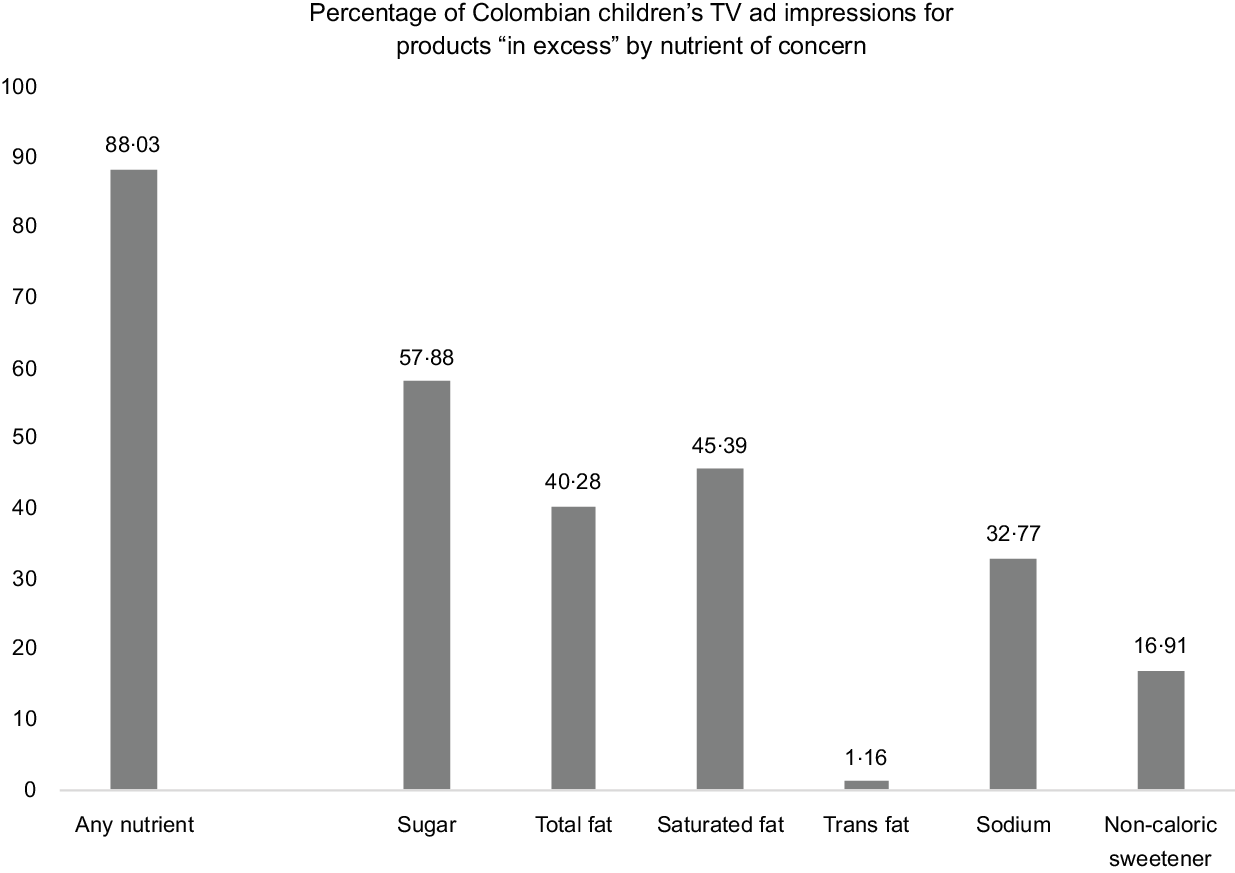
Fig. 2 Percentage of weekly child audience impressions for advertising of products ‘in excess’ based on nutrient
Further analysis looking at the difference in weekly impressions between TV ads for products ‘in excess’ and ‘not in excess’ by each PAHO-identified nutrient within food category showed that beverages, dairy and bread and bakery products were the categories most responsible for children’s exposure to excessive sugar product advertising. More often, the advertising children saw for sweets, cereals and sauces were for products exceeding sugar thresholds. Thus, most of the exposure to advertising of products ‘in excess’ was specific to products with sugar content above PAHO thresholds (see online supplementary material, Supplemental Table 1).
SES and gender differences in advertising exposure
Figure 3 shows the proportion of children’s exposure to advertising of products ‘in excess’ and ‘not in excess’ by child gender and socio-economic status. As the figure shows, both males and females had more exposures to TV ads of products ‘in excess’ than to ads for products ‘not in excess.’ On average, 89 % of females’ weekly impressions were for products ‘in excess.’ Males’ percentage of weekly impressions of products ‘in excess’ was 88 %.
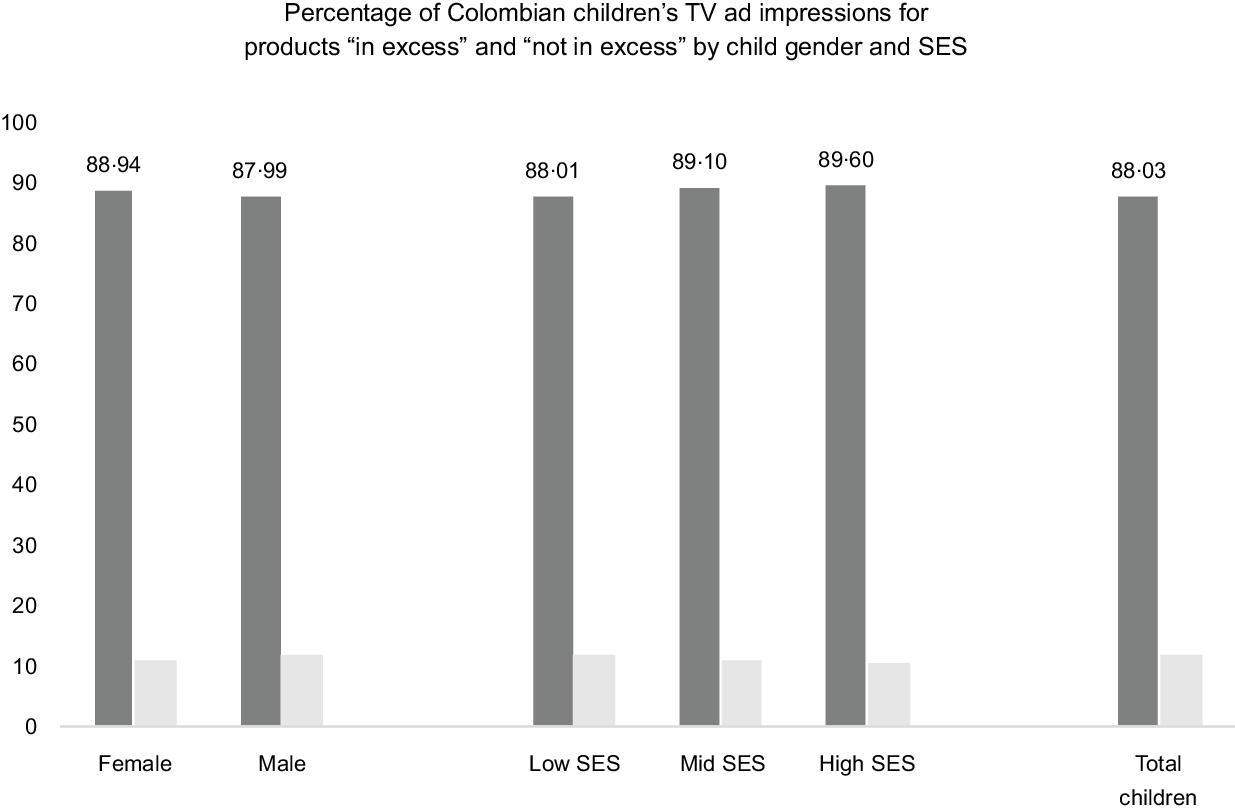
Fig. 3 Percentage of weekly child audience impressions of advertising of products ‘in excess’ v. ‘not in excess’ by child gender and socio-demographic status. ![]() , In excess of;
, In excess of; ![]() , not in excess of
, not in excess of
Similarly, children of low SES (88·01 %), mid SES (89·10 %) and high SES (89·60 %) were more exposed to advertising of products ‘in excess’ compared with products ‘not in excess.’ A supplementary χ 2 Goodness of Fit test was performed to further examine differences in the proportion of ads to which children were exposed that were for products ‘in excess.’ This test assessed whether certain children, based on gender or SES, were being disproportionately exposed to advertising of products ‘in excess.’ The results showed that the difference in the proportion of weekly impressions to advertising of products ‘in excess’ did not differ for males and females, c2(1, 348 862) = 0·013, P = 0·908. No disproportion was found based on child SES, c2(2, 348 862) = 0·0004, P = 0·999. Supplemental Table 2 provides a more detailed account of exposure across all food categories by each SES and gender.
Discussion
The current study examined the nutritional value of the food products advertised on Colombian TV and the degree to which Colombian children are exposed to TV advertising of those food products. Expanding the scope of prior studies that examined food advertising in the Latin American region with samples of recorded television(Reference Mejia-Diaz, Carmona-Garces and Giraldo-Lopez24,Reference Correa, Reyes and Smith Taillie31) , the current study employs the most comprehensive children’s television audience ratings data available for each instance a food or beverage product advertised across every TV channel available in Colombia, including over-the-air and cable TV channels, between 06.00 and 22.00 during a whole year.
Overall, 87·5 % of food products advertised and 89·3 % of all instances of TV food/beverage ads included in the study were for products exceeding PAHO’s threshold in at least one nutrient of concern. These findings corroborate prior research(Reference Mejia-Diaz, Carmona-Garces and Giraldo-Lopez24) that suggests a higher prevalence of TV ads for unhealthy products in Colombia. Direct comparisons should be made cautiously, as differences exist between studies in the application of nutritional models and in their sampling strategies(Reference Kelly, Vandevijvere and Ng28–Reference Gunderson, Clements and Benjamin Neelon30). Nonetheless, our findings would situate Colombia among the countries with a higher proportion of TV advertising to children for foods low in nutritional quality.
Results indicate that beverages and dairy products were the most advertised product categories during the year. Together, these two categories accounted for 54·4 % of all TV commercial instances in which a food or beverage product was advertised. This is of utmost importance, as 88 % of TV commercial instances of dairy and beverages products were ‘in excess’ of at least one nutrient of concern. Overall, beverages and dairy products accounted for 43·5 % of all products ‘in excess’ of nutrients of concern as identified by PAHO. The prevalence of these two categories as the most advertised on TV reflect what is available for purchase in Colombia(Reference Mora-Plazas, Gómez and Miles20) and might reinforce the tendency to consume products ‘in excess’ within these categories. According to the National Survey on the Nutritional Situation in Colombia, 90·9 % of children aged 5–12 years consume on average 228 g of dairy products daily(19), and 81·8 % consume 274·8 g of sweetened beverages on average. Additionally, 77·8 % of beverages products and 88·9 % of dairy products offered in Colombia having low nutritional quality(Reference Mora-Plazas, Gómez and Miles20).
TV audience ratings – the proportion of unique viewers for a given advertisement out of the total potential television audience – and derivations of weekly audience impressions, which combine the frequency with which an ad was shown with number of unique viewers for each showing, illustrate the extent to which Colombian children are exposed to TV advertising of products ‘in excess,’ compared to healthier products. Children were exposed many more times (307 454) to TV advertising for foods and beverages ‘in excess’ in a week compared to the number of weekly impressions (41 794 in total) estimated for TV advertising of products with nutrients below PAHO-defined thresholds. This increased exposure to ads for products ‘in excess’ was found across all food categories. This result is similar to findings in other Latin American countries, like Chile, showing that children’s exposure to TV ads of products exceeding government-recommended thresholds in energy, sugars, saturated fats and/or Na surpassed exposure to ads of products with nutrients below these levels(Reference Correa, Reyes and Smith Taillie31,Reference Carpentier, Correa and Reyes32) . Whereas only 1 % of children age 4–11 years in Colombia might be exposed to each TV ad instance for a product ‘in excess,’ this percentage is not negligible given the prevalence of products ‘in excess,’ repeated showings within a given week, and the overwhelming majority of TV ads for products ‘in excess,’ leading to overall high levels of exposure to TV advertising for these products.
Specifically, we found higher level of exposure to products ‘in excess’ of sugar, particularly among beverages, dairy and bread and bakery products. These three food categories had the greatest numbers of TV commercial instances and highest number of weekly impressions for products ‘in excess.’ Thus, TV advertisements of beverages, dairy and bread and bakery products require special attention when designing regulatory measures. However, any regulation should also contemplate measures for products in the other food categories, given that most of the TV ads featured products ‘in excess.’
We also found that children were disproportionately exposed to TV advertisements of foods and beverages ‘in excess’ than to products ‘not in excess,’ regardless of the child’s gender or SES. This finding underscores the need to consider all children when developing measures to reduce exposure to marketing of unhealthy foods and beverages, given evidence that children might be particularly susceptible to advertising due to their level of cognitive development(Reference Andreyeva, Kelly and Harris10–Reference Aktaş Arnas12,Reference Halford, Gillespie and Brown14) . We did not find significant differences in the proportion of ‘in excess’ to all food ads to which children were exposed, based on child gender or SES. Nonetheless, several studies have shown that the growing labour participation of parents and safety conditions of low SES neighbourhoods may lead parents to restrict children’s outdoor and extra-curricular activities, replacing them with TV viewing(Reference Harris, Bargh and Brownell13,Reference Kunkel, Mastro and Ortiz33) , thus putting this population at a higher risk of exposure to food advertising overall and to higher amounts of unhealthy food advertising as a results.
We should note that extant evidence suggests that in Colombia, wealth and obesity among children are positively associated(Reference Gonzalez-Casanova34,Reference Buitrago-Lopez, van den Hooven and Rueda-Clausen35) . However, the relation between wealth and weight is reversed among Colombian adults. That is, obesity is growing at a faster rate among adults from lower SES(Reference Kasper, Herrán and Villamor36). It is possible such high exposure to ‘in excess of’ food and beverages TV ads during childhood for all children might influence obesity risk later in life, putting those in lower SES at a higher risk, as children’s exposure to TV food advertisement might shape preferences for and consumption of products ‘in excess’ in adulthood(Reference Connell, Brucks and Nielsen15). More research will be needed to examine how the relationship between advertising, dietary intake, obesity and obesity-related noncommunicable diseases changes across the life span.
In sum, our findings suggest that the Colombian government should recognise children as a special group in need of special consideration and stipulate that advertising should not be harmful or exploitative of their credulity(Reference Hawkes37). Colombia does have self-regulatory guidelines on advertising to children, but research in a variety of countries has shown that industry self-regulation is not always effective in reducing exposure of unhealthy food advertising to children(Reference Taillie, Busey and Mediano Stoltze38). Several organisations have advocated to the Colombian Congress since 2017 for the approval of a legislation aimed at restricting all the forms of unhealthy food marketing targeted to children and adolescents(39). Furthermore, our results support the need to develop a policy in Colombia that will categorise foods based on nutritional quality to guide the identification and reduction of marketing of unhealthy foods. A front-of-package food labelling system is being discussed in Colombia to qualify and identify less healthy foods, with documented lobbying activity by the food industry in opposition to the implementation of this system(Reference Mialon, Gaitan Charry and Cediel40).
For any regulation of TV food advertising to be successful, it is also important to consider public health policies, such as eliminating the use of child-directed characters and other child appeals on labels, the use of nutritional claims, banning the promotion of these products in schools and the inclusion of warning labels on food packages that identify products in excess of sugars, fats and the like. All these could be used to define and/or complement advertising regulations aimed at discouraging the promotion of unhealthy products.
Important to note, our findings are based on an identification of foods and beverages as ‘in excess’ of nutrients specified in PAHO guidelines as being of concern. The application of other nutrition categorisation models might lead to different findings, although previous research has shown that in Colombia, the use of different nutritional profile models leads to similar amounts of products being classified as ‘in excess’ or ‘not in excess’(Reference Mora-Plazas, Gómez and Miles20). Our findings are also limited to TV advertising which constitutes one of many types of marketing vehicles that attract children’s attention(Reference Andreyeva, Kelly and Harris10,Reference Folkvord, Anschütz and Boyland11) . Within this scope, some advertised food products were from other countries and not available for purchase in Colombia. Thus, we could not find their nutritional information. Future research should take products of international origin into account, as children could develop a positive attitude towards these advertised products or the food categories these products represent. These children may then seek out similar unhealthy products in Colombia.
Finally, it is important to note that our results address children’s exposure to food and beverage advertising on TV across all times of day and types of TV programmes for which child audience ratings were available. These results, therefore, include peak child viewing hours and children’s programming, in addition to times and programmes more often considered to be the domain of general audiences or adult viewers, yet which children might be viewing with family members or viewing before sleep(Reference Bleakley, Jordan and Hennessy41–Reference Wood, Skinner and Brown44). Furthermore, we were able to combine information about the frequency with which these TV ads were shown with both child audience ratings for every instance of showing and nutritional information for the products advertised, including product category and nutritional quality, to calculate a robust measure of exposure to food and beverage ads of high and low nutritional value. Because of this broader scope of advertising beyond children’s peak viewing hours or children’s programming, our findings represent an examination that extends beyond a focus on child-directed food advertising.
Conclusion
Rates of childhood overweight and obesity have been rising in Colombia. Exposure to unhealthy food and beverage advertising has been linked in the extant literature to increased dietary intake and obesity risk. We found that children are disproportionately exposed to advertising of foods and beverages excessive in nutrients of concern, primarily for sugars, as defined by PAHO guidelines. This disproportionate exposure is found for children regardless of their gender or low, mid or high SES. To prevent further increases in unhealthy eating and subsequent increases in obesity and related comorbidities, policymakers should consider structural measures to reduce children’s exposure to advertising of products with nutritional profiles identified by global health organisations as warranting regulation.
Acknowledgements
Acknowledgements: The authors thank Bloomberg Philanthropies for financial support and Kantar IBOPE Media for providing the advertising data. The authors also thank Rebecca Kanter for her assistance with developing the data collection system for food categorisation, Donna Miles and Emily Yoon for exceptional assistance with data management, Frances Dancy for administrative assistance, Barry Popkin for general leadership and support and the Carolina Population Center for general support. Financial support: Support comes from Bloomberg Philanthropies and from the Clinical and Translational Science Award program of the Division of Research Resources, National Institutes of Health (UL1TR002489). Funders had no role in the study design, data collection, analysis or interpretation. Conflict of interest: None of the authors have conflicts of interest of any type with the current study. Authorship: A.V. led the study design, data management, preparation, analysis and writing. M.M.P. led the nutritional data analysis. All authors contributed to the study design and manuscript writing. F.R.D.C. contributed to the data preparation and analysis and was responsible for the final manuscript. Ethics of human subject participation: The current study did not involve human subjects, as defined by the Common Rule, HHS Regulation 45 CFR 40·102(f). Therefore, the current study did not undergo IRB review for ethics in research with human participants.
Supplementary material
For supplementary material accompanying this paper visit https://doi.org/10.1017/S1368980020004784


