


Introduction
In the last decade, multi-principal element alloys (MPEAs) have attracted a great deal of attention due to their novel properties such as excellent high temperature strength, exceptional ductility, high corrosion resistance, and good fracture toughness [Reference Zhang1, Reference Kumar2, Reference Lucas3, Reference Zhang4, Reference Tung5, Reference Guo and Liu6, Reference Zhang7, Reference Ye, Wang, Lu, Liu and Yang8]. MPEAs are composed of at least four major base elements, usually in equiatomic proportions, although not mandated [Reference Senkov, Miller, Miracle and Woodward9], making them different from conventional alloys, which are typically based on one or two principal elements and minor amount of the rest of the constituent elements. The key rationale behind this new emerging philosophy of alloying is motivated by entropy stabilization, which improves the stability of disordered phases and suppresses the formation of intermetallics. The multiprincipal elemental composition in MPEA thus provides a unique way to not only access but also manipulate novel material properties not observed in conventional alloys.
While the structural and compositional aspects of MPEA have been widely explored, magnetic properties of these alloys are still in a nebulous phase. In the recent reviews on electrical and magnetic properties of MPEA [Reference Gao10, Reference Tsai11], alloys containing more than 50 at.% of the magnetic elements (Fe, Co, and Ni) were found to be paramagnetic or soft ferromagnetic (FM) with relatively low saturation magnetization and coercivity in comparison with pure iron. On the other hand, in equiatomic MPEA, recent temperature dependent studies done by Schneeweiss et al. [Reference Schneeweiss12] reported that equiatomic CrMnFeCoNi undergoes two magnetic transformations: paramagnetic to spin glass at 93 K and spin glass to FM at 38 K. In a different MPEA system, CrCoNiFeZr, where Cr, Co, Ni, and Fe are equiatomic and Zr is varied from 0.4 to 0.5 at.%, coexistence of two FM phases was observed at lower temperatures and the transition temperature was found to be dependent on the composition [Reference Vrtnik13]. These recent studies highlight complex magnetic properties of MPEA; however, a systematic understanding of magnetism is still lacking in a wide variety of MPEA systems. Furthermore, most of the studies have focused on the bulk samples, and the magnetic behavior of MPEA in thin film form still remains unexplored. Thin film confinement can enhance saturation magnetization and enable tuning of magnetic phases and transition temperature [Reference Gong and Gupta14, Reference Liu, Rata, Chang, Komarek and Tjeng15, Reference Liu, Liu and Zhang16].
In this study, we investigated the magnetic properties of both bulk and thin films of non-equiatomic composition of FeCoMnCrSi-based MPEA. This MPEA family shows coexistence of face centered cubic (FCC) and hexagonal close packing (HCP) phases and has recently gained interest due to its novel structural properties. Li et al. [Reference Li, Pradeep, Deng, Raabe and Tasan17] have reported that both strength and ductility can be improved in this MPEA by controlling the grain size and composition, which could address one of the core issue of loss in ductility during strengthening processes. Our studies show that thin film confinement of FeCoMnCrSi can be utilized to manipulate both structural phases and magnetic behavior. We observe a variation in lattice parameter and relative amount of FCC and HCP phases as a function of film thickness. A four orders of magnitude increase in saturation magnetization was observed going from bulk to thin film. Furthermore, by controlling the film thickness, we were able to tune the transition temperature and saturation magnetization.
Results
Structural characterization
Elemental 2D energy dispersive spectroscopy (EDS) maps of bulk, 500 nm, and 65 nm film samples revealed that the composition was homogeneous up to a spatial resolution of 50 nm and no second phases were observed (shown in Supplementary material). Composition of the 500 nm film was found to be same as the bulk sample and the sputtering target (Fe39.8Co19.92Mn20.52Cr14.77Si5) within the margin of error (±1 at.%). For the 65 nm film, the error was larger (±2–4 at.%) due to low thickness of the film and thus higher background from the substrate.
Figure 1 shows the X-ray diffraction (XRD) pattern collected for all the samples. For the bulk sample, both FCC and HCP phases were observed, as shown in Fig. 1(a). FCC and HCP phases are labeled using square and diamond symbols, respectively. As mentioned earlier, the composition of the sample was found to be homogeneous and no second phases were observed, indicating that both FCC and HCP phases had the same composition. Presence of dual phase, i.e., both FCC and HCP phases, with the same composition has been recently reported in a similar MPEA system (Fe50Co10Mn30Cr10) by Li et al. [Reference Li, Pradeep, Deng, Raabe and Tasan17]. A lattice parameter of a = 3.584 Å ± 0.017 Å was obtained for FCC phase, while for HCP phase, the lattice parameters were calculated to be a = 2.524 Å ± 0.007 Å and c = 4.123 Å ± 0.012 Å. For 500 nm thin film sample, both FCC and HCP phases were observed similar to the bulk sample, although a smaller amount of HCP was present as indicated by the lack of lower intensity Bragg peaks. Additionally, the lattice parameter of the FCC phase was lower than that of the bulk phase, a = 3.488 Å ± 0.174 Å, and the lattice parameter of the HCP phase was found to be a = 2.537 Å ± 0.007 Å and c = 4.135 Å ± 0.012 Å. Surprisingly, the 65 nm thin film was found to be fully FCC, with a lattice parameter of a = 3.488 Å ± 0.174 Å, similar to the 500 nm thin film. Here, we note that for clarity, Si substrate peak has been removed from thin film diffraction patterns.

Figure 1: Indexed XRD pattern of (a) bulk, (b) 500 nm film, and (c) 65 nm film samples measured using Cu Kα source. For bulk and 500 nm film samples, presence of both HCP and FCC phases is observed, while for 65 nm film, only FCC phase is observed.
Magnetic properties
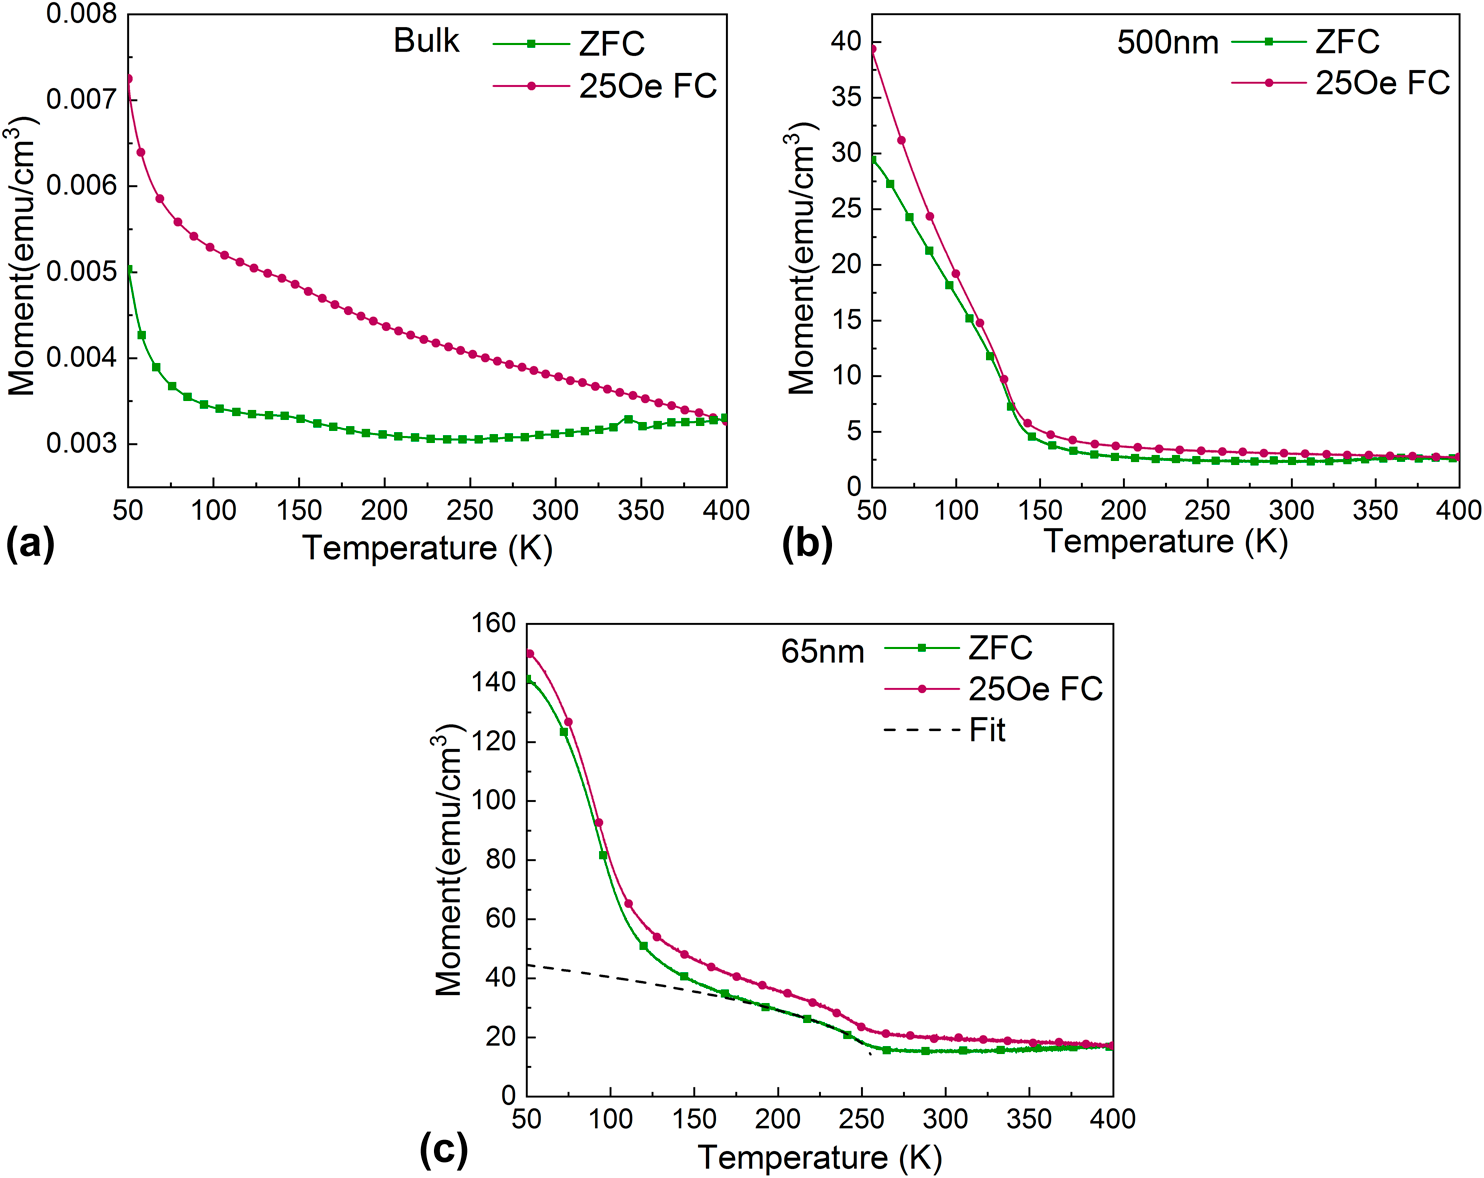
Figure 2 shows the zero field cooling (ZFC, green squares) and the field cooling (FC, red circles) responses as a function of temperature for bulk, 500 nm, and 65 nm thin film samples. The ZFC and FC curves were measured as described in “Methods” section. A field of 25 Oe was applied during the measurements. A remarkable increase of three orders of magnitude for magnetic moment is observed between the bulk (M ZFC = 0.005 emu/cm3 at 50 K) and the 500 nm thin film (M ZFC = 29.5 emu/cm3 at 50 K). Further reduction of film thickness from 500 to 65 nm results in an additional order of magnitude increase of magnetic moment (M ZFC = 141 emu/cm3 at 50 K).

Figure 2: ZFC and FC curves for (a) bulk, (b) 500 nm film, and (c) 65 nm film samples. The splitting in ZFC and FC at T S ≈ 390 K for all three samples. Further cooling results in a second magnetic transition at T F of 66 K for bulk, 145 K for 500 nm thin film, and 260 K for 65 nm thin film. Below T F, FM or FM-like phase is observed in all three samples as discussed in text.
Multiple magnetic transitions as a function of temperature are observed in all three samples as shown in Fig. 2. At 400 K, both M ZFC and M FC curves overlap with each other; however, at T ≈ 390 K, a split between M ZFC and M FC is observed for all three samples. The split in M ZFC and M FC is indicative of magnetic transition of a frustrated system such as spin glass or a cluster glass [Reference Mydosh18]. This is because FC induces a preferred directions along which a small net FM moment is aligned, while for ZFC, the moments are frozen in a frustrated state and external applied field needs to overcome an array of local anisotropy axes or randomly oriented clusters to align the spins. The relaxation of these frozen-in moments to the field direction could continue over many decades in time, leading to a split in ZFC and FC curves. The experimental measurements distinction between spin glass and cluster glass will be presented later, but for now, we will denote the transition temperature using T S. Further cooling of the sample results in a small variation of the magnetization, and both ZFC and FC curves remain relatively flat until a second transition is observed, where both M ZFC and M FC rise rapidly. This increase in magnetic moment is observed in all three samples, although the transition temperature is different for each sample. Transition temperatures, T F, of 66, 145, and 260 K are measured for bulk, 500 nm, and 65 nm thin films, respectively.
Following the second transition at T F = 260 K, the FC magnetization for 65 nm thin film behaves as M FC = A(T C − T)β, which is characteristic of an FM phase. The fit [Fig. 2(c)] resulted in a β = 0.57 which is close to the classical Landau exponent of 0.5 for an FM material, indicating that below 260 K the phase is FM or FM-like [Reference Vrtnik13]. For bulk and 500 nm thin film samples, although an accurate fit could not be obtained due to full transition not being captured in the measured temperature range, hysteresis loop measurements discussed below point toward FM or FM-like phase. A third transition is also observed for 65 nm thin film at T U ≈ 115 K, the nature of which is not yet clear. Figure 3 shows the magnetic field dependence of FC curves for all the samples. Similar behavior, although higher magnetic moment, is observed as applied field increases (from 25 Oe to 500 Oe). The higher applied magnetic field results in stronger Zeeman interaction, thus aligning the spins further, and leads to smearing of sharpness of the magnetic transitions.

Figure 3: Field dependence of FC curves for (a) bulk, (b) 500 nm film, and (c) 65 nm film samples. Magnetic moment is plotted as a function of temperature for an applied field of 25 Oe, 100 Oe, and 500 Oe.
Figure 4 shows ZFC hysteresis loops for all the samples. For the bulk and the 500 nm thin films, hysteresis loops were measured at (i) above T S (400 K), (ii) in between T S and T F (200 K), and (iii) below T F (50 K), while for the 65 nm thin film sample, hysteresis loops were measured at (i) above T S (400 K), (ii) in between T S and T F (300 K), (iii) below T F (200 K), and (iv) below T U (50 K). For the bulk sample at 400 K, a linear response to the applied magnetic field is obtained. Additionally, even with an applied field of ±30 kOe field, no saturation was observed, as shown in the inset of Fig. 4(a). This combined with the ZFC and FC measurements (Figs. 2 and 3) eludes to paramagnetic behavior above T S. In between T S and T F (200 K) and below T F (50 K), hysteresis loops with a coercivity of 20 Oe are observed, indicating magnetic ordering in the sample. Specifically, at 50 K, a wider hysteresis loop with higher magnetic moment point toward FM behavior, in agreement with the ZFC and FC measurements.

Figure 4: ZFC hysteresis loops for (a) bulk, (b) 500 nm film, and (c) 65 nm film samples. Inset for (a) shows the hysteresis loop for bulk sample at 400 K with an applied field of ±30 kOe. The y-axis represents moment in emu/cm3 and x-axis represents applied magnetic field in kOe. Inset for (b) and (c) show zoomed-in view of hysteresis loops for respective thin film samples. The y-axis denotes moment in emu/cm3 and x-axis denotes field in Oe.
For the thin film samples, a small hysteresis is observed at 400 K, as shown in the inset of Figs. 4(b) and 4(c). A coercivity (H c) of 3 Oe and 5 Oe with a saturation magnetization (M s) of 4 emu/cm3 and 19 emu/cm3 is obtained for 500 nm and 65 nm thin films, respectively. The presence of small hysteresis with very low coercivity slightly above T S ≈ 390 K implies magnetic ordering as the transition temperature is approached, potentially due to the existence of small magnetic clusters before the spin glass or cluster glass phase emerges. Below T S, hysteresis loop with higher coercivity is observed for both thin film samples. A coercivity of H c = 12 Oe and 14 Oe is obtained for 500 nm and 65 nm thin films, respectively, while the saturation magnetization increases to 6.5 emu/cm3 and 22 emu/cm3 below T S. The multiple steps observed in hysteresis loops clearly show the coexistence of two magnetic phases in both the samples below T S [Reference Becker19]. While the splitting of FC and ZFC curves in Fig. 2 indicates that one of the phases is spin glass or cluster glass, the nature of second magnetic phase is not clear and requires further characterization. Below T F, no steps are observed in hysteresis loops and the saturation magnetization increases by two orders of magnitude for 500 nm film, while for 65 nm film, steps are still observed in hysteresis loops and the saturation magnetization doubles. For 65 nm thin film sample, below T U, the steps finally disappear and saturation magnetization increases by an order of magnitude. The higher saturation magnetization and coercivity below T F indicate the emergence of FM or FM-like phase, which is in agreement with ZFC and FC measurements.
To identify spin glass versus cluster glass phase below T S, ZFC and FC hysteresis loops were measured. In magnetic MPEA systems, chemical clustering of the elements can lead to magnetic clustering and a magnetically disordered cluster glass state (or mictomagnetic state) can form. The clusters of different sizes can form and interact with each other, although within each cluster, the FM spin alignment dominates. In zero field, these clusters can freeze with random orientations at low temperatures, resulting in low remanence and coercivity. On the other hand, cooling in applied field can collectively align these clusters, which results in larger remanence and shift in hysteresis loop in opposite direction of the field (similar to exchange bias effect) [Reference Vrtnik13, Reference Beck20]. Thus, a cluster glass can be differentiated from spin glass by measuring ZFC and FC hysteresis loops. Figure 5 compares the hysteresis loops measured after field cooling in 20 kOe with ZFC hysteresis loop for all three samples. No significant change in the hysteresis width or shift of the FC loop is observed in comparison with the ZFC loop. This combined with the fact that no chemical inhomogeneity was observed down to spatial length scales of 50 nm indicates that the sample does not show cluster glass behavior and eludes toward spin glass behavior below T S. Here, we note that the spin glass state has been recently observed in other MPEA systems, such as equiatomic CrMnFeCoNi and ternary Cr23Fe4Ni73 alloys [Reference Schneeweiss12, Reference Pal, Majumdar and Nigam21].

Figure 5: FC and ZFC magnetization response as a function of field for (a) bulk, (b) 500 nm, and (c) 65 nm samples below T S. No significant change is observed between the FC and ZFC curves, indicating lack of cluster glass phase as described in text.
To further characterize the spin glass phase, we measured the aging behavior, i.e., time dependence of the magnetization within the frozen spin glass state. Magnetization of a spin glass evolves as a function of time to any change of external field in the frozen state. This aging behavior due to long-time relaxation effects highlights the dynamic nature of spin glasses [Reference Mydosh18]. Aging behavior was measured by cooling the sample in zero field to a desired temperature (temperature quench), waiting for a certain amount of time = t age and then applying a small field as described in detail in “Methods” section. Once the field is applied, the magnetization was measured as a function of time [M(t)] for different wait times, t age. Figures 6(a) and 6(c) show the evolution of magnetization (normalized by applied field) as a function of time for 500 nm and 65 nm thin films below T S, respectively. For both samples, M(t) increases, then goes through an inflection point, and is strongly dependent on t age. The dependence on wait time is due to the aging processes occurring in the spin glass as a function of time. These aging processes are reflected in the different time dependencies of M(t) for a particular value of t age. Figures 6(b) and 6(d) show the relaxation rate S(t) = (1/H) dM/d log t. The inflection point of M(t) corresponds to a maximum in S(t), which shifts to longer measurements time, t, with increasing wait time, t age. The presence of peak in S(t) has been associated with the crossover from quasi-equilibrium dynamics (due to relaxation processes) to nonequilibrium dynamics (due to domain wall motion) and is found to be dependent on the wait time, under the droplet model description of the spin glasses. More details on the droplet model of spin glasses can be found in Ref. Reference Mydosh22, but here we emphasize that the presence of aging behavior shows that magnetic phase present below T S is indeed the spin glass phase.

Figure 6: Evolution of magnetization, (1/H)M(t), as a function of time for (a) 500 nm and (c) 65 nm thin film samples for different wait times, t age of 100, 1000, and 5000 s. Corresponding relaxation rate, S(t) = (1/H) dM/d log t, is also plotted for (b) 500 nm and (d) 65 nm thin films for the same wait times. The shift in M(t) and S(t) toward longer measurement times for higher wait time shows the aging of the sample and point toward spin glass behavior as described in text. The measurements were performed below spin glass transition temperature, T S, at 300 K for 65 nm sample and at 200 K for 500 nm sample.
Discussion
The XRD measurements shown in Fig. 1 clearly show that the relative amount of HCP and FCC phases depends on the film thickness. For bulk and 500 nm thin film samples, dual phase (both HCP and FCC phases) is observed. The amount of HCP phase was lower for the thin film, as indicated by lack of lower intensity HCP Bragg peaks. For 65 nm thin film, no HCP peaks were measured, indicating that only FCC phase is present. The EDS measurements indicate that both FCC and HCP phases have same composition. Presence of dual phases with identical composition is in agreement with recent studies by Li et al. [Reference Li, Pradeep, Deng, Raabe and Tasan17] on a similar MPEA system, Fe50Co10Mn30Cr10. In this study, it was shown that the partial martensitic transformation of FCC to HCP during quenching can lead to the formation of the dual-phase alloy. It was also shown that the relative amount of FCC and HCP phases was dependent on the Mn content, where samples with 30 at.% Mn showed presence of both FCC and HCP phases, and samples with 40 and 45 at.% Mn were fully FCC. In comparison, in our studies, we observe this variation in the stability of FCC and HCP phases as a function of thin film thickness. The sample confinement in thin film geometry inhibits FCC to HCP martensitic transformation and stabilizes the FCC phase. Here, we note that the inclusion of silicon in the composition did not have any impact and the measured XRD pattern is similar to the literature [Reference Li, Pradeep, Deng, Raabe and Tasan17], potentially due to low % Si content.
Temperature dependence of total magnetic moment in the range of 50–400 K revealed multiple magnetic transitions as shown in Figs. 2 and 3 for all three samples. For bulk sample, a paramagnetic phase is clearly observed at 400 K, noted by the linear dependence of magnetic moment on field and lack of saturation even at ±30 kOe [inset, Fig. 4(a)]. For the thin film samples, small hysteresis is observed at 400 K, with coercivity in range of ∼3 to 5 Oe, potentially due to the presence of local magnetic ordering within a paramagnetic matrix as the first magnetic transition is approached. At T S ≈ 390 K, first magnetic transition is observed with transformation to the spin glass phase as shown by the splitting of ZFC and FC curves in Fig. 2 and aging behavior discussed in Fig. 6. Further lowering the temperature of this spin glass state results in a coexistence of two magnetic phases in thin film samples, as shown by the steps in hysteresis loops in Fig. 4. The steps in the hysteresis loops can occur due to competing interaction between the spin glass phase and second magnetic phase with different coercivity. Such complex behavior in hysteresis loops has been observed in Ni with 21 at.% Mn due to the presence of both spin glass and FM ordering [Reference Binder and Young23, Reference Senoussi24]. At present, it is not clear which atom or atomic clusters contribute toward this second ordering, although the spatial homogeneity observed in EDS maps (see Supplementary material) indicates that the atomic clusters are lower than 50 nm. Additional spectroscopy and nanoscale imaging studies are required to investigate atomic clustering in the mixed phase regime.
A second magnetic transition associated with a sharp rise of total magnetic moment is observed for all three samples as the temperature is further decreased, as shown in Figs. 2 and 3. The coercivity and saturation magnetization also increase below T F for all samples (Fig. 4), although the increase observed in thin films is significantly higher than the bulk sample. This behavior is indicative of FM ordering or at least a partial FM ordering of the local magnetic moments in the sample. The temperature of this second transition is dependent on the film thickness, where T F = 260 K is observed for 65 nm thin film and T F = 145 K is observed for 500 nm thin film. For the bulk sample, the transition temperature is even lower, with T F = 66 K. These observations clearly show that the thin film confinement stabilizes the FM phase, thus leading to higher transition temperature, coercivity, and saturation magnetization. Furthermore, the total magnetic moment at 50 K for ZFC is four orders of magnitude higher for the 65 nm thin film than the bulk sample. Here, we note that this sequence of paramagnetic to spin glass to FM phase transition with lowering of temperature is similar to magnetic transitions observed in a recent study on bulk equiatomic CoCrFeMnNi MPEA alloy [Reference Schneeweiss12]. However, the transition temperatures observed in our studies are comparatively higher, potentially due to larger amount of Fe present in the MPEA and due to the stabilization of magnetic ordering in thin films.
Summary and conclusion
In summary, we compared the magnetic properties of both bulk and thin films of non-equiatomic composition of FeCoMnCrSi-based MPEA. Our studies show that thin film confinement can be utilized to manipulate not only the magnetic behavior but also structural phases present in the alloy. We observed a variation in the relative amount of FCC and HCP phases in bulk and thin film samples. While bulk and 500 nm thin films showed both FCC and HCP phases, only FCC phase was observed for the 65 nm thin film due to suppression of FCC to HCP martensitic transformation. The measurement of magnetic behavior showed four orders of magnitude increase in saturation magnetization going from bulk to thin film. In all samples, two magnetic transitions were identified: (i) a paramagnetic to spin glass transition with a transition temperature of 390 K and (ii) spin glass to FM (or FM-like) phase transition with a transition temperature of 66 K, 145 K, and 260 K for bulk, 500 nm, and 65 nm thin film samples, respectively. Furthermore, by controlling the film thickness, we were able to tune the saturation magnetization and coercivity of the FM phase. Our results highlight the complex evolution of magnetism as a function of temperature in MPEA systems. Our studies provide a starting point toward manipulating structural phases and magnetic properties via thin film control in MPEA, which could enable innovative alloy designs for a wider variety of applications including soft magnetic materials, rare-earth-free permanent magnets, and magnetocaloric devices.
Methods
FeCoMCrSi thin films were deposited using an AJA International sputtering system. The FeCoMnCrSi sputtering target and the bulk sample were cut from a rolled slab procured from Element Materials Technology. The composition of target, Fe39.8Co19.92Mn20.52Cr14.77Si5, was confirmed by direct current plasma atomic emission spectrometry. DC magnetron sputtering with an Ar pressure of 2 mTorr was used to deposit thin films with thickness of 500 and 65 nm on 5 × 5 mm2 Si(100) substrates. Bulk sample was cut in a cylindrical geometry with height of 1.11 mm and diameter of 3.16 mm. Compositions of both bulk and thin film samples were confirmed by constructing 2D compositional maps using FEI Scios equipped with Oxford Instrument EDS system. Structural characterization was performed using a Panalytical X'Pert PRO MRD with Cu X-ray source (λ = 1.5406 Å). The lattice parameters were calculated using Bragg's law.
Magnetic properties were measured using vibrating sample magnetometer Quantum Design VersaLab system. Temperature dependence of the magnetic moment was studied in the temperature range of 50–400 K. For all the measurements, the samples were first heated to 400 K to ensure that the starting point was above the phase transition temperature. ZFC and FC measurements were performed to investigate the magnetic transitions in bulk, 65 nm, and 500 nm thin film samples. Standard ZFC and FC protocols were followed, where ZFC data were obtained by cooling the samples to 50 K in zero field, followed by magnetic moment measurement during heating cycle with a 25 Oe applied field. FC curves were measured by cooling the samples in 25, 100, and 500 Oe applied field. Hysteresis loops were collected at specific temperatures dictated by magnetic transitions observed in ZFC and FC measurements. For ZFC (FC) hysteresis loops, samples were cooled in zero field (20 kOe field) from 400 K to the measurement temperature. Aging data showing the evolution of magnetization versus time were collected by cooling the samples in zero field to the desired temperature, followed by holding the sample for the specified aging time (t age) at this temperature. A field of 15 Oe was applied at the end of aging time, and the moment of the sample was measured as a function of time (t m).
Supplementary material
To view supplementary material for this article, please visit https://doi.org/10.1557/jmr.2019.405.
Acknowledgments
R.J., K.B.A., and R.K. acknowledge the support by the University of California, Davis, for this research. The authors would like to thank Element Materials Technology for providing the bulk MPEA sample. R.K. thanks Sabyasachi Sen and Jeffrey Gibeling for helpful discussions.


 Open access