


As a result of increasing worldwide prevalence of obesity and diet-related chronic conditions (e.g. CVD), non-clinical interventional methods that may encourage an individual into healthier choices have gained notoriety(Reference Kaptoge, Pennells and de Bacquer1). In recent decades, the immediate surroundings of one’s home have been increasingly studied as a determinant to facilitate or become a deterrent to nutrient dense food intake(Reference Caspi, Sorensen and Subramanian2,Reference Drewnowski, Arterburn and Zane3) . Considerations in urban and suburban design are critical as distance travelled and surrounding options are components of food access. Coined the Food Environment, one aspect of this construct is that the proximity of food outlet (e.g. markets and restaurants) quantity and quality near one’s home may steer an individual’s dietary intake(Reference Caspi, Sorensen and Subramanian2,Reference Vadiveloo, Sotos-Prieto and Parker4) .
Previous studies have shown associations of consuming higher amounts of fruits and vegetables in those living within proximity of supermarkets compared to living near a convenience store, a smaller market with limited healthy items typically at higher prices(Reference Bodor, Rose and Farley5–Reference Morland, Diez Roux and Wing7). However, living nearby a higher density of fast-food restaurants was not found to equate to greater prevalence of a poorer diet in previous cross-sectional analyses(Reference Caspi, Sorensen and Subramanian2,Reference Jiao, Moudon and Kim8,Reference Spence, Cutumisu and Edwards9) . An explanation of these inconsistent findings may be attributed to an array of factors such as location of sample collection, type of food retailers chosen and selected food groups as outcomes.
To date, most studies have been performed in the USA where there is generally greater contrast between neighbourhoods in terms of socio-economic and racial inequality compared to European and Asian societies(Reference Beaulac, Kristjansson and Cummins10–13). Such geographic disparity and its possible reflection in the food environment can take on many forms and be distinct to a certain society. An example widely found in the USA are food deserts, areas where there is poor access to quality and affordable food, may not be as profound in other parts of the world(Reference Helbich, Schadenberg and Hagenauer14–Reference Walker, Keane and Burke16). It is therefore important to study the food environment across differing localities and cultures to determine if these findings remain.
Previous studies that focused on evaluating the food environment often relied on supermarkets and fast-food restaurants as sole indicators of individual food environments(Reference Caspi, Sorensen and Subramanian2). Relying on these specific food outlet types is limiting as it excludes many other varieties of stores and restaurants that individuals may regularly utilise. Gathering a collective of all the available food store types would be a comprehensive representation of what individuals may encounter in proximity to their home.
Finally, there is variability in outcome measures as most studies target fruit and vegetable intake while others focus on fast-food consumption, as well as specific nutrients. Making assumptions from one component of an individual’s diet is incomplete and may be misleading. Only few studies capture overall diet quality(Reference Caspi, Sorensen and Subramanian2,Reference Giskes, van Lenthe and Avendano-Pabon17) , which may provide a better representation of individual’s nutrient consumption than by examining individual vegetable and fruit intake only.
In conjunction with the Geoscience and Health Cohort Consortium, data from the Maastricht Study were used to assess the association between the local food environment and dietary quality. Socio-economic indicators were evaluated to determine confounding on the latter association. We hypothesise that those living in the vicinity of higher quality food establishments (high inventory of fruits and vegetables, low processed foods, etc.) will have healthier dietary quality than those who do not. In addition, the associations between neighbourhood food environment and the consumption of sub-categories such as fruits, vegetables and sugar-sweetened beverages were examined consistent with neighbourhood food environment quality.
Methods
Study population
Data used were gathered from the Maastricht Study, an observational prospective population-based cohort study. The rationale and methodology have been described previously(Reference Schram, Sep and van der Kallen18). In brief, the study focuses on the aetiology, pathophysiology, complications and comorbidities of type 2 diabetes mellitus (T2DM) and is characterised by an extensive phenotyping approach.
Eligibility for participation was individuals between the ages of 40 and 75 years and living in the southern part of the Netherlands. Participants with and without diabetes were recruited through mass media campaigns, from the municipal registries and the regional Diabetes Patient Registry via mailings. Recruitment was stratified according to known T2DM status, with an oversampling of individuals with T2DM for reasons of efficiency. The present report includes cross-sectional data from the first 7689 participants, who completed the baseline survey between November 2010 and December 2017 with complete geographic data at the time of analysis. The examinations of each participant were performed within a time window of 3 months. Participants were excluded from analyses if their addresses could not be matched or had missing diet data (n 215), or missing data on education level (n 107) resulting in data from 7367 participants available for this study.
Measures
A FFQ derived by van Dongen et al. that enabled the calculation of the Dutch Healthy Diet (DHD) index was completed by all participants at baseline entry of the study between 2010 and 2017(Reference van Dongen, Wijckmans-Duysens and den Biggelaar19). A detailed description of the DHD can be found elsewhere(Reference Looman, Feskens and de Rijk20). In short, the DHD is a self-reported questionnaire with a scale of 0–150 that measures level of dietary adherence to the 2015 Dutch dietary guidelines with the overall highest score (150) corresponding to full compliance(Reference Looman, Feskens and de Rijk20). Fifteen food categories based on the Dutch dietary guidelines in 2015 comprise of the questionnaire which include healthy and less healthy components. The healthy components consist of vegetables, fruit, wholegrains, legumes, fish, dairy, nuts and tea. The less healthy components, with cut-offs for moderate consumption, include fats and oils, coffee, red meat, processed meat, sweetened beverages and fruit juice, alcohol and salt. Each food item was assigned a score of 0–10 with 10 being optimal. Data on filtered and unfiltered coffee were not included in the FFQ for the Maastricht Study as data collection began in 2010 and the DHD index was released in 2015. This component could not be derived as a result. The values for the DHD score for our study therefore ranged from 0 to 140.
Food environment
Geo-data were collected as part of the Geoscience and Health Cohort Consortium (GECCO)(Reference Lakerveld, Wagtendonk and Vaartjes21). GECCO data were linked to individual addresses from the Maastricht Study creating individual food environments for each of the participants. Data on the food environment in GECCO were based on the LOCATUS database consisting of a comprehensive audit taken every 2–3 years of available food outlets in the study region that included markets and restaurants(22,23) . GECCO-generated exposures to the food environment in 2015 or 2017 were matched to the year closest to their completion of the FFQ. The previous two LOCATUS audits before 2015 showed little change in food retailers compared to 2015 in the Maastricht region(24,25) . Thus, participants who enrolled in 2010–2015 and those who enrolled in 2016–2018 were combined in the 2015 and 2017 group, respectively.
Using the types of food outlets from LOCATUS, a Delphi study conducted by an expert panel was performed to create an aggregate measure of the quality of the retail establishments in the Netherlands, generating the Food Environment Healthiness Index (FEHI)(Reference Poelman26). The FEHI index classifies each type of food retailer in relation to the nutritional quality of the foods they offer on a scale from –5·0 for the least healthy to +5·0 for the healthiest (see online supplementary material, Supplemental Table 1). Thus, a positive score is considered healthy and a negative score is less healthy. For example, a fish retailer and a supermarket were given a score of 2·8 and 1·8, respectively. A liquor store and confectionary shop were assigned values of –4·6 and –4·7. All scores of all food outlets averaged to zero in a kernel around the outlets, creating a heatmap with assigned FEHI scores for the full region (Fig. 1). An analysis was conducted evaluating a participant’s broader food environment using the FEHI that was assigned to their address area. In addition, the density of the six most common types of food outlets frequented was individually evaluated and included in the main analysis: local food shops (LF) including a butcher shop and bakery, fast food (FF), food delivery (FD), restaurants (RS), supermarkets (SM) and convenience stores (CS). The individual count of each of these establishments was calculated for each participant’s address. A Euclidian buffer zone of 1000 m was used as a reference distance from an individual address in relation to nearby food outlets. This allowed each participant to have their own residential food environment analysed. The distance of 1000 m was chosen in the main analysis as it is the best estimate within walking and cycling range for the average individual to travel to each food outlet, accounting for suburban neighbourhoods(Reference James, Berrigan and Hart27,Reference Pinho, Mackenbach and Charreire28) .

Figure 1: Heat map of food retailers by quality (FEHI) in Maastricht, NL. Green areas represent healthier food densities; red areas represent least healthy. FEHI, Food Environment Healthiness Index.
Covariates
Covariates, measured as part of the Maastricht Study, included age, sex, T2DM and education. Education was divided into low (no education, primary education and lower vocational education); medium (general secondary education, general vocational education and higher secondary and pre-university education) or high (higher vocational education and university). Presence of T2DM was measured by a glucose tolerance test and medication use(Reference Schram, Sep and van der Kallen18). Covariates used in the sensitivity analyses were housing value, household income, urbanicity and car ownership. Neighbourhood housing value and urbanicity were obtained from Statistics Netherlands. Participant housing value was calculated using the mean property value in Euro of the data collection period from 2010 to 2017. Household income was measured by self-reported net household income per month, and the equivalent income was computed taking account of the number of people in the household(13,Reference Qi, Koster and van Boxtel29) . Urbanicity was divided into a 5-point scale: 1 (> 2500 addresses per km2), 2 (1500–2500), 3 (1000–1500), 4 (500–1000) and 5 (< 500). Car ownership was obtained from the Maastricht Study survey indicating yes or no.
Statistical analyses
Descriptive characteristics of the total study population according to quartiles of the FEHI and DHD score were summarised as percentages to detect trends in demographics and socio-economic status. Separate linear regression analyses were used to assess the association between food outlet types, and the FEHI, with the DHD score. Model 1 was adjusted for age, sex and T2DM; model 2 was additionally adjusted for education level. Sub-components of the DHD and the FEHI were also analysed adjusting for age, sex, T2DM and education. Linear assumptions were met, and the residuals were found normally distributed after visual inspection of their histograms and P-P plots. Predicted values and residuals were plotted showing no indication of heteroscedasticity. The assumption of multicollinearity was examined by evaluating the correlation coefficients of the predictor variables and the variance inflation factors which showed no multicollinearity.
We performed several sensitivity analyses to verify the robustness of our findings taking account of variables that may alter participant geographic access and account for socio-economic indicators. First, we repeated the main analyses using 500 m and 1500 m buffer zones. Second, we ran the full model omitting T2DM as a covariate to determine if there was an overadjustment for this variable. Third, we substituted level of education for income and then average housing value by postcode separately. Fourth, we additionally adjusted for urbanicity which included age, sex and T2DM in the model. Finally, we ran the full model adjusting for vehicle ownership. Analyses were conducted using IBM SPSS Statistics for Windows, Version 27.0 (IBM Corp.). The threshold for significance was set at P < 0·05.
Results
Table 1 displays participant data by FEHI score quartiles at the 1000 m buffer. Those within the lowest attained education group were predominately in the lowest quartile (32·6 %) compared to the healthiest quartile (13·8 %). The percentage of participants with T2DM was highest in the least healthy quartile (30·9 %) than the healthiest quartile (13·4 %). Table 2 presents the characteristics of the sample population categorised by DHD score dietary intake quartiles. In the total group, there was an equal number of male (50·1 %) and female participants with an average age of 59·8 years. Most participants with T2DM were both in the lowest DHD quartile (31·9 %) and in the lowest level of attained education (27·9 %).
Table 1 Participant characteristics by Food Environmental Healthiness Index (FEHI) quartiles

Table 2 Participant characteristics by Dutch Healthy Diet (DHD) score quartiles
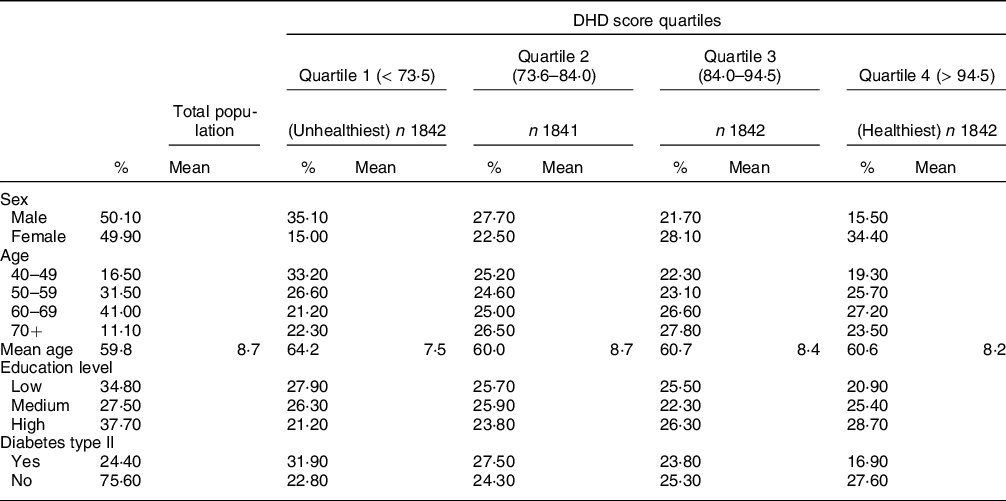
Table 3 shows the association between food outlet type, FEHI and DHD score. There was a statistically significant positive association between density of restaurants and DHD score in model 1 adjusted for age and sex (B = 0·02; 95 % CI = 0·00, 0·04) but lost significance after further adjustment for level of education in model 2. There were no statistically significant associations between the other food outlet types nor the FEHI with the DHD score. There was no statistically significant association between the overall FEHI with the sub-components of the DHD (Table 4).
Table 3 Linear associations between the food environment and dietary intake
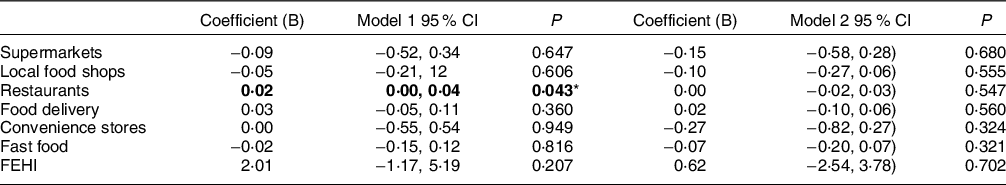
FEHI, Food Environment Healthiness Index.
All exposure variables were analysed independently.
Model 1: adjusted for age, sex, and type II diabetes; Model 2: adjusted for model 1 + education.
*P < 0·05.
Table 4 Association between the Food Environment Healthiness Index and individual components of the Dutch Healthy Diet

Adjusted for age, sex, T2DM, education.
In the first sensitivity analyses, the model was repeated with environmental factors at the 500 m and 1500 m buffer (see online supplementary material, Supplemental Table 2). The only statistically significant associations with the DHD index were higher density of local food shops within 500 m was associated with a lower DHD index in model 1 (B = –0·09; CI = –0·18, 0·00); and a higher density of convenience stores was associated with a lower DHD index in model 2 (B = –0·33; CI = –0·66, –0·01). Within the 1500 m buffer, a higher density of restaurants was associated with a slightly higher DHD index in model 1 (B = 0·03; 95 % CI = 0·00, 0·06).
Second, analyses were performed with T2DM removed; and then, education was substituted for income; and lastly, education was substituted with housing value which did not materially change the results (see online supplementary material, Supplemental Table 3–5). We additionally adjusted for urbanicity (see online supplementary material, Supplemental Table 6) in which we did not find significant associations. Further adjusting for car ownership, we found a positive association with restaurants (B = 0·03; 95 % CI = 0·01, 0·05) but not with the other food outlets or overall FEHI (see online supplementary material, Supplemental Table 7).
Discussion
In this study, we evaluated the associations between the neighbourhood food environment and participant diet quality (DHD score). A comprehensive measure of the food environment integrating distance, density and healthiness of food outlets did not result in a clear association between the food environment and diet quality. There were few statistically significant relationships with rather small coefficients between food outlet type and diet quality, but one ought to account for the multiple tests that we performed. In addition, there was no consistent trend in the direction of these associations. Using two additional buffer sizes and looking at separate outlets did not reveal a particular pattern either. In evaluating the sub-components of the DHD, there was no association between the neighbourhood FEHI on these specific food items (e.g. fruits, vegetables, sugar-sweetened beverages). We also adjusted for socio-economic variables that included income level, housing value, urbanicity and car ownership which further bolstered our findings as they did not yield significant relationships with participant diet.
Contrary to our hypothesis, a healthier food environment in our study was not associated with a healthier diet as defined by a higher DHD score. Particularly, we expected to find healthier diet quality in those living within close access to supermarkets. Though supermarkets generally contain far more produce than any type of food outlet, there was no finding that living in proximity to these retailers coincided with healthier diet quality. The FEHI assigns these outlets the fourth highest score though it has been documented in previous studies that large grocery stores have mixed results with nearby residents in terms of diet and obesity outcomes(Reference Gase, DeFosset and Smith30–Reference Caspi, Lenk and Pelletier32). One explanation that Hallum and colleagues proposed was that having access to a high-quality supermarket does not guarantee that a consumer will not pursue cheaper, less healthy options at these stores when there are financial constraints(Reference Hallum, Hughey and Wende33). Another factor is that these markets often contain as much as, if not more ultra-processed foods and confectionary items than shops that are categorised as unhealthy. A final consideration is that a substantial number of individuals will travel to their preferred market or restaurant well beyond their neighbourhood(Reference Aggarwal, Cook and Jiao34–Reference Sohi, Bell and Liu38). However, in the current study, we found that adjusting for vehicle ownership was not associated with the overall food environment. Future work should consider evaluating individual utilisation within their food environment. On the other spectrum of food quality, we did not find that areas with a higher density of unhealthy food outlets, particularly fast food, had a significant association with worse diet quality. This relationship was also observed by two recent studies which were sampled in the Netherlands(Reference Harbers, Beulens and Boer39,Reference van Rongen, Poelman and Thornton40) .
The geographical layout of our study region displayed small areas that are unhealthy but within a narrow range overall in the city centre and throughout the greater Maastricht area with little variation in the food environment (Figs 1 and 2). We postulate that despite these small pockets that feature higher densities of less healthy food, the participants still had reasonable access to healthier food outlets in their immediate vicinity. Though this was not a priority in our study, it appears we did not find a region that spanned more than several neighbourhood blocks with exceedingly unhealthy food outlet exposure. The majority of our study sample region was slightly negative according to the FEHI scale suggesting a marginally unhealthy food environment (Fig. 2). Thus, given the thorough collection of food retailers, it appears we did not find what would suggest the presence of a food desert.

Figure 2: Mean distribution of the neighbourhood food environment by participants using the FEHI (unhealthy to unhealthiest: −0.1 to −5.0, healthy to healthiest: 0.1 to 5.0). X-axis was truncated as there were no values beyond −1.0 or 1.0+. FEHI, Food Environment Healthiness Index.
Previous studies by and large tend to contrast adjacent neighbourhood areas that vastly differ on the socio-economic gradient resulting in consistent disparity in dietary consumption and resulting obesity outcomes(Reference Beaulac, Kristjansson and Cummins10,Reference Zachary, Palmer and Beckham41,Reference Zenk, Odoms-Young and Dallas42) . The geographical layout of our study region also showed a diverse variation in socio-economic status by neighbourhood postal code. That variation was sufficient to allow a strong association between the average housing value and the odds of T2DM(Reference Consolazio, Koster and Sarti43). Furthermore, in the current study, we found that participants with lower attained education lived in relatively unhealthier food environments. Still, the variation in the food environment and the covariation with area socio-economic circumstances in the Netherlands might be diminutive in comparison with the USA. Other literature suggests that socio-economic and racial disparities in European societies have a lesser effect on food access than in North America(Reference Cummins and Macintyre44). In addition, unequal access to a variety of food retailers is less common in Europe, even in neighbourhoods with a high number of minorities(Reference Helbich, Schadenberg and Hagenauer14). The distribution of participants on the FEHI shows that they live in a marginally unhealthy food environment (Fig. 2). In regions with a high density of unhealthy food, we believe they still have access to a healthier option for nearly every unhealthy outlet within their neighbourhoods. Future work that better accounts for societal differences will be beneficial, particularly when setting out to determine the full potential of food environments in influencing individuals towards unhealthy dietary intakes.
There were several limitations to our study. First, this was a cross-sectional design and we were unable to infer causality between the food environment and dietary intake. Second, self-reported diet is well-known to be susceptible to inaccuracy and social desirability bias among others. However, given the exhaustive cross-disciplinary battery of questionnaires and medical exams the participants underwent, this was the most feasible and efficient method of gathering dietary intake information from each participant. The validated FFQ where the DHD score was obtained from was comprehensive, consisting of 253 food items. Third, we analysed the six most common food outlet types patronised by the participants. This may have omitted specialty markets and specific shops that our participants may frequent. The additional analysis of the FEHI was inclusive of all food retailers in the study region and thus, all assortments of food markets in our study area were represented in the analysis. Fourth, we quantified residential exposure to the food environment, whereas this may not have covered respondents’ actual activity space. We were not able to separately explore the workplace food environment. Given that half of our study population still have paid jobs, the workplace food environment might additionally have affected participant dietary quality. Finally, the FEHI assigned a score to a food outlet type by what it assumes it offers. Scales like these are unable to account for individual retailer variation within each category especially if it is not a recognised chain store. Certain establishments may be rated too low or high as a result. Thus, measures like these are not without imperfections and need to be continuously refined for greater validity.
The strength of this study was the large sample size which provided adequate power. We were able to develop a unique radius of food shops as well as calculate the food environment based on an individual’s home address. This advantage was a more precise, geographical representation as opposed to assigning the participant to a postal code or neighbourhood tract where their location may possibly overlap several defined geographic areas within their home radius. Another strength was that the directory of food establishments was obtained from the LOCATUS database which is regularly updated every 2–3 years on average and showed good to excellent agreement statistics (> 0·71) with field audit data for all three level of analysis (i.e. location, classification and both combined) and across urban as well as rural areas(Reference Canalia, Pinho and Lakerveld45). This comprehensive listing allowed us to account for food retailers that may have closed, moved or recently opened. This study was one of few instances where the complete food environment was observed as opposed to specific retailer types. We were also able to differentiate rural v. urban residents accounting for individuals who may find it more or less necessary to drive longer distances to seek common items. Finally, we adjusted for common socio-economic variables that may alter purchasing and dietary consumption including housing value, income and education.
Conclusion
The food environment in the Maastricht area appeared marginally unhealthy, but the differences in the food environment were not related to the quality of food that participants reported as intake. Before rejecting the food environment hypothesis, research is needed with better measures in areas where there is more variation in the food environment, as in the case in the USA. Research on the food environment should further evaluate longitudinal changes, utilise larger spatial variance in food outlet exposures, perform complete participant dietary measures and continue to account for all food outlet types to investigate a causal explanation.
Supplementary material
For supplementary material accompanying this paper visit https://doi.org/10.1017/S1368980023001180
Acknowledgements
We would like to acknowledge Alfred Wagtendonk for his work in data management.
Authorship
J.A.C., A.K. and H.B. were involved in formulating the research question, designing the study, analysing the data and writing the article. S.J.P.M.E., J.L., and M.G.M.P. were involved in designing the study and analysing the data. C.D.A.S., P.C.D., C.J.K., M.M.J.G. and A.W. were involved in collecting the data and reviewing the article.
Financial support
This study was supported by the European Regional Development Fund via OP-Zuid, the Province of Limburg, the Dutch Ministry of Economic Affairs (grant 31O.041), Stichting De Weijerhorst (Maastricht, the Netherlands), the Pearl String Initiative Diabetes (Amsterdam, the Netherlands), the Cardiovascular Centre (CVC, Maastricht, the Netherlands), CARIM School for Cardiovascular Diseases (Maastricht, the Netherlands), CAPHRI Care and Public Health Research Institute (Maastricht, the Netherlands), NUTRIM School for Nutrition and Translational Research in Metabolism (Maastricht, the Netherlands), Stichting Annadal (Maastricht, the Netherlands), Health Foundation Limburg (Maastricht, the Netherlands), and by unrestricted grants from Janssen-Cilag BV (Tilburg, the Netherlands), Novo Nordisk Farma BV (Alphen aan den Rijn, the Netherlands) and Sanofi-Aventis Netherlands BV (Gouda, the Netherlands). The Geoscience and Health Cohort Consortium (GECCO) was financially supported by the Netherlands Organisation for Scientific Research (NWO), the Netherlands Organisation for Health Research and Development (ZonMw) and Amsterdam UMC.
Conflict of interests
There are no conflicts of interests.
Ethics of human subject participation
This study was conducted according to the guidelines laid down in the Declaration of Helsinki, and all procedures involving research study participants were approved by the Institutional Medical Ethical Committee (NL31329.068.10) and the Minister of Health, Welfare and Sport of the Netherlands (permit no.131088-105234-PG). Written informed consent was obtained from all subjects/patients.


 Open access