


Introduction
Many public health and primary prevention concerns involve complex multifaceted disease aetiologies which can go undetected or unexplained by some analytic approaches. Machine learning approaches seek to better model these complexities; however, they can lack tangible insight and explanation which is vital to pushing science forward. Nonetheless, these possible multifaceted effects linger and failing to identify them can lead to bias, misinterpretation, or incorrect public health advice and intervention(Reference Vatcheva, Lee and McCormick1). By identifying subgroups of patients who exhibit complexity in the relationship between the variables that unite them in their uniqueness and the outcomes of interest, we can better understand the phenomenon and design targeted interventions.
Chronic diseases such as diabetes mellitus (DM) are significant health problems worldwide and leading causes of increased morbidity and mortality. Using diabetes as a single example, in the United States alone, approximately 34⋅2 million people (10⋅5 % of the population) have some form(2), which imposes a significant and increasing burden on society. It has serious repercussions as a higher health care need/use, economic burden and associated societal costs have been reported among people with diabetes when compared with people without the disease(Reference Yang, Zhao and Xiao3). While studies have consistently shown that having diabetes is associated with poorer physical and mental health outcomes(Reference Campbell, Khan and Cone4–Reference Bonnefont-Rousselot6), little work has been done to understand what factors may modify their manifestation, or which subgroups are most affected by various influences on treatment or disease progression. One important factor known to be involved in the prevention of chronic diseases, like DM, is micronutrients(Reference Bonnefont-Rousselot6). Nutrition is an important element in the management of diabetes(Reference Kabadi, Lee and Liu7), and studies have proposed that some foods and nutrients have protective or adverse effects on the management of DM(Reference Bazzano, Li and Joshipura8,Reference Pan, Sun and Bernstein9) . Although medical nutrition therapy is a cornerstone of the management of diabetes, several areas of uncertainty in the dietary guidelines still exist and many areas of nutrition and diabetes need to be explored further(Reference Franz, Bantle and Beebe10). The degree of uncertainty is especially high in the area of assessing micronutrient status and the role of micronutrients in the development of complications in diabetic patients(Reference Mooradian, Failla and Hoogwerf11–Reference Dubey, Thakur and Chattopadhyay13). Furthermore, there is limited evidence of a benefit from vitamin or mineral supplementation in people with diabetes who do not have underlying deficiencies(Reference Chehade, Sheikh-Ali and Mooradian14). This nuance and lack of specificity in who/what/when/where/why/how micronutrients play a role in the management and prevention of DM speak to the possible existence of complex multifaceted and subgroup-specific relationships. This is just one example of a complex chronic disease, and there are many others that may benefit from a better understanding of how micronutrient-defined subgroup-specific effects help/hurt the chance of various outcomes of interest.
In the present paper, we present an analytic strategy for exploring and identifying which micronutrient subgroups have differing effects on an outcome of interest. This strategy can be useful when the hypothesis of interest is that certain nutrients are more protective in subgroups of participants than others. Finally, an example of the proposed strategy is presented using 11,994 participants from the 2001–2006 National Health and Nutrition Examination Survey (NHANES) where we explore which nutrients are protective in subgroups of participants with diabetes on their self-reported number of poor mental health days.
Methodology
A strategy for exploring subgroup-specific effects: motivation and restraint
Variables that collectively define a subgroup-level effect can be accurately modelled, statistically, via the correct placement of an interaction term in a regression model. An interaction term models whether two (or more) explanatory variables have a significantly different effect when collectively considered (multiplicative) as compared with separately considered (additive). Including variables additively (main effects) in a regression model determines whether their effects, independently of one another, are associated with the outcome. Including variables as an interaction determines whether their effects synergistically (or antagonistically) depend on one another and cause varying levels of association on the outcome(Reference Jaccard and Turrisi15).
This synergism (or antagonism) is suspected by most in theory but considered by few in practice. This lack of consideration is mostly due to the sheer volume of possible combinations to consider. For example, with ten explanatory variables and one outcome, checking all possible two-way interactions would involve checking forty-five possible combinations (i.e. (10/2)). Exploring all possible three-way interactions results in an even more daunting 120 possible combinations. These numbers grow exponentially larger as the number of explanatory variables increases. After all of this, the investigator should correctly consider multiple comparison correction via the false discovery rate (FDR) or the conservative Bonferroni correction. With these troubles in mind, most leave this exercise for the reader's imagination. Where does this leave the investigator who wishes to explore these possibilities, or should they even try? We argue that many consider (and are deterred by) the price of testing and making an error and yet few consider the price of not testing and failing to identify. In the right scenarios and correct understanding of the exploration under consideration, investigators can complete exploratory subgroup analysis and generate data-driven hypotheses to be scrutinised by the scientific community for validity and clinical relevance/significance and then formally tested in future well-designed powered studies.
Overview of the proposed strategy
The Feasible Solution Algorithm (FSA), outlined by Lambert et al. (Reference Lambert, Gong and Elliott C16), is a regression-based approach where investigators can explore interaction effects while adjusting for covariates and confounders. The algorithm is currently implemented in the R package rFSA(Reference Lambert, Gong and Elliott C16). In terms of exploratory interaction analyses, feasibility could be argued as identifying a set of plausible data-driven interactions that could elucidate real subgroups related to the outcome. The reality of the proposed set would not be the end goal of the analyses in hand, rather the goal would be to identify a set of interactions that have some data behind them and then to further consider the set-in light of the literature and biological credibility. The FSA identifies such a set for a given outcome while adjusting for the specified covariates and confounders. FSA works for a wide variety of regression modelling strategies (e.g. linear regression, logistic regression) and can identify a set of solutions based on a criterion a user selects (e.g. R2, AIC, Interaction P-value). The set of solutions is identified by running the algorithm many times, as a random start may land at a different optimal or semi-optimal endpoint than another random start. Guidance on how many times to run the algorithm, a detailed outline of the algorithm, and an example of how to use the R package (rFSA) can be found in the previously published works around FSA(Reference Lambert, Gong and Elliott C16–Reference Janse, Thompson and Diawara18). As a recommendation, we propose a three-step strategy to successfully implement FSA. An illustration of this strategy can be found in Fig. 1. First, the investigators would identify known covariates and confounders related to the outcome that they would like to adjust for. They would then fit a regression model with these variables and perform common statistical checks. Once the model is identified from step 1 (typically called a base model), the investigator would employ the rFSA code or utilise the web application located here: https://shiny.as.uky.edu/mcfsa/. From this analysis, a set of K interactions would be identified. Finally, in step 3, the set of interactions, parameter estimates and various visualisations of their association would be presented to the research team for scientific insight, interpretation and validation. This set of interactions is again, thought to be a suggestive set, and feedback from step 3 (research team insight) should be highly valued in how follow-up analyses and presentation of the findings are reported. In all cases, exploratory results should be restudied in separate independent datasets before conducting rigorous statistical inference.

Fig. 1. Overview of the FSA approach.
Example
Here, we present an example of the proposed strategy utilising the NHANES from 2001–2006. This example explores which NHANES measured nutrients are protective in subgroups of participants with diabetes on their self-reported number of poor mental health days. All R code used to download and analyse the necessary NHANES data can be found on the corresponding authors GitHub repository (https://github.com/joshuawlambert/NutritionNHANES). This may be useful for researchers looking to reproduce what has been completed in this manuscript or serve as a template for researchers who would like to explore interactions for their own data and purposes.
Study participants and data summary
The NHANES uses a stratified multistage probability sampling design and is meant to reflect the civilian US population(19). Each survey covers a 2-year time period and surveys approximately 10 000 NHANES participants. Our study used participant data for the years 2001–2006. The NHANES survey data were freely downloaded from the NHANES website(19), using R version 3.5.1 and the nhanesA package(Reference Endres20).
There was a total of 31 509 participants who completed NHANES from 2001–2006. Participants who were less than 21 years of age at the time of the survey, or had missing information for age, gender, race, education, family income to poverty ratio, body mass index (BMI), smoking status, the number of mental health days in last 30 d, or the number of physical health days in the last 30 d were excluded from this study. There was a total of 16 387 participants who were at least 21 years of age, and 11 994 who remained after all exclusion criteria were applied.
Clinical, demographic and nutrient variables
The question: ‘for how many days during the past 30 days was {your/his/her} mental health not good?’ was chosen as the primary outcome and considered a measure of mental health status.
Six variables within the NHANES database were used to define diabetes status. The variables included three verbal questions: ‘Doctor told you have diabetes’, ‘Taking insulin now’, ‘Take diabetic pills to lower blood sugar’ and three blood specimen measurements: fasting glucose (mg/dl), two-hour glucose (mg/dl) and glycohaemoglobin (%). Any participant who answered yes to any of the verbal questions or had a fasting glucose>=126 mg/dl, two-hour glucose>=200 mg/dl or glycohaemoglobin>=6⋅5 were classified as participants with diabetes (n 1633; 13⋅6 %). This definition was inspired by the work of Kabadi et al. (Reference Kabadi, Lee and Liu7). Participants who met this definition of having diabetes are referred to as participants with diabetes throughout the remainder of the results, discussion and conclusion.
The NHANES measured nutrient levels using high-performance liquid chromatography (HPLC) with photodiode array detection. HPLC is a method used for the analysis of serum concentrations of retinoids, carotenoids and tocopherols(21). An overview of all nutritional variables used, time period availability, variable median cutoffs, as well as the total sample size for each variable can be found in Table 1. For the purposes of interpretability, each continuous nutritional variable was categorised by either being greater than or equal to its median or less than its median. Descriptive statistics stratified by Diabetic status and overall can be found in Table 2 with further sub-stratification by diabetes status and mental health days in Supplementary Table A1.
Table 1. Nutrient variables medians used for cutoffs and number of missing
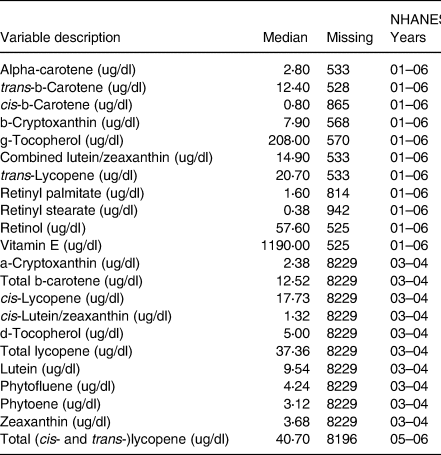
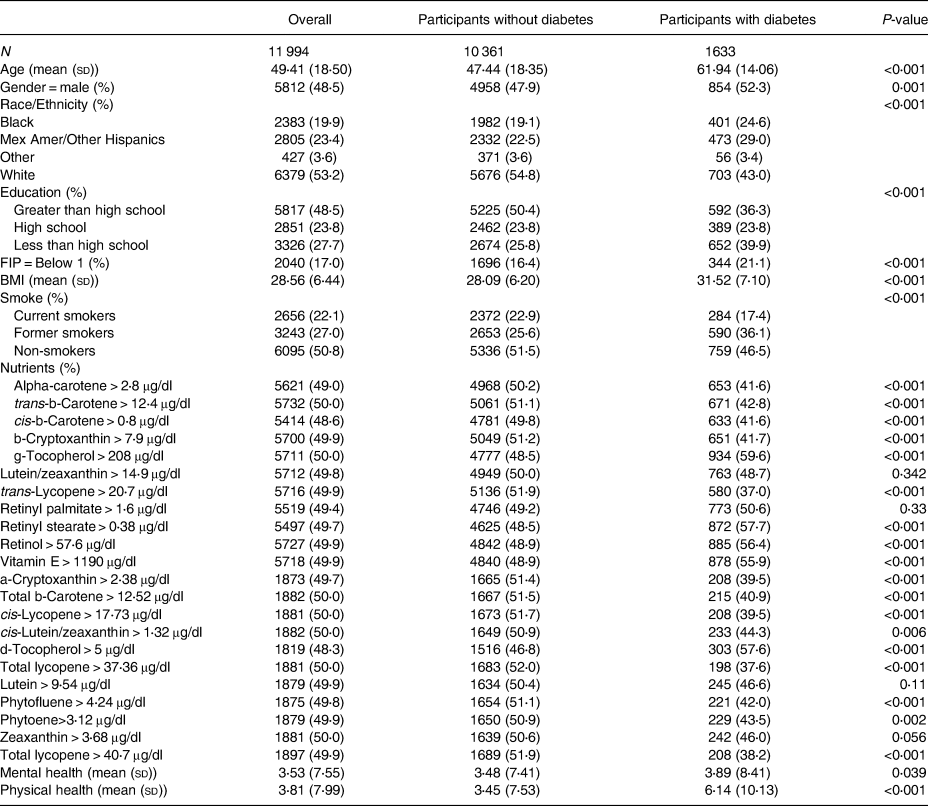
Table 2. Descriptive statistics overall and stratified by diabetes status
Statistical Analyses
R version 3.5.1 was used for all tables, plots and statistical analysis. Outcome variables (mental health days) were analysed as they were measured (continuous count data). Eight variables were considered for adjustment. Variables for adjustment included age, gender, race (white, black, Mexican American or other Hispanic, and other race), education (less than high school, high school, greater than high school), FIP level (less than poverty level, greater than poverty level), BMI, smoking status (former, current or non-smoker) and the number of physical health days (0–30). Finally, diabetes status was also included as it was the main independent variable of focus for this example.
Due to the survey nature of NHANES, sample weights are included so that accurate estimation of the US adult population (twenty-one or older) can be completed. The outcome variables were both count data and are over dispersed. Both survey and over dispersed data can give too small standard errors when using traditional logistic regression, which can lead to incorrect findings(Reference Ver Hoef and Boveng22). To address both the survey and over dispersed nature of this data, we employed survey weighted Poisson regression (via a quasi-Poisson link)(Reference Ver Hoef and Boveng22). This method is fully available within the R package survey(Reference Lumley23). This approach was used to give more accurate standard errors which we hoped would lead to more accurate and interpretable findings for the US adult (twenty-one or older) population.
To build the base regression model, a two-part plan of action was employed. First, we fit the full model (all eight covariates and confounders entered the model as well as diabetes). Second, we would remove the insignificant variable(s) one at a time until a final base model was established that was interpretable and statistically valid (parameter estimate interpretability and model diagnostic checks). For the outcome, this base model would be used as the basis for which we explored subgroups of diabetes on mental health days. Using the R package, rFSA(Reference Lambert, Gong and Elliott C16,Reference Lambert, Gong and Elliott24) , the FSA would be employed to identify nutrient and demographic two- and three-way interactions which included diabetes. All available nutrient and demographic variables were available to be explored. Once the FSA procedure was completed, the identified interactions would be examined by interpreting their parameter estimates as well as a visual aid (graph) meant to display the identified relationship. Also, interpretability considering the current literature was also completed.
Results
Base regression model results
From the survey-weighted logistic regression with the quasi-Poisson link for mental health, race was removed due to being insignificant (P-value > 0⋅05) which left age, BMI, gender, education, FIP, smoking status and the number of physical health days as covariates for adjustment in the base model. While adjusting for these variables and including diabetes status, the model estimated that those with diabetes had a 9 % (P-value = 0⋅115) higher number of mental health days than those without diabetes. This model will be referred to as base model 1, and its estimates and 95 % confidence interval (CI) are contained on the left side of Supplementary Table A2.
Interaction results
Using the mental health base model identified in 3⋅4, we utilised the FSA approach to explore subgroups of patients with diabetes on mental health. For this approach, all available nutrient and demographic variables were available to be explored. One result from this approach was identified as statistically valid and clinically interesting. The FSA procedure identified a three-way interaction between diabetes, cis-b-carotene and FIP to include in the base statistical model. The base model with interactions estimates and 95 % CI are contained on the right side of Supplementary Table A2. No significant two-way interactions with diabetes were found using the FSA approach. While adjusting for age, gender, education, FIP, BMI, smoking status and the number of physical health days in the last 30 d, the model estimated that participants with diabetes who had FIP < 1 (below poverty level) and cis-b-carotene <=0⋅8 μg/dl are estimated to have 9⋅5 mental health days (95 % CI 7⋅5, 12) per month while those with diabetes, FIP < 1 (below poverty level), and cis-b-carotene > 0⋅8 μg were estimated to have just 4 mental health days (95 % CI 2⋅3, 6⋅9) per month. This estimated 136 % increase in mental health days can be calculated from the estimates in Supplementary Table A2 and is illustrated in Fig. 2. The figure plots the marginal effects of the interaction term from the model with the interaction found by FSA. Within the participants with diabetes column of Fig. 2, participants with diabetes with cis-b-carotene <=0⋅8 μg/dl and a FIP below 1 (notated by an ‘*’ in the figure, N = 198) have a visually higher number of estimated mental health days than participants with diabetes with cis-b-carotene > 0⋅8 μg/dl and a FIP below 1 (notated by an ‘#’ in the figure, N = 133). Similar differences can be seen for other combinations of FIP and cis-b-carotene in the participants with diabetes group (see ‘&’ and ‘+’ notations) as well as combinations within the participants without diabetes group.

Fig. 2. Results for modification of diabetes on mental health by cis-b-carotene and FIP.
Discussion
Interactions results for the number of mental health days
The interaction findings in the section ‘Interaction results’ suggest that adult participants with diabetes who have a FIP < 1 may see a greater number of poor mental health days per month if they have also cis-b-carotene levels at or below 0⋅8 μg/dl as compared with participants with diabetes who have FIP < 1 but instead have cis-b-carotene levels above 0⋅8 μg/dl. Participants with diabetes who can increase their cis-b-carotene levels may see a decrease in their number of poor mental health days per month. The result with FIP is not surprising and was found prior to identifying the interaction in the base model. What is interesting is that the effect of FIP < 1 in participants with diabetes on the number of mental health days may be made better by increasing amounts of cis-b-carotene. β-Carotene is a type of carotenoid that acts as a precursor of vitamin A and functions as a ligand to regulate the expression of genes involved in metabolic processes and is mostly found in fruits and vegetables(Reference Ross, Zolfaghari and Weisz25). Recent studies have shown controversial findings regarding the protective effect of β carotin Type 2 diabetes. The findings in the present study are supported by studies from Polidori et al. (Reference Polidori, Mecocci and Stahl26) and Abahusain et al. (Reference Abahusain, Wright and Dickerson27) which both reported that β carotene was significantly lower in individuals with type 2 diabetes as compared with non-diabetic control participants. Evidence from prospective cohort studies also supports an inverse association between the incidence of type 2 diabetes and dietary or plasma concentrations of b-carotene(Reference Montonen, Knekt and Jarvinen28). However, studies by Song et al. (Reference Song, Cook and Albert29) and Kataja-Tuomola et al. (Reference Kataja-Tuomola, Kontto and Männistö30,Reference Kataja-Tuomola, Kontto and Männistö31) complicate the understanding of the relationship as they reported no statistical evidence that supplementation with β-carotene had an effect on the incidence of type 2 diabetes and/or fasting plasma glucose.
The plausibility of this relationship stems from a few possibilities, first the antioxidant effect that beta-carotene is known to have. They can effectively eliminate reactive oxygen species and other free radicals and protect from oxidative stress and subsequent damage(Reference Fiedor and Burda32). Studies have found that the development of depression is related to imbalance between antioxidant and prooxidants levels and is often accompanied by oxidative stress which, in turn, causes DNA damage(Reference Sarandol, Sarandol and Eker33). There is also fundamental evidence that the antioxidant property of beta-carotene has a protective role from the oxidative stress and subsequent damage often caused in depression. In addition, research has suggested that the antidepressant properties of beta-carotene may be related to its ability to increase brain-derived neurotrophic factor (BDNF) and decrease levels of tumour necrosis factor-a (TNF-a) and interleukin-6 (IL-6)(Reference Kim, Kim and Kim34). Several studies have investigated the effects of beta-carotene on mental health. Ge et al. examined the relationship between dietary intakes of carotenoids and the risk of depressive symptoms using data from NHANES during 2009–16 and they found a similar association. They reported that beta-carotene intake may be inversely associated with the risk of depressive symptoms in the US adults(Reference Ge, Yang and Sun35). The findings of the present study are also supported by the findings of the meta-analysis by Zhang et al. who reported that beta-carotene intake is inversely associated with depression(Reference Zhang, Ding and Liang36).
It is also possible that higher serum beta-carotene is serving as a surrogate for higher fruit/veggie intake, indicating a higher diet quality. However, there are many other carotenoids and antioxidant nutrients in fruits and vegetables included in the current analysis (i.e. lutein, lycopene, b-cryptoxanthin and tocopherols) that were not identified as having the same relationship with mental health days as beta-carotene, leading us to believe that there is something special about this nutrient.
Limitations
There are various limitations to our example study. No longitudinal data was collected on these participants related to our phenomenon of interest and micronutrient measurements were not collected at multiple time points (which may be necessary to assure they are accurately measured). Finally, unobserved heterogeneity between those classified as participants with diabetes and those without may not have been adequately controlled for with our covariates and confounders.
Implications
This proposed methodology can help us to realise the goal of using precision nutrition to reduce morbidity and mortality associated with many chronic diseases. Major health organisations (USDA, NIH) have recognised the important role that individualised nutrition can play in accomplishing this goal(Reference Stover and King37). While it has been recognised that individuals with certain phenotypes respond better to certain medications, it is also becoming apparent that some individuals are more sensitive to certain nutrients, and thus, they may experience a greater benefit from a specialised nutrition intervention.
However, the challenge has been in the identification of subgroups who are most likely to benefit from specific nutrients, beyond those individuals who are deficient in those nutrients. Nutrition studies using traditional data analysis methods have been largely unsuccessful in identifying subgroups, as the focus has been on the average response rather than individual responses. There is often wide variability among individuals in these nutrition studies and all facets of biological differences (genetics, gut microbiome, gender, disease status, etc.) affect an individual's response to a nutritional intervention(Reference Stover and King37). In fact, it has been suggested that participants recruited for nutrition studies may not be the ones most likely to experience a benefit. For example, many studies have tested the ergogenic potential of antioxidant supplements, however, the wide range of oxidative status of participants likely plays a role in the overall lack of response to antioxidants that has been reported(Reference Margaritelis, Paschalis and Theodorou38). There also appear to be individual responses to consumption of macronutrients, due to characteristics not commonly assessed in nutrition studies (such as genetics and gut microbiota), making it even more apparent that nutrition is not a one size fits all strategy(Reference San-Cristobal, Navas-Carretero and Martínez-González39).
There is clearly a need for statistical methods which can identify subgroups of people with enhanced sensitivity to nutritional status, in order to be able to use nutrition as medicine to prevent and manage chronic diseases.
Conclusion
In the present paper, we present a strategy for exploring subgroup-specific effects in studies focused on nutrition science. We present an example of utilising the method and exploring the effects of micronutrients and demographic factors in participants with diabetes on the number of mental health days they were experiencing.
While there are limitations to exploratory analysis, there are many potential impacts from completing an exploratory analysis meant to uncover subgroup-specific effects. One strength of our proposed method is that the investigator can control known potential covariates and confounders and use a regression technique appropriate for outcome characteristics and distribution (e.g. survey-weighted Poisson). The FSA procedure can harness this regression adjustment while illuminating interesting and workable subgroups to follow up with and investigate further. Finally, if the effects of certain vitamins or micronutrients are only present in subgroups of participants with the outcome of interest, then taking the time to explore interactions in statistical models or completing a specified subgroup analysis is required to identify their effects. The proposed methodology and FSA procedure enables the investigator to complete this initial exploration.
Supplementary material
The supplementary material for this article can be found at https://doi.org/10.1017/jns.2022.107.
Acknowledgements
We would like to thank the reviewer for the valuable feedback and comments they provided.
J. L., K. B., T. X. and A. P. drafted the manuscript. J. L., K. B. and T. X. researched the literature. J. L. contributed to the statistical analysis. J. L. collected the data from NHANES. J. L., K. B., T. X. and A. P. contributed to editing the manuscript. J. L. conceived and supervised the study.
This research received no specific grant from any funding agency, commercial or not-for-profit sectors.
The authors declare that they have no conflict of interest.


 Open access