


The Great East Japan Earthquake occurred on 11 March 2011, followed by a tsunami and a nuclear disaster, forcing the long-term evacuation of 185 000 residents from widespread surrounding areas. To monitor the long-term health of Fukushima residents, the prefectural government assigned the Fukushima Medical University to design and implement health management surveys for this population starting in May of 2011. Given that many evacuees who had moved to the government-designated evacuation zone could have changed their lifestyle, diet, exercise and other personal habits, their risk of developing lifestyle diseases, such as CVD, could have increased(Reference Yasumura and Abe1,Reference Ohira, Nakano and Nagai2) . Having an understanding of residents’ dietary stability after the disaster is important, particularly for Fukushima evacuees.
Changes in nutrient intake can be difficult to evaluate and might not be accurately reflected over time. Dietary patterns, however, more closely resemble actual eating behaviours for studying the synergistic effects of multiple food groups rather than single food groups or nutrients; thus, foods eaten in combination could be used to learn about changes in people’s dietary habits(Reference Hu3). Investigational methods of analysis of changes and/or the stability of dietary patterns identified by principal component analysis have been inconsistent in longitudinal studies(Reference Northstone and Emmett4). The aim of this study was to determine whether dietary patterns changed between 2011 and 2013 in Fukushima residents after the 11 March disaster in terms of the Fukushima Health Management Survey (FHMS).
Methods
Study participants
The FHMS was initiated in 2011 after the great earthquake. The target population for the Mental Health and Lifestyle Survey, a part of FHMS, was 210 189 residents comprising those living along the radiation disclosure areas(Reference Yasumura, Hosoya and Yamashita5). The evacuation zone was specified by the government according to spatial radiation dose rates, and residents in Hirono Town, Naraha Town, Tomioka Town, Kawauchi Village, Okuma Town, Futaba Town, Namie Town, Katsurao Village and Iitate Village, as well as those in some areas of Tamura City, Minami-Soma City, Kawamata Town and Date City, were defined as evacuees. Residents in rest areas of Tamura City, Minami-Soma City, Kawamata Town and Date City and those in municipalities other than the evacuation zone were defined as non-evacuees(Reference Ohira, Nakano and Nagai2,Reference Yasumura, Hosoya and Yamashita5) . The details of the study protocol and the baseline profiles have been described in a previous publication(Reference Yasumura, Hosoya and Yamashita5). We used data from the Mental Health and Lifestyle Survey conducted in 2011, 2012 and 2013, which contained a self-administered questionnaire on demographic characteristics, medical history, smoking habits, alcohol consumption, physical activity, occupation and other factors, as well as a FFQ. Participants (73 368 in 2011, 54 063 in 2012 and 45 233 in 2013) aged 16 years and older were assessed for this study.
Dietary intake assessment
A short-form FFQ was used to examine the food intake of nineteen food items during the preceding 6 months. The FFQ used in this study was a modified version of the one used in the Hiroshima and Nagasaki Life Span Study(Reference Sauvaget, Allen and Hayashi6). In the validation study of the original FFQ, the frequency of food intake as measured by the FFQ was moderately correlated with food intake as measured by the 24-h recall records, for example, the Spearman’s correlation coefficient of fruit, milk, miso soup, beef/pork, rice and bread was between 0·14 and 0·34(Reference Sauvaget, Allen and Hayashi6). The nineteen food items were divided into six food groups: non-juice fruits/vegetables (fruit, green vegetables, red and orange vegetables, and light-coloured vegetables); fruit/vegetable juices; meat (chicken, beef, pork, ham and sausages); soya bean products (fermented soya beans, soya milk, miso soup, tofu, and boiled beans); fish (raw and cooked) and dairy products (milk, yogurt and lactobacillus drinks). Participants were asked how frequently they consumed individual food items, with six response choices: none, <1, 1–2, 3–4, 5–6 times/week or every day.
Statistical analysis
We excluded participants who had more than three missing pieces of responses regarding dietary items(Reference Zhang, Ohira and Abe7), leaving 156 477 participants (67 358 in 2011, 48 377 in 2012 and 40 742 in 2013) for this analysis (online Supplemental Figure S1). For the surveys with missing answers to the dietary questions (13·5 % missing one and 4·7 % missing two), we used the median value of frequency of that food item, by survey year and sex, to replace the missing values(Reference Zhang, Ohira and Abe7). For the frequency of dietary intake for each food group, the daily midpoint for the frequency category was used, for example, 3–4 times per week was assessed as 0·5 times/d(Reference Zhang, Ohira and Abe7).
All the data were analysed using the SAS statistical software package ver. 9.4 for Windows (SAS Institute). Dietary patterns were derived from a year- and sex-specific factor analysis of nineteen food items without alcohol consumption by using the FACTOR Procedure of SAS. A varimax rotation was used for the identified factors to improve their interpretability. Factor numbers were selected mainly according to eigenvalues >1·5, scree plots and factor interpretability. Food items with absolute factor loadings ≥0·3 were considered to account for each component(Reference Luger, Aspalter and Luger8). The derived dietary patterns (factors) were labelled based on food items with high factor loadings for each factor. Factor scores for each dietary pattern in an individual were estimated as a linear combination of standardised values for food items and standardised scoring coefficients. Dietary pattern scores (the factor scores) were calculated for available participants in 2010, 2011 and 2013, respectively.
Significant trends of dietary intake proportions were examined using the Cochran–Armitage test with setting up the frequency of ≥0·5 time/d as the cut-off value. The associations between individual dietary scores at the various time points were assessed using Spearman’s correlation coefficient. The general linear regression models were applied to examine the difference of means of three dietary patterns’ scores, respectively, between evacuees and non-evacuees. The lifestyle covariates of impact on dietary intake were selected based on the previous publications for FHMS(Reference Zhang, Ohira and Abe7,Reference Nagai, Ohira and Zhang9) , which including age (continuous), smoking habits (no, former or current), alcohol drinking (no, former or current), self-reported health condition (very good, good, normal, poor or very poor), educational level (elementary/junior high, high school, vocational college or undergraduate/graduate), physical activity (everyday, 2–4, 1 time/d or none), history of diagnosed chronic disease (at least one (hypertension, hyperlipidaemia, cancer, stroke, heart disease, diabetes or chronic hepatitis) or none), depression (weak (K6 < 13) or strong (K6 ≥ 13)) and employment (no change, unemployment or change a job). In each independent category variable, a reference was assigned and the multiple comparisons of difference were examined by Dunnett tests. Least square means of dietary pattern scores stratified by survey years, sex and evacuated status were calculated, with Tukey tests for examining the differences among categories, and the same other covariates for adjustment.
A sensitivity analysis was given to 22 805 participants who contributed FFQs for the above approaches for all 3 years, including the derivation of dietary patterns, examinations of correlation coefficients of each pattern scores among years and comparisons of means of dietary pattern scores between evacuees and non-evacuees and other groups of covariates by the general linear regression analysis. All P values reported were two-sided, and the significance level was set at <0.05.
Results
Participants’ characteristics are shown in Table 1. Approximately 63·5 % of evacuees completed the surveys. Around half of the participants had a high school education, and more than 17 % of the participants reported having a poor health condition. Current smokers were more than 28 %, and alcohol drinkers were 60 % in men, whereas the rates were more than 8 and 25 % in women, respectively. Approximately 50 % of participants had at least one chronic disease historically diagnosed. About 55 % of participants had daily physical activity more than once. Both men and women had the decline tendency of strong depression over years. The proportion of unemployment in 2011 was 35·8 % in men and was 26·8 % in women, which were higher than those in 2012 and 2013, respectively.
Table 1 Participants’ characteristics, Fukushima Health Management Survey, 2011–2013 (n 156 477)

* Hypertension, hyperlipidaemia, cancer, stroke, heart disease, diabetes or chronic hepatitis.
The means of soya milk, boiled beans, fruit juice and vegetable juice intake were <0·17 times/d, and of miso soup, rice, vegetables and fish were >0·41 times/d both in men and women. Meanwhile, the means of yogurt and fruit intake were >0·4 times/d in women. Over the study years, the significantly increased trends of eating more than 0·5 times/d were observed in most of the dietary foods/food groups in both men and women, whereas the significantly decreased trends were rice and miso soup in men and rice, ham and miso soup in women. No significant trends of changes in frequency were observed for beef, bread and ham in men and for bread, tofu, white vegetables and fruit juice in women over 3 years (online Supplemental Table S1).
The factor loadings of food items were similar both in men and over 3 years (Fig. 1). The typical pattern included the main types of vegetables, tofu (bean curd), miso soup, fish, bean products and rice; the juice pattern included vegetable juice, fruit juice, yogurt, soya milk, boiled beans, fruit and milk; and the meat pattern included beef/pork, chicken and ham/sausage. Online Supplemental Table S2 shows the factor loadings for the identified dietary patterns.

Fig. 1 Factor loadings of food items by sex and survey years. (a and c) ![]() , Men; +, women; (b)
, Men; +, women; (b) ![]() , women; +, men
, women; +, men
Dietary scores were highly correlated for three patterns both in men and women over years (Table 2). In total participants, the Spearman’s correlation coefficients between two survey years were 0·70–0·74 for the typical, 0·58–0·66 for the juice and 0·50–0·54 for the meat pattern scores. Both in the analysis of total participants and the sensitivity analysis, the coefficients of the typical and the meat pattern were slightly higher in women than those in men; and those of the juice pattern were lower in women than those in men. In total participants, the coefficients of scores among the 3 years were 0·72–0·75 for the typical pattern, 0·62–0·68 for the juice pattern and 0·52–0·55 for the meat pattern in non-evacuees, whereas they were 0·68–0·73, 0·57–0·65 and 0·49–0·54, respectively, for the corresponding pattern scores in evacuees. Consistent coefficients were observed for evacuees and non-evacuees in the sensitivity analysis (data not shown).
Table 2 Spearman’s correlation coefficients between dietary pattern scores, Fukushima Health Management Survey, 2011–2013

Table 3 shows the adjusted means and 95 % CIs of dietary pattern scores among sociodemographic factors. For most factor categories, the pattern scores were positive. The evacuees had negative typical pattern scores; the typical pattern scores were lower, but the juice pattern scores were higher than in non-evacuees. The higher the education level, the higher the scores of typical and juice patterns. As the health conditions declined, the typical and meat pattern scores declined. Current smokers had lower typical and meat pattern scores but higher juice pattern scores than non-smokers. Alcohol drinkers had higher scores of typical pattern but lower scores of juice and meat pattern than nondrinkers. Participants with more physical activities had higher scores in each pattern. Residents with strong depression had lower typical pattern scores but higher juice pattern scores comparing to residents with weak depression. In addition, the unemployed and those changed a job after disaster had lower typical pattern scores than those without changes. Furthermore, the distributions of pattern scores were not affected by the subsample of the total 22 805 participants who completed three consecutive surveys (data not shown).
Table 3 Least square means and 95 % CI of dietary pattern scores, Fukushima Health Management Survey (n 123 088)*
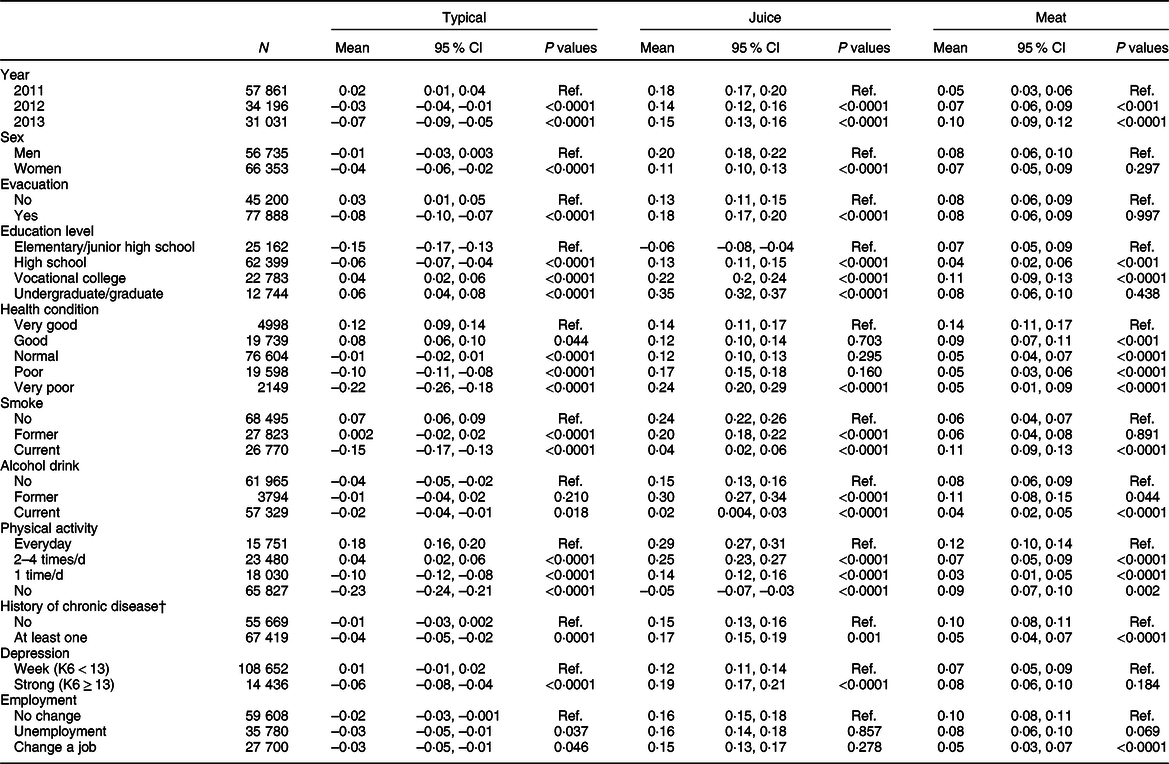
* Adjusted for age (continuous) at survey year and all covariates above in the regression model as the main effect.
† Diagnosis of hypertension, hyperlipidaemia, cancer, stroke, heart disease, diabetes or chronic hepatitis.
Adjusted means of dietary pattern scores in evacuees and non-evacuees were plotted along survey years in Fig. 2 (a, for total participants; b, for those who provided all three dietary assessments). Distributions of each dietary pattern scores between men and women were very similar. Both in men and women, means of typical pattern scores were higher in non-evacuees than in evacuees (P < 0·001 in each year), while those of juice pattern were lower in non-evacuees than in evacuees (P < 0·001 in each year, except for women in 2011, P = 0·061). The typical pattern scores were positive and declining in non-evacuees (2013 v. 2011: P = 0·001 in men and P = 0·021 in women), while they were negative and more sharply declining in evacuees over years (2013 v. 2011: P < 0·001 both in men and women). The juice pattern scores significantly decreased in non-evacuees (2013 v. 2011: P < 0·001 both in men and women) but not in evacuees (2013 v. 2011: P = 0·151 in men and P = 0·142 in women) over years. Meat pattern scores showed significantly increasing both in men and women regardless of the evacuation status.
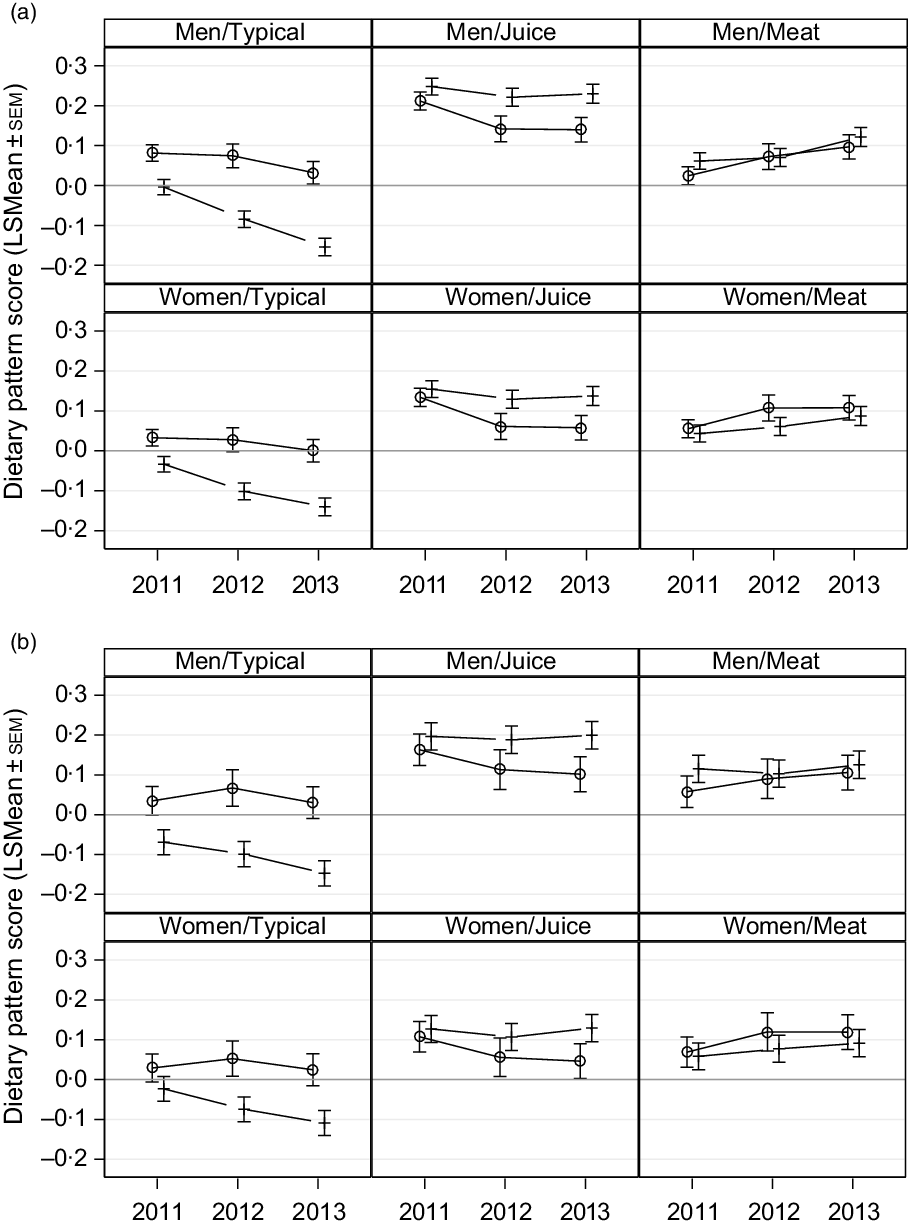
Fig. 2 Least square means of dietary pattern scores in evacuees and non-evacuees among survey years in total men and women (a) and those who had all three dietary assessments (b), adjusted for education level, smoking status, alcohol drinking, daily physical activity, self-reported health condition, history of diagnosed chronic disease, depression level and employment status. ![]() , Non-evacuee; +, evacuee;
, Non-evacuee; +, evacuee; ![]() , non-evacuee;
, non-evacuee; ![]() , evacuee
, evacuee
For sensitivity analysis, the same three dietary patterns were identified and the distributions of means of pattern scores were similar to the results of total participants (Fig. 2(b)). However, evacuees had the significant decline of typical pattern scores (2013 v. 2011: P < 0·001 in men and P < 0·001 in women), while non-evacuees had the significant decline of juice pattern scores (2013 v. 2011: P = 0·013 in men and P = 0·006 in women). In contrast, there were no significant differences among means of typical pattern scores in non-evacuees (2013 v. 2011: P = 0·846 in men and P = 0·833) and of juice pattern score in evacuees (2013 v. 2011: P = 0·883 in men and P = 0·894 in women).
Discussion
We identified three dietary patterns: the typical, the juice and the meat pattern, and we examined the dietary stability over the years as a whole. The analysis results suggested that there was little variation in food consumption patterns in both men and women over the years. Based on the dietary scores, we described the discrepancy of dietary patterns among sociodemographic factors.
The Japanese dietary pattern consists of a combination of dietary staples, side dishes and soup(Reference Suzuki, Goto and Ota10). Although direct comparisons could not be made across publications, the three patterns derived in our study had dietary categories similar to other studies(Reference Crozier, Robinson and Godfrey11). For example, compared with other studies, the identified typical pattern in this study corresponded to the ‘traditional Japanese’(Reference Tomata, Sugawara and Chou12,Reference Htun, Suga and Imai13) or ‘healthy’ pattern(Reference Nanri, Hara and Nishida14–Reference Ito, Kawakami and Tanisawa16); the meat pattern to the ‘animal food’(Reference Tomata, Sugawara and Chou12,Reference Htun, Suga and Imai13,Reference Nishi, Yoshimura and Ishikawa-Takata17) or ‘Western’ pattern(Reference Nanri, Hara and Nishida14) and the juice pattern to the ‘high dairy’(Reference Tomata, Sugawara and Chou12), ‘bread-dairy’(Reference Htun, Suga and Imai13) or ‘bread’ pattern(Reference Nanri, Hara and Nishida14). After the great earthquake, a study from the neighbouring prefecture identified a ‘prudent pattern’ and a ‘meat pattern’ by a short-form FFQ, in which the prudent pattern was similar to the typical and juice pattern in our study(Reference Nishi, Yoshimura and Ishikawa-Takata17). Some studies explored dietary patterns including alcoholic drinks, tea or coffee(Reference Tomata, Sugawara and Chou12,Reference Ito, Kawakami and Tanisawa16) . The Osaki cohort study identified nine Japanese Diet Index Scores by a FFQ with thirty-nine food items, which included rice, miso soup, seaweed, pickles, green and yellow vegetables, fish, green tea, beef and pork, and coffee(Reference Tomata, Sugawara and Chou12). Another dietary study identified more patterns, such as ‘dessert’(Reference Nanri, Hara and Nishida14). As we know, for FFQs with different food items and/or surveyed in different populations, the dietary patterns identified might be different. Nevertheless, the study FFQ, although it was short-form, the similar coverage of main food groups could be used to clarify the stability of dietary patterns in this study population over the years.
The advantage of this study is that the abundant data provided for an analysis with a strong statistical power. Although the response rate to the FFQ survey was 60·7 % overall in 2011, among 67 358 participants in the 2011 survey, 63·4 % completed the surveys in 2011 and 2012, and 33·9 % participants completed all three rounds of surveys, showing similar results. The original FFQ was moderately correlated with the 24-h dietary records; our study by using the slightly modified FFQ could assess the changes of dietary food patterns among sociodemographic groups. The present study showed moderate-to-higher correlations between dietary pattern scores over 3 years, which were similar to other studies(Reference Northstone and Emmett4,Reference Luger, Aspalter and Luger8,Reference Crozier, Robinson and Godfrey11,Reference Mishra, McNaughton and Bramwell18) . Further, by the sequential annual surveys, we could closely monitor residents’ dietary status.
Mulder et al.(Reference Mulder, Ranchor and Sanderman19) had reported that the stability in dietary score after 4 years was moderate (correlations of 0·61), but stability varied according to lifestyle behaviour. It is important to include repeated measures of dietary assessment over time to incorporate individual changes in complex dietary behaviour(Reference Mishra, McNaughton and Bramwell18). In general, we observed that dietary pattern scores were lower in the evacuees than in the non-evacuees. The FMHS has reported that living in nonhome conditions has been associated with a poor dietary intake of fruits and vegetables, meat, soya bean products and dairy products(Reference Zhang, Ohira and Abe7). Our analysis showed similar but more comprehensive results, for example, higher intakes of the juice pattern in evacuees than in non-evacuees. A French study has shown that migrant status was associated with a risk of low-frequency consumption of fruits and vegetables, meat, seafood, eggs and dairy products(Reference Mejean, Deschamps and Bellin-Lestienne20). Non-evacuees or those who lived in a relative’s home would be more familiar with nearby living environment and perceived better access to supermarkets, promoting a more balanced daily dietary intake(Reference Zhang, Ohira and Abe7,Reference Mejean, Deschamps and Bellin-Lestienne20,Reference Caspi, Kawachi and Subramanian21) . This result might reflect the fact that the evacuees who were living at shelters after the disaster did not have full access to or consume enough fresh vegetables. It has been reported that 79·1 % of shelters at the first month after the earthquake had a food supply shortage, for example, each day 18·8 % of shelters had three dishes of vegetables, including soup, and 14·5 % of shelters had three dishes of meat and fish, 13·0 % shelters had two dishes of fruits, meat and fish and only 15·9 % of shelters had milk and dairy products once a day(Reference Tsuboyama-Kasaoka, Hoshi and Onodera22). The Fukushima neighbouring study also indicated that individuals living in difficult conditions had lower ‘prudent dietary pattern’ scores than those living in acceptable conditions(Reference Nishi, Yoshimura and Ishikawa-Takata17). Those who did not live at home, with limited room space and simpler kitchen equipment, had difficulty eating balanced daily meals(Reference Zhang, Ohira and Abe7,Reference Nishi, Yoshimura and Ishikawa-Takata17,Reference Tsuboyama-Kasaoka, Hoshi and Onodera22) .
Similar to the other studies(Reference Nishi, Yoshimura and Ishikawa-Takata17,Reference Sadakane, Tsutsumi and Gotoh23) regarding other sociodemographic factors, the higher the education levels, the higher the typical pattern scores; smokers had negative typical pattern scores, and their scores were lower than non-smokers. Importantly, women had lower scores in the typical and juice patterns than men, while the vegetable pattern was more likely to be followed by women(Reference Olinto, Willett and Gigante24). Residents who reported being in poor health condition had negative and lower scores in the typical and meat patterns than those reporting good health conditions. This emphasised that to adopt better dietary habits, food availability, supply and continuous nutritional support by dieticians are necessary for helping those living in difficult conditions, especially for vulnerable populations(Reference Nishi, Yoshimura and Ishikawa-Takata17,Reference Yanagihara, Hatakeyama and Iwasaki25) .
The study had some limitations. First, the FHMS response rates remained at approximately 27 %(Reference Yasumura and Abe1), whereas the FFQ response rates decreased from 2011 to 2013. Thus, the representativeness of this study on dietary patterns might not be generalisable to the whole prefecture or to the country’s general population. Second, the validity and reproducibility of this modified FFQ had not been verified. We could not compute the food intake amount and therefore could not compute nutrients and conduct energy-adjusted analysis; we only used food frequencies for deriving dietary patterns in this study. Without the estimated intake of nutrients, the nutritional status and needs would be difficult to evaluate, particularly in vulnerable evacuees after the disaster(Reference Tsuboyama-Kasaoka and Purba26). Also, food consumption was self-reported, and dietary reporting is generally underreported. These findings could lead to nonrandom misclassifications(Reference Luger, Aspalter and Luger8). Meanwhile, a total of nineteen food items might not sufficiently indicate changes in the intake of specific foods/food groups, given the identified patterns only explained 7·5–8·0 % of the variations at each year. The FFQ in our study had the same food groups as other studies but might not cover more detailed food items to be incorporated in this analysis(Reference Tomata, Sugawara and Chou12,Reference McCann, Marshall and Brasure27) . Third, although our results showed significant correlations among dietary scores, the short term of three consecutive years and no previous survey results as controls might not encompass the long-term effect in Fukushima residents.
In summary, changes in dietary patterns in both men and women have been observed between 2011 and 2013, with typical and juice pattern scores in particular. Careful investigation of those who have insufficient intake of typical pattern foods and promotion of them, particularly for evacuees, are needed.
Acknowledgements
Acknowledgements: The authors would like to thank Enago (www.enago.com) for the English language review. Financial support: This survey was supported by the National Health Fund for Children and Adults Affected by the Nuclear Incident for design and conduction of the study. The findings and conclusions of this article are solely the responsibility of the authors and do not represent the official views of the Fukushima Prefecture government. Conflict of interest: All authors declared no conflicts of interest. Authorship: E.M. developed the hypothesis and drafted the manuscript; E.M., T.O. and H.N. analysed the data; T.O., S.Y., H.Y., M.M., A.S. and K.K. collected and provided the data; T.O., S.Y., M.M. and K.K. revised the manuscript. Ethics of human subject participation: This study was conducted according to the guidelines laid down in the Declaration of Helsinki and all procedures involving research study participants were approved by the Committee for Ethics at Fukushima Medical University (application No. 1316 and 1319). Written informed consent was obtained from all subjects.
Supplementary material
For supplementary material accompanying this paper visit https://doi.org/10.1017/S1368980020000300


