


Identifying the best diet to prevent chronic diseases has been a priority in public health. Traditionally, research in nutrition has focused on isolated nutrients or specific foods, although individuals do not consume only nutrients or foods. Thus, nutritional studies, on an epidemiological scale, shifted the focus of attention to the analysis of the dietary pattern, addressing general diet considering the foods, food groups and nutrients included; their combinations and variety and the frequency with which they are usually consumed(Reference Hu1).
In the past decades, some indexes were developed to assess diet quality (Healthy Eating Index, Mediterranean Diet score and Dietary Approaches to Stop Hypertension score), which aim to measure adherence to dietary guidelines(Reference Vyncke, Fernandez and Pascual2). The diet quality index is a summary score of any individual diet that meets the dietary recommendations of each country(Reference Haines, Siega-Riz and Popkin3).
The Healthy Lifestyle in Europe by Nutrition in Adolescence study adapted the Diet Quality Index for adolescents (DQIA)(Reference Huybrechts, Vereecken and De Bacquer4). This index was originally developed for preschool children, from the FFQ, being considered as a fast and accurate instrument for assessing diet quality. This instrument presents three basic principles that include balance (adequacy and moderation), variation/diversity and quality of the food consumed(Reference Vyncke, Fernandez and Pascual2).
In Brazil, the Study of Cardiovascular Risks in Adolescents (ERICA) adapted the DQIA, calling it DQIA-BR. The adaptation considered the 24-h recall as an instrument to assess food intake and maintained as a reference the Flemish Food-Based Dietary Guidelines. These guidelines are in line with the nutritional guidelines of the WHO, specifically with the Countrywide Integrated Noncommunicable Disease Intervention (CINDI). Moreover, adaptations to the Brazilian dietary culture were performed, such as the separation of the intake of proteins (group of meats, fish and substitutes) into two groups (animal protein and vegetable protein) and the addition of a separate group for beans. Moreover, carbohydrates were pooled into a single group (bread, potatoes and grains), and water intake was excluded because information on this component was not complete(Reference Ronca, Blume and Cureau5). However, the recommended intake values for the food groups were the same as those indicated by the CINDI dietary guide.
The CINDI dietary guide was developed to assist CINDI countries in developing policies and programmes that promote healthy food consumption patterns consistent with local conditions and cultures in the European region(6), which is not necessarily conducive with the nutritional needs of the Brazilian population.
Currently, the few DQI for the assessment of the diet quality of adolescents are specific to the social and cultural characteristics of each country or region(Reference Vyncke, Fernandez and Pascual2,Reference Jarman, Vashi and Angus7,Reference Núñez-Rivas, Holst-Schumacher and Campos-Saborío8) . Moreover, the DQIA-BR is a European dietary guide that has been adapted to the Brazilian context. Hence, it is important for this adaptation to be based on Brazilian recommendations, contributing to the creation of a more appropriate tool for the assessment of food intake among Brazilian adolescents.
The aim of the present study was to adapt the Diet Quality Index to Brazilian adolescents based on a FFQ according to the recommendations of the Brazilian food pyramid and evaluate its association with food and nutrient intake as well as metabolic parameters in adolescent students in the city of Recife.
Methods
Design, casuistry and place of study
This is a cross-sectional, school-based study nested in a prospective cohort study (‘Dyslipidaemia and its association with overweight, sedentary lifestyle and oxidative stress in a cohort of school students in Recife-PE’), conducted from March to April 2013. The study was conducted in the city of Recife, which is the capital of the state of Pernambuco located in the northeastern region of Brazil. At the last census, the Human Development Index of Recife was 0·772(9).
The eligibility criteria were adolescents aged 12–19 years, of both genders, from public schools in Recife city, northeastern Brazil. Adolescents who reported using medications that could alter the glycolipid profile and pregnant adolescents were excluded.
The sample size was based on an estimated prevalence (p) of vitamin D deficiency of 21·3 %(Reference Silva, Cureau and de Oliveira10), a sampling error (d) of 5 % and a 95 % CI (z α/2 = 1·96). Applying the formula n = ((z α/2 2 × p × (1 – p))/d 2(Reference Berquó, Souza and Gotlieb11) resulted in a sample (n) of 258 adolescents. Considering that this study used a cluster sampling approach, the design effect was corrected based on an intracluster variation (ICV) of approximately 0·02(Reference Santos, Diniz and Nogueira12) and a cluster dimension (M) of 50 sample units. Using the formula design effect = (1 + (M –1) × ICV)(Reference Bland13) resulted in a minimum number of 542 sample units. Considering that the number of adolescents monitored by the cohort represents a finite population (N), correction was performed using the formula n = n/(1+ (n/N))(Reference Lwanga and Tye14), totaling a minimum of 390 adolescents. To correct any losses, a percentage of 5 % was added (100/(100–5))(Reference Kirkwood and Sterne15), resulting in a sample of 410 adolescents.
Data collection and assessment techniques
Data were obtained through interviews conducted in schools and/or households. Fieldwork was supervised by the researchers, and data were collected by a team of technicians previously trained to measure anthropometric variables and collect biological material for biochemical tests. Additionally, data on the socio-economic-demographic profile, food consumption and lifestyle of adolescents were collected through a standardised questionnaire.
Socio-economic and demographic variables
Data on age, gender and socio-economic classification of the family were collected. In determining the socio-economic level, the ‘Brazilian Criteria for Economic Classification’, established by the Brazilian Association of Research Companies (ABEP)(16), were used. This instrument uses a point scale, obtained by adding the points of possession of household items and the education level of the head of the family, classifying the population in the economic classes high (A1 and A2), medium (B1 and B2), low (C1 and C2) and very low (D and E).
Sexual maturation
Sexual maturation was self-assessed with Tanner drawings (1962)(Reference Tanner17), with stage 1 always corresponding to the infantile, nonpubertal stage, and stage 5 corresponding to the postpubertal, adult stage. The stage of sexual maturation was assessed considering the external genitalia in males and the breasts in females. For females, it was not possible to use information related to pubic hair since in Brazil it is a cultural practice for women to remove pubic hair. The breasts and genitals were evaluated for size, shape and characteristics.
Anthropometric assessment
The anthropometric assessment consisted of a double measurement of weight, height and waist circumference (WC), using the mean of the values. For data consistency, measurements with differences higher than 100 g for weight and 0·5 cm for height and WC were repeated. Weight and height measurements were performed according to the original technique recommended by Lohman et al. (Reference Lohman, Roche and Martorell18). Body weight was obtained on a digital electronic scale (Plenna-MEA-03140®) with a maximum capacity of 150 kg and accuracy of 100 g. Height was measured using a millimeter tape measure (Stanley®) with accuracy of 1 mm and precision of 0·5 cm.
WC was obtained at the midpoint between the last costal arch and the iliac crest with a flexible and inelastic measuring tape without compressing the tissues(Reference Taylor, Jones and Williams19). The waist:height ratio calculation considered the WC measure divided by height, both in centimeters(Reference Zhang, Deng and He20).
Nutritional diagnosis was defined according to the Body Mass Index (BMI) curves for age, following WHO criteria(21). The diagnosis of abdominal obesity considered a WC ≥ 80th percentile according to gender and age(Reference Taylor, Jones and Williams19), and a waist:height ratio ≥ 0·5(Reference Li, Ford and Mokdad22).
Biochemical evaluation
Biochemical analysis was performed after collection of approximately 10 ml of blood by venipuncture, performed at the school or at home, after a verbal confirmation of a 10- to12-h fast. The blood samples were packed in polystyrene boxes containing recyclable ice, sealed and transported to the LAPAC clinical analysis laboratory (LAPAC, Recife, PE, BR) for processing within a maximum period of 2 h. The serum was separated from the red blood cells by centrifugation and placed in two 2 ml tubes. Immediately, an aliquot of the serum was used to analyse serum glucose, TAG, total cholesterol, Low Density LDL, HDL, α-1-acid glycoprotein, parathormone and 25-hydroxyvitamin D. A second aliquot was frozen and sent to the Micronutrient Research Center (CIMICRON) of the Federal University of Paraíba (UFPB, João Pessoa, PB, BR) to determine serum levels of retinol, β-carotene and α-tocopherol.
Serum glucose, TAG, total cholesterol and HDL were determined by enzymatic method. The LDL fraction was evaluated using the Friedewald formula (LDL = CT – HDL – TG/5), considering that all TG values obtained were <400 mg/dl(Reference Friedewald, Levy and Fredrickson23).
Apolipoproteins B and A-I, as well as alpha-1-acid glycoprotein, were quantified by immunoturbidimetry using Roche reagents, calibrators and controls in an automated Cobas MIRA system (Roche, Basel, SWZ).
The 25-hydroxyvitamin D was analysed by HPLC(Reference Holick, Binkley and Bischoff-Ferrari24). Serum levels of retinol, β-carotene and α-tocopherol were quantified according to the technical procedure described by Erhardt and collaborators(Reference Erhardt, Mack and Sobeck25). For that, a liquid chromatograph was used (LC-10Avp, Shimadzu Corporation, Analytical Instruments Division), equipped with a pump (SCL-10Avp), an UV-VIS detector with a deuterium lamp (SPD-10Avp) and manual injector. Chromatography was controlled using the Class-VP 6.12 SP5 software. Chromatographic separation was performed on a C18 reverse-phase column (Shimadzu LC Column – CLC-ODS ‘M’ 25 cm; 4·6 mm ID × 25 cm – 5 μm).
Sample preparation for injection of 50 μl in HPLC (model 305, Gilson, France) consisted of serum thawing at room temperature, this procedure being performed in the dark. Then, 100 μl of extraction solution (ethanol) and 50 μl of serum were pipetted in an amber microtube, homogenised and centrifuged, with separation of approximately 90 μl of supernatant and subsequent refrigeration until the moment of injection into the HPLC. The wavelengths established by the method for α-tocopherol, retinol and β-carotene were 292, 325 and 452 nm, respectively. The running time was set at 4 min for retinol and 22 min for β-carotene.
Physical activity
All adolescents answered the physical activity questionnaire developed and validated by Florindo et al. (2006)(Reference Florindo, Romero and Peres26), which includes questions about physical exercises and activities of locomotion to school. According to physical activity levels, the adolescents were classified as insufficiently active/sedentary (<300 min/week) or sufficiently active (≥ 300 min/week), following WHO criteria(27).
Food intake
Food intake in the last year was assessed by applying a semiquantitative FFQ for adolescents. This questionnaire was developed and validated by Slater et al. (Reference Slater, Philippi and Fisberg28), with adaptations for foods in common use in northeastern Brazil.
The semiquantitative FFQ for adolescents presents questions related to the frequency of consumption of ninety-one food items. It has seven options of frequency of consumption: never or <1 time/month; 1–3 times/month; 1 time/week; 2–4 times/week; 1 time/d; 2–4 times/d and 5 or more times/d.
The calculation of the quantitative food intake of adolescents was analysed by the DietSys program, version 4.01 (National Cancer Institute), which uses as database the Chemical Composition Table of the USA Department of Agriculture (USDA, 2001).
Adapted diet quality index for adolescents for Brazilians
The DQI, originally validated for preschool children(Reference Huybrechts, Vereecken and De Bacquer4), was adapted for adolescents (DQIA)(Reference Vyncke, Fernandez and Pascual2) based on the recommendations of the Flemish Flemish Food-Based Dietary Guidelines and the CINDI food guide. These tools were designed to develop policies and programmes that promote healthy food consumption patterns consistent with local conditions and cultures in the European region.
The DQI structure considers three basic principles for a healthy and balanced diet, which are quality, diversity and balance. Food intake was divided into two groups, the first with consumption of recommended food groups and the second with the consumption of nonrecommended food groups. The group of recommended foods comprises nine subgroups: (1) water; (2) breads and cereals; (3) grains and potatoes; (4) vegetables; (5) fruits; (6) dairy products; (7) cheese; (8) meat; fish, eggs and substitutes and (9) fat and oils. In turn, the group of nonrecommended foods consists of (1) snacks and sweets and (2) sugared drinks and concentrated fruit juices.
For each food group, a range of recommended daily intake was defined specifically for adolescents by the Flemish Food-Based Dietary Guidelines. Considering the socio-economic and cultural differences between European and Brazilian recommendations, this adaptation considered the recommendations of the Brazilian food pyramid(Reference Philippi, Latterza and Cruz29), which uses the recommendation of proportions for each 1000 kcal without determining minimum and maximum intake limits, and the water intake component was excluded due to the absence of an intake recommendation. Thus, the Diet Quality Index for Adolescents for Brazilians adapted (DQIA-BR-A) consists of eight food groups subdivided into recommended foods: (1) cereals, tubers, roots and derivatives; (2) beans; (3) fruits and natural fruit juices; (4) vegetables and greens; (5) milk and dairy products; (6) meat and eggs and moderate consumption foods: (7) oils, fats and seeds and (8) sugars and sweets. The group of nonrecommended foods was added consisting of: (9) sugared drinks, (10) high-energy snacks and (11) sausages. These latter foods are present in the diet of the Brazilian population, although without recommendation of maximum intake. Table 1 shows the technical aspects for calculating the DQIA-BR-A.
Table 1. Overview of the calculation diet quality index for adolescents for Brazilians adapted (DQIA-BR-a)

Adapted Vyncke et al., 2013.
Once the food groups were adapted, the basic principles were also adjusted. The first component is dietary quality, which considers whether the adolescent made appropriate choices in relation to the foods consumed, depending on the prevalence of consumption of recommended foods, moderate consumption foods and nonrecommended foods. All foods were multiplied by the factor ‘1’ for the group of recommended foods; ‘0’ for the group of moderate consumption foods and ‘–1’ for the group of nonrecommended foods.
The second component is dietary diversity, which assesses the consumption of foods from different groups in the usual diet. This calculation includes only the groups of recommended foods and moderate consumption foods. The value ‘1’ was assigned when at least a portion of each food from the groups was consumed. The value ‘0’ was assigned when there was no consumption of food from the groups or if consumption was less than one portion.
The third component is dietary equilibrium, which consists of the subcomponents defined as dietary adequacy or excess. Both consider whether the intake is in accordance with the recommended amount for each group of foods that have daily intake recommendation. Therefore, non-recommended foods were excluded from this component for not having an intake recommendation. Thus, diet balance is calculated by the difference between dietary adequacy and dietary excess.
Ethical considerations
The study was approved by the Research Ethics Committee of the Hospital Universitário Lauro Wanderley of the Federal University of Paraíba (CAAE: 6527·0·000·126–10). The procedures meet the ethical standards of the committee for research on human beings.
The adolescents and their guardians were previously informed about the research objectives and the methods to be adopted. Upon the consent of the adolescents, the guardian signed an informed consent form.
The adolescents and their guardians were guaranteed, in addition to data confidentiality, the return of the results of the anthropometric and biochemical evaluations conducted, as well as adequate reference to medical service when necessary. The researchers were available for any clarifications to any questions regarding the procedures, risks, benefits and other research-related questions.
Data analysis algorithm
The data were double entered, and consistency was tested by the validate module using the Epi-Info software, version 6·04b (WHO/CDC). Statistical analyses were performed using the Statistical Package for Social Sciences – SPSS for Windows, version 13.1 (SPSS Inc.).
Continuous variables were tested for normal distribution using the Kolmogorov–Smirnov test. The variables with Gaussian distribution were described as mean and sd, and nongaussian variables were described as median and interquartile range. In the description of proportions, the binomial distribution was approximated to the normal distribution by the 95 % CI.
Unpaired Student t test was used for comparison between two means. For comparison between three or more means one-way ANOVA was used, in addition to the Bonferroni post-hoc test when applicable and when the criteria for homoscedasticity and normal distribution were met.
The multiple linear regression model was used to analyse the relationship of the DQIA-BR-A with food and nutrient intake and metabolic parameters. The model was adjusted for gender, age and physical activity level. The DQIA-BR-A model for food intake was adjusted by sex, age and physical activity according to the univariate analysis (P ≤ 0·20) and total energy intake. Besides the adjustment of the DQIA-BR-A model as well as the metabolic parameters and variables cited above, sexual maturation and waist:height ratio were also included due to the influence of these variables on metabolic parameters. The inclusion of variables in the model followed the criterion of independence between them. For the purpose of interpretation, the type I error limit was up to 5 % (P ≤ 0·05).
Results
A total of 410 adolescents were interviewed, eleven of whom were excluded due to insufficient sample of biological material for laboratory analysis or inconsistent FFQ data and anthropometric measurements. The sample resulted in 399 adolescents, consisting mostly of females and individuals of low social class. Regarding nutritional status and physical activity, there was a prevalence of eutrophic individuals, without abdominal obesity, although sedentary (Table 2).
Table 2. Demographic, economic, anthropometric characteristics, level of physical activity and diet quality index in adolescents, Recife, Northeastern Brazil, 2013
(Numbers and percentages; 95 % confidence intervals; median values and interquartile ranges)

DQIA-BR: Diet Quality Index for Adolescents adapted for Brazilians; IQR, interquartile range.
* Brazilian Criteria for Economic Classification: high (A1 e A2); medium (B1 e B2); low (C1 e C2); Very low (D e E).
† BMI for age Z-scores: underweight (score-Z < −2), normal weight (score-Z ≥ −2 and <+1), overweight (score-Z ≥ +1 and <+2) and obesity (score-Z ≥ +2).
Abdominal obesity:
‡ Waist circumference (≥ 80th percentile).
§ Waist:height ratio (≥ 0·5).
|| Insufficiently active/sedentary (<300 min/week) and sufficiently active (≥ 300 min/week).
Table 3 shows the distributions of the DQIA-BR-A scores. The food groups with adequate intake according to recommendations were meat and eggs, beans and sugars and sweets. All other groups had a lower than recommended intake. Regarding the item that evaluates excessive intake, only the group of sugars and sweets obtained the maximum score. It is noteworthy that the food groups of sugary drinks, high-energy snacks and sausages do not have a recommendation for maximum intake according to the Brazilian food pyramid and, therefore, do not present data related to adequate and excessive intake.
Table 3. Scores of the diet quality index for adolescents for the Brazilians adapted (DQIA-BR-a), according to the food groups. Recife, Northeastern Brazil, 2013
(Mean values and standard deviations; median values and interquarticle ranges)
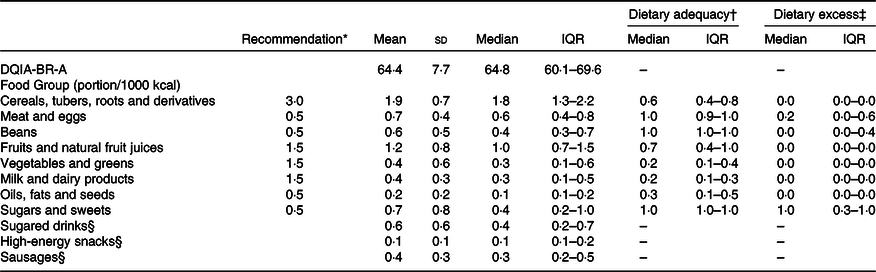
Med, median; IQR, interquartile range.
* Recommendation of portion/1000 kcal according of the Brazilian food pyramid (PHILIPPI et al., 1999).
† Dietary adequacy = actual intake food group/recommended food group.
‡ Dietary excess = (actual intake food group – recommendation food group)/recommendation food group.
§ Dietary Adequacy and excess were not calculated because in the Brazilian food pyramid it does not have the maximum recommended intake limit.
Table 4 shows the comparison of means of the DQIA-BR-A and its components according to the characteristics of the adolescents. Male adolescents and sufficiently active (≥ 300 min/week) adolescents showed higher DQIA-BR-A values in comparison with female adolescents and those classified as inactive or little active (<300 min/week). Regarding DQIA-BR-A components, dietary diversity did not differ between characteristics in the sample profiles; in contrast, dietary quality significantly differed in stratification according to gender and physical activity. Dietary equilibrium differed only as a function of abdominal obesity, assessed by the waist:height ratio.
Table 4. Diet quality index for adolescents for the Brazilians adapted (DQIA-BR-a) and different components according to socio-demographic, anthropometric and physical activity variables. Recife, Northeastern Brazil, 2013

* Student’s t test for unpaired samples.
† ANOVA.
‡ Brazilian Criteria for Economic Classification: high (A1 e A2); medium (B1 e B2); low (C1 e C2); very low (D e E).
§ Waist circumference ≥ 80th percentile.
|| Waist:height ratio ≥ 0·5.
¶ BMI for age Z-scores: underweight (score-Z < −2), normal weight (score-Z ≥ −2 and <+1), overweight (score-Z ≥ +1 and <+2) and obesity (score-Z ≥ +2).
** Insufficiently active/sedentary (<300 min/week) and sufficiently active (≥ 300 min/week).
Table 5 shows the multiple linear regression analysis of the DQIA-BR-A with the daily intake of nutrients and food. The results show a weak positive relationship with the intake of linoleic fatty acid (β = 0·51), Ca (β = 0·38) and folate (β = 0·47). On the other hand, there was a strong negative relationship with the intake of carbohydrate (β = −1·39), vitamin B2 (β = −1·14), oleic fatty acid (β = −0·76) and moderate with vitamin C (β = −0·33).
Table 5. Associations between diet quality index for adolescents for the Brazilians adapted (DQIA-BR-a) score, usual intake of nutrients and food intake. Recife, Northeastern Brazil, 2013
(Coefficient values and 95 % confidence intervals)
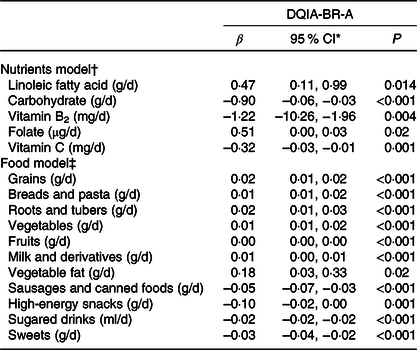
* 95 % CI of B.
† Multilevel regression analyses with inclusion of a random intercept for centre and corrected for sex, age, physical activity and total energies intake (R 2 adjust = 0·29 and P < 0·001).
‡ Multilevel regression analyses with inclusion of a random intercept for centre and corrected for sex, age, physical activity and total energies intake (R 2 adjust = 0·62 and P < 0·001).
The analysis between the DQIA-BR-A and food intake showed a weak positive relationship with the consumption of grains, breads and pasta, roots and tubers, vegetables, fruits, milk and derivatives and vegetable fat. However, there was a weak negative relationship with the consumption of sausages and canned foods, high-energy snacks, sugared drinks and sweets.
The multiple linear regression analysis between DQIA-BR-A and metabolic parameters showed no statistically significant relationship (Table 6).
Table 6. Association between diet quality index for adolescents for the Brazilians adapted (DQIA-BR-a) score and nutritional biomarkers, according to sex. Recife, Northeastern Brazil, 2013
(Coefficient values and 95 % confidence intervals)

R 2 ajust < 0·07 and P > 0·05.
* 95 % CI of B.
† Multilevel regression analyses with inclusion of a random intercept for centre and corrected for age, physical activity, waist:height ratio, sexual maturation stage and total energies intake
Discussion
Diet quality indexes are tools to obtain a global assessment of the quality of individual and population diet(Reference Vyncke, Fernandez and Pascual2). In Brazil, studies addressing the diet quality index in adolescents used the version of the Health Eating Index adapted by Fisberg et al. (Reference Castilhos, Schneider and Muniz30–Reference Wendpap, Ferreira and Rodrigues33). More recently, the ERICA study used the index validated by Vyncke et al. (Reference Vyncke, Fernandez and Pascual2), but without adaptation according to the recommendations of the food pyramid for the Brazilian population(Reference Ronca, Blume and Cureau5).
The average DQIA-BR-A score observed in our series was similar to that reported in other studies addressing adolescents and using different indexes that ranged from 58·4 to 75·1(Reference Assumpção, Barros and Fisberg31–Reference Andrade, Barros and Carandina34). On the other hand, in comparison with the results of the ERICA study, the values differ significantly. The latter study reported values of 17·6 and 14·3 for male and female adolescents, respectively, within the northeast region of Brazil(Reference Ronca, Blume and Cureau5). A possible explanation for this difference is the fact that, in ERICA, the DQI calculation was not adapted to the recommendations of the food pyramid for the Brazilian population, thus following the food intake recommendations of the European food guide. In this sense, for example, for the item meat and eggs, the daily recommendation of the European guide is 75 to 100 g. For the Brazilian pyramid, the daily recommendation of this item is 0·5 portion, which equals, for example, 50 g of grilled chicken, thus being below the European recommendation.
In any case, improvements are needed to enhance the quality of the adolescents’ diet, such as an increase in the consumption of vegetables, milk and dairy, oils, fats and seeds, prioritising foods rich in essential fatty acids and poor in saturated fats, along with a reduction in the consumption of sugar and sweets, which had a maximum excessive intake score.
When comparing the DQIA-BR-A with physical activity, sufficiently active adolescents showed higher scores. These findings are similar to the results described by De Andrade et al. (Reference Andrade, Barros and Carandina34), who found values of 58·4 and 60·3 for adolescents categorised as inactive and active (P = 0·025), respectively. Although Vyncke et al. (Reference Vyncke, Fernandez and Pascual2) did not observe a DQIA difference for physical activity level, active individuals are known to be more concerned with a balanced diet and tend to present a better quality diet than inactive individuals.
The association between the diet balance component and abdominal obesity may be explained by reverse causality, which is a common occurrence in cross-sectional studies; adolescents with abdominal obesity may present a tendency to diminish the excessive consumption of foods in an effort to lower their body weight, thereby exerting a favourable impact on the diet balance component.
The relationship between the DQIA-BR-A and the daily consumption of macro- and micronutrients showed that most nutrients did not show statistically significant associations. Moreover, the model had a low explanatory power. In contrast, Vyncke et al. (Reference Vyncke, Fernandez and Pascual2) found strong associations between the DQIA and energy intake as well as the majority of micronutrients, with the exception of Fe, Cu, niacin, vitamin C and vitamin E; for macronutrients, however, the association was only positive for the consumption of carbohydrates. This can be explained by the characteristics of the DQIA-BR-A since this tool is intended to assess overall diet quality and not the relationship with isolated nutrient intake.
The relationship between the DQIA-BR-A and the intake of oleic fatty acid, linoleic fatty acid, carbohydrates, Ca, vitamin B3, folate and vitamin C, despite being statistically significant, shows regression coefficients with values near the unit and, therefore, a very restricted influence on DQIA-BR-A values.
The relationship between fat consumption and the DQIA-BR-A varied according to the type of fat, although the calculation of the DQIA-BR-A showed no distinction between types of fat. Moreover, the group of oils, fat and oilseeds was considered to be of moderate consumption, i.e. a neutral factor. It should be pointed out that linoleic acid (LA) is an n-6 fatty acid and the main PUFA found in Western diets, which are rich in vegetable oils and seeds, as well as products derived from vegetable oils, such as margarine. LA can be metabolised into gamma-LA, dihomo-γ-LA and arachidonic acid (ARA), which are relatively rare in diets(Reference Innesa and Calder35).
ARA is the main PUFA found in cell membranes and seems to be involved in inflammation in humans(Reference Innesa and Calder35). In a systematic review of thirty-six randomised clinical trials to analyse the effect of the dietary intake of LA in the composition of fatty acids in tissues of individuals who presented the Western eating pattern, Rett and Welland(Reference Rett and Whelan36) found that, although LA serves as substrate for the synthesis of ARA, neither an increase nor a reduction in LA intake affected serum/plasma concentrations of ARA. This finding may be explained by the saturation relation of the metabolic pathway of ARA synthesis(Reference Innesa and Calder35).
It is plausible to suppose that LA serves a pro-inflammatory function, as it can be metabolised by lipoxygenases in derivates denominated hydroxyoctadecadienoic acids, which play roles in the inflammatory process(Reference Innesa and Calder35). However, a systematic review of fifteen randomised clinical trials involving healthy adults found no evidence of an association between the dietary intake of LA and inflammatory markers, such as cytokines IL-6, TNF-α and C-reactive protein), fibrinogen, plasminogen activator inhibitor-1 and soluble vascular cell adhesion molecules(Reference Johnson and Fritsche37).
Likewise, an epidemiological study conducted with 1123 Italians also found no association between plasma concentrations of LA and inflammatory markers (IL-6, soluble IL-6 receptor, IL-1β, IL-1 receptor antagonist, TNF-α, IL-10, transforming growth factor-β and C-reactive protein). Moreover, individuals in the lowest quartile of the plasma concentrations of n-3 and six PUFA had higher concentrations of IL-6 and C-reactive protein (pro-inflammatory) and lower concentrations of IL-10 and transforming growth factor-β (anti-inflammatory)(Reference Ferrucci, Cherubini and Bandinelli38).
The tenuous direct relationship between folate consumption and the DQIA-BR-A may stem from folate being present both in the groups of fruits, natural juices and vegetables and in wheat- and corn-flour-based products. Its presence in these products is part of the programme for the fortification of wheat and corn flours, implemented in Brazil in 2004, as has already been the case in the USA and Canada since 1996–1998, with the cereal-grain fortification program(Reference Selhub and Paul39). This information is of particular relevance since the Chemical Composition Table of the USA Department of Agriculture (USDA, 2011) shows that the amount of folate estimated by the American table is similar to that estimated for Brazilian foods. In this sense, all of these groups have a positive factor for calculating the DQIA-BR-A.
The negative relationship between carbohydrate consumption and the DQIA-BR-A may be due to the presence of different types of carbohydrates and food groups that can present neutral, positive and negative factors, with prevalence of the negative weight of high-energy snacks and sugary drinks.
Regarding the unexpected inverse relationship between the DQIA-BR-A and vitamins B2 and C, a possible explanation could be that these nutrients are added to many industrialised products such as cookies, snacks, sausages and frozen foods, which make up the group of nonrecommended foods.
Regarding food intake, the DQIA-BR-A score correlated positively and negatively with most foods. Despite the low values evidenced by the regression coefficients, the score had satisfactory explanatory power of the analytical model, which indicates that the isolated consumption of a food item has a small effect on the quality of the diet, whereas the assessment of the combination of foods according to food groups enables a global understanding of the quality of the diet. Foods such as grains, breads and pasta; roots and tubers; vegetables and fruits and milk and dairy products correlated positively with the score according to the conceptual model expected. These foods contribute with the positive factor for the calculation of the index. Consumption of animal fat, in turn, was not significant; on the other hand, consumption of vegetables showed a positive relationship. Adequate fat intake is of paramount importance during adolescence, since this age group has an increased need for this nutrient for adequate development. In addition to representing an important energy source, lipids play a key structural role in all tissues and are essential for cells and for the synthesis of some hormones and plasma membranes. The brain, retina and other neural tissues are particularly rich in PUFA, which are present in vegetable fats(Reference Uauy, Mize and Castillo-Duran40).
The negative relationship observed between the DQIA-BR-A and sausages, high-energy snacks, sugary drinks and sweets was an expected result since for the calculation of the index these foods received the negative factor, making up the group of nonrecommended foods. Noteworthy, the food guide for the Brazilian population, unlike the Flemish Food-Based Dietary Guidelines, does not display the limit of intake of foods that make up the group of nonrecommended foods. Consequently, in the present adaptation, these foods were evaluated only for the diet quality component.
Finally, the present study showed no association between the DQIA-BR-A and biochemical markers. The study by Vyncke et al. (Reference Vyncke, Fernandez and Pascual2) showed a relationship between DQIA and the levels of vitamin D, holo-transcyanocobalamin and n-3 fatty acids. In turn, DQIA did not correlate with the other markers (vitamin C, folate, beta-carotene, retinol, TAG and trans-fatty acids). A possible explanation is that this relationship would be conditioned by intake time and duration. In other words, biomarkers that represent a long-term intake (vitamin D and holo-transcobalamin) tend to show a degree of dependence, whereas biomarkers that represent short- and medium-term food intake would likely not show this degree of association. On the other hand, Kabagambe et al. (Reference Kabagambe, Baylin and Allan41), in their study relating methods of assessing food intake and biomarkers, concluded that both the assessment of food intake and the assessment of biomarkers are not good indicators for analysing the actual nutrient intake. Moreover, not all nutrients have proper definition of the biological marker, and many factors other than food intake can modify these biomarkers.
Based on the findings described herein, the DQIA-BR-A can be considered a good method for evaluating the consumption of foods and nutrients that have recognised importance in the prevention and control of cardiometabolic diseases in both this phase of the life cycle and adulthood. Moreover, a detailed analysis of the DQIA-BR-A and its components enables the identification of points of inadequacy with regard to the diversity, quality and/or balance of the diet and its association with possible adverse health conditions. Such an analysis can contribute to the establishment of guidelines and intervention strategies aimed at improving the diet of adolescents, thereby assisting in the prevention of negative health outcomes in the population.
However, the use of the DQIA-BR-A may have limitations related to the practicality of its application due to the need for a well-trained professional and the time required to analyse its results. Another point to consider is the non-differentiation of the types of oils and fats, as the literature emphasises the importance of the quality of lipids consumed and the association with cardiovascular risk/protection. Moreover, as a tool that uses the recommendations of the Dietary Guide, these recommendations can become out of date as the science of nutrition evolves pari passu with changes related to the health conditions of the population, requiring updating that accompanies advances in science and the advent of new guidelines.
Conclusion
The DQIA-BR-A can be considered a measure for the global assessment of the dietary quality of adolescents. It is therefore a potential instrument for application in nutritional epidemiology and suitable for the description and monitoring of the dietary quality of the population.
Acknowledgements
This study was funded by National Research Council (CNPq) (Process No. 473387/2010–7) and Ministry of Science and Technology (Contract IMIP/MCT Process No. 01·0265·00/2005).
M. T. O. T., I. K. G. A. and A. S. D. designed the study and analysed and interpreted the data; M. T. O. T., A. S. D. and P. C. C. drafted the manuscript; all authors substantially revised the manuscript; all authors approved the final manuscript.
There are no conflicts of interest.


