


The prevalence of type 2 diabetes (T2D) is rising at an alarming rate worldwide(1). Several studies have reported that certain ethnic groups in Europe are more susceptible to develop T2D(Reference Gujral, Pradeepa and Weber2,Reference Testa, Bonfigli and Genovese3) . The prevalence of T2D is two to five times higher among ethnic minorities compared to the European host population(Reference Gujral, Pradeepa and Weber2,Reference Meeks, Freitas-Da-Silva and Adeyemo4,Reference Snijder, Agyemang and Peters5) , and some groups develop the disease at a younger age(Reference Snijder, Agyemang and Peters5). The underlying reasons behind these differences have not been fully elucidated.
Nutrition is an important modifiable risk factor for many chronic diseases(Reference Boeing, Bechthold and Bub6). Several studies have reported an inverse association between a diet rich in fruits and vegetables and T2D(Reference Cooper, Sharp and Lentjes7,Reference Satija, Bhupathiraju and Rimm8) . Fruits and vegetables are the primary source of carotenoids, fat-soluble pigments with known antioxidant and anti-inflammatory activity(Reference Kaulmann and Bohn9). As a result, serum carotenoid concentrations are markers of fruit and vegetable intake(Reference Al-Delaimy, Natarajan and Sun10). In addition, serum carotenoid concentrations are more reliable than self-reported data, which often rely on participants’ memory and might lead to a misclassification of intakes(Reference Natarajan, Flatt and Sun11). Cross-sectional(Reference Coyne, Ibiebele and Baade12,Reference Blondin, Yeung and Mumford13) and prospective studies(Reference Arnlov, Zethelius and Riserus14–Reference Sluijs, Cadier and Beulens17) have reported an inverse association between serum carotenoid concentrations(Reference Coyne, Ibiebele and Baade12–Reference Sugiura, Nakamura and Ogawa16) and dietary carotenoid intake(Reference Cooper, Sharp and Luben15,Reference Sluijs, Cadier and Beulens17) and T2D and diabetic parameters.
Dietary patterns differ across ethnic groups, with fruits and vegetables comprising different percentages of the total energy intake(Reference Dekker, van Dam and Snijder18). Studies in the United States have reported differences in self-reported fruit and vegetable consumption across ethnic groups(Reference Sharma, Sheehy and Kolonel19) and lower adherence to recommended intake in ethnic minorities compared to the Caucasian majority population(Reference Casagrande, Wang and Anderson20). In addition, a meta-analysis showed a different self-reported fruit and vegetable intake across eight countries but no significant association with T2D(Reference Cooper, Sharp and Lentjes7). Other studies evaluating the differences in serum carotenoid concentrations across ethnic groups showed that ethnic minorities have higher concentrations of certain carotenoids compared to Caucasians(Reference Neuhouser, Rock and Eldridge21–Reference Schleicher, Sternberg and Pfeiffer23). In Europe, serum carotenoid concentrations were shown to vary across sixteen European regions(Reference Al-Delaimy, van Kappel and Ferrari24). Further differences in serum carotenoid concentrations have not been studied in adults of other ethnic groups at a high risk of T2D, such as South Asians, nor in minority populations living in Europe. In addition, the relationship between serum carotenoid concentrations, as markers for fruit and vegetable intake, and T2D has not been studied in a multi-ethnic population.
The aim of this study was to investigate whether fruit and vegetable intake, reflected by serum carotenoid concentrations, mediated ethnic differences in the prevalence of T2D across ethnic groups. First, we examined the ethnic differences in serum carotenoid concentrations and their association with T2D in a multi-ethnic population consisting of Dutch, South Asian Surinamese, African Surinamese, Turkish and Moroccan-origin groups living in Amsterdam, the Netherlands. Then, we examined whether the differences in serum carotenoid concentrations observed across the groups mediated ethnic differences in the prevalence of T2D.
Methods
Study population
For the present analysis, baseline data from the Healthy Life in an Urban Setting (HELIUS) study collected between 2011 and 2015 were used. This study is described in detail elsewhere(Reference Snijder, Agyemang and Peters5,Reference Snijder, Galenkamp and Prins25) . HELIUS is a prospective cohort study that aims to investigate the underlying causes of the impact of ethnicity on the risk of communicable and non-communicable diseases among the largest ethnic groups living in Amsterdam, the Netherlands. Baseline data collection took place in 2011–15 and included people aged 18–70 years from Dutch, Surinamese, Ghanaian, Moroccan and Turkish origin. Nearly 25 000 participants were recruited into the study via random sampling, stratified by ethnic origin, through the municipality registry of Amsterdam. Baseline measurements included the collection of biological samples, a physical examination and a series of questionnaires on sociodemographic and lifestyle factors.
A total of 5358 HELIUS participants of Dutch, South Asian Surinamese, African Surinamese, Turkish and Moroccan origin also completed an additional FFQ(Reference Dekker, Snijder and Beukers26). Serum carotenoid concentrations were measured in a subsample of approximately 200 participants per ethnic group, of whom half were men. In the present analysis, participants with incomplete biomarker data (n 34) were excluded. After exclusion, the population for analysis consisted of 1014 participants, of whom 204 were Dutch, 203 South Asian Surinamese, 204 African Surinamese, 203 Turkish and 200 Moroccan.
Measurements
Ethnicity was defined based on the country of birth of the participants and of their parents. Non-Dutch ethnic origin was assigned to the participants born abroad with at least one parent born abroad (first generation), or to participants born in the Netherlands with both parents born abroad (second generation). The Dutch subgroup included participants born in the Netherlands and whose parents were also born in the Netherlands. After data collection, participants of Surinamese ethnic origin were further classified according to self-reported ethnic origin (obtained by questionnaire) into ‘African’ or ‘South Asian’ or ‘other’.
Education was used as a proxy for socioeconomic status. Education was classified into three categories, depending on the highest educational degree obtained, either in the Netherlands or in the participants’ country of origin. ‘Low education’ was defined as no school, elementary schooling only, lower vocational schooling or lower secondary schooling. ‘Middle education’ was defined as intermediate vocational schooling or higher secondary schooling. Finally, ‘high education’ included higher vocational schooling or university. Smoking status was characterised as current, former or no smoking. Habitual physical activity was measured using the validated Short Questionnaire to Assess Health-Enhancing Physical Activity (SQUASH)(Reference Wendel-Vos, Schuit and Saris27). Participants were categorised as compliant to the Dutch physical activity norm (yes/no), which means that they were active at least 5 d/week for a minimum of 30 min at moderate to high intensity(Reference Wendel-Vos, Schuit and Saris27). Average alcohol intake was measured based on two questions: ‘Did you use alcohol in the past 12 months?’ (yes/no) and ‘When you are drinking, how many drinks do you have on a typical day?’ Based on the responses, the participants were then divided into four groups: abstinent (no alcohol consumption), low consumption (1–2 glasses), moderate consumption (3–4 glasses) and high consumption (≥5 glasses). Anthropometric measurements were taken by trained research nurses and included measures of height, body weight, hip circumference and waist circumference. These were measured in duplicate, and the mean of two measurements was used in the analysis. BMI was determined by dividing measured body weight (kg) by height-squared (m2). In addition, waist-to-hip ratio (WHR) was calculated as waist circumference divided by hip circumference. Total energy was derived from the ethnicity-specific FFQ(Reference Beukers, Dekker and de Boer28). This variable was divided into tertiles of intake (low, middle and high) based on the distribution within our study population. Season was calculated based on the date of physical examination and was divided into four categories according to the Northern Hemisphere seasonal calendar: winter (21 December–20 March), spring (21 March–20 June), summer (21 June–20 September) and fall (21 September–20 December).
Fasting venous samples were collected and serum concentrations of individual carotenoids (α-carotene, β-carotene, β-cryptoxanthin, lutein, lycopene and zeaxanthin) were measured as µmol/l in plasma, which had been stored at −20°C until measurement. Serum carotenoids were analysed at the Division of Human Nutrition, Wageningen University, by HPLC (Thermo Scientific Accela LC system; Thermo Fisher Scientific Inc.) with EZChrom Elite version 3.2.2 SP2 software from Agilent Technologies. To 500 µl of serum, 500 µl sodium chloride (0·9, w/v% in water) and 1000 µl ethanol (containing retinyl acetate as an internal standard) were added and mixed. Next, the mixture was extracted twice with 3·0 ml hexane. The hexane layers were pooled and evaporated to dryness under N2 at 35 °C. The residue was dissolved in a 250-µl mixture of methanol and butanol (60/40, v/v %), and 15 µl was injected for HPLC analysis. Separations of lutein, zeaxanthin, cryptoxanthin, α-carotene, β-carotene and lycopene were performed on a Vydac 201TP52 RP-column using gradient elution and monitored at 450 nm on a PDA detector. Runtime was 25 min per sample. All sample preparations were done under subdued yellow light. The ‘total carotenoids’ variable was calculated as the sum of all individual carotenoids. Total cholesterol in mmol/l was determined by enzymatic colorimetric spectrophotometry (Roche Diagnostics).
HbA1c concentrations were determined by HPLC (TOSOH) in whole blood, and fasting plasma glucose (FPG) concentrations were determined by spectrophotometry using hexokinase as the primary enzyme (Roche Diagnostics). The use of glucose-lowering medication was documented during physical examination, to appear for which the participants were asked to bring their prescribed medications. T2D was considered to be present if the participant had FPG levels ≥7·0 mmol/l, fasting HbA1c levels ≥6·5 % (48·0 mmol/mol), was using a glucose-lowering medication or was previously diagnosed with T2D by a healthcare professional(1).
Statistical analyses
Baseline characteristics were shown across ethnic groups as means and standard deviations for normally distributed variables; median and interquartile ranges (25th percentile, 75th percentile) for skewed variables; and by number of observations and percentages for categorical variables.
The concentrations of carotenoids were log10-transformed prior to the analysis, except for lycopene, which showed a normal distribution. Age-adjusted means or geometric means of serum carotenoid concentrations per ethnic group were calculated using ANCOVA. During additional analyses, we adjusted for total cholesterol and season of blood collection as they might cause differences in serum levels(Reference Beydoun, Shroff and Chen29,Reference Olmedilla, Granado and Blanco30) . Furthermore, we verified the consistency of patterns in the ethnic differences between men and women separately.
The association between serum carotenoid concentration and T2D was studied using multivariate Cox regression with a constant time at risk of 1 year for all participants to estimate the prevalence ratios (PR) and their 95 % CI. Cox regression was used as estimates may be better than traditionally used logistic regression if the initial risk would be high, such as in the case of T2D(Reference Coutinho, Scazufca and Menezes31). Linearity of the association between serum carotenoid concentration and T2D was checked by adding the independent variable as quartile group in the model. Because no evidence was found for a non-linear association (data not shown), the models were fitted per 1 sd increase in serum carotenoid concentration. Confounders were chosen based on known associations with T2D. We first adjusted for age, sex and ethnicity (model 1). In model 2, we further adjusted for education, smoking status, average alcohol intake and physical activity. Model 3 additionally included BMI. The last model, model 4, was additionally adjusted for average energy intake.
Based on previous studies establishing an association in men(Reference Arnlov, Zethelius and Riserus14) but not in women(Reference Blondin, Yeung and Mumford13), we tested possible differences in the association between men and women with a multiplicative interaction term (sex × serum carotenoid) to models 3 and 4. As no evidence for interaction by sex was observed, we did not stratify our main analyses by sex. However, for confirmation, we show the consistency of associations by sex. In addition, we investigated whether the associations differed by ethnic group by adding interaction terms (ethnicity × serum carotenoid) to models 3 and 4. We had planned sensitivity analyses using only newly diagnosed T2D cases (participants diagnosed during baseline measurements but not before), but refrained from proceeding due to the low number of newly diagnosed cases (n 36).
Finally, a Cox regression analysis was used to estimate the PR (CI) reflective of the ethnic differences in T2D. The model referred to as ‘full model’ was adjusted for known risk factors for T2D, which were also used in our previous analysis (age, sex, education, smoking status, alcohol intake, physical activity, BMI and average energy intake). The Dutch population was used as the reference group given that it is the majority population in the Netherlands. The models were additionally adjusted for serum carotenoid concentration to examine whether serum carotenoids mediated ethnic differences in T2D prevalence.
All statistical analyses were performed using the statistical software IBM SPSS Statistics, version 24. A P-value <0·05 was considered statistically significant.
Results
A total of 494 (48·7 %) participants in the study were men, and the population had a mean age of 45·40 (sd 12·28) years. Moroccan and Turkish groups had a lower mean age than other ethnic groups (Table 1). The Dutch population tended to be most highly educated. Alcohol intake was greater in the Dutch population compared to other groups who tended to show more abstinence. The number of current smokers was highest among the African Surinamese group, and lowest among the Moroccans. The Dutch group had the lowest BMI and WHR, whereas the Turkish participants had the highest BMI and the South Asian Surinamese had the highest WHR. Finally, the Dutch had the lowest (4·9 %) and the South Asian Surinamese the highest (23·6 %) prevalence of T2D.
Table 1 General characteristics of the study sample across ethnic groups*
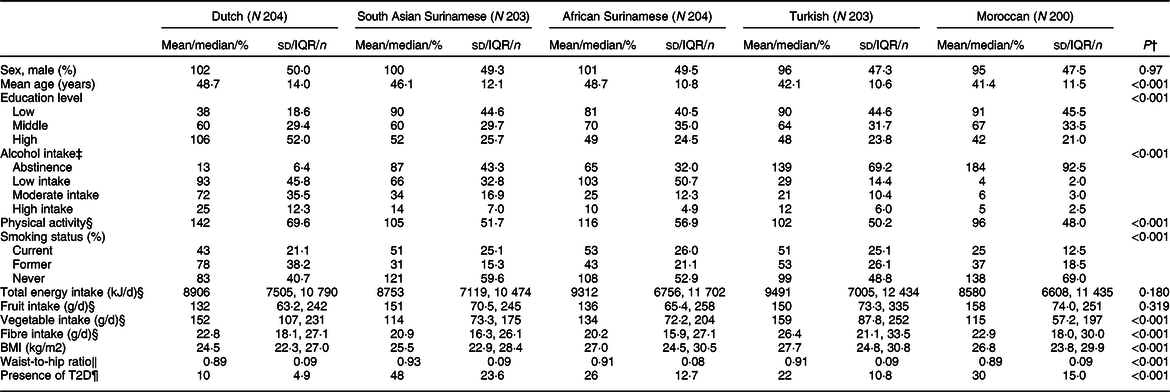
* Data shown as mean (sd) for normally distributed variables; median (Q1, Q3) for skewed variables; and number of observations (percentage) for categorical variables. Missing variables: education (n 6), alcohol intake (n 6), energy intake (n 2), fruit intake (n 2), vegetable intake (n 2), fibre intake (n 2).
† Calculated with ANOVA for normally distributed variables; Kruskal–Wallis test for skewed variable; and χ2 test for categorical variable.
‡ Based on average alcoholic drinks per day over the past 12 months (abstinence, low intake, moderate intake, high intake).
§ Calculated as adherence to the Dutch Healthy Physical Activity Guideline (yes/no).
‖ Calculated using ethnicity-specific FFQ.
¶ Characterised by fasting plasma glucose ≥7·0 mmol/l, plasma HbA1c ≥6·5 % (48·0 mmol/mol), previous T2D diagnosis by a healthcare professional or use of a glucose-lowering medication.
A significant difference in the age-adjusted concentration of all serum carotenoids was found across ethnic groups (Table 2). The Turkish participants had the highest serum concentration of total carotenoids (2·37 µmol/l), β-cryptoxanthin (0·34 µmol/l) and lycopene (0·86 µmol/l). The Dutch group had the highest concentration of serum β-carotene (0·67 µmol/l), lutein (0·33 µmol/l) and zeaxanthin (0·08 µmol/l). In addition, the Moroccan participants had the highest α-carotene concentration (0·12 µmol/l). The lowest concentrations of serum carotenoids were mainly found in the South Asian Surinamese and Moroccan groups. The observed patterns were consistent for men and women (online Supplementary material 1).
Table 2 Age-adjusted serum carotenoid concentrations (µmol/l) across ethnic groups
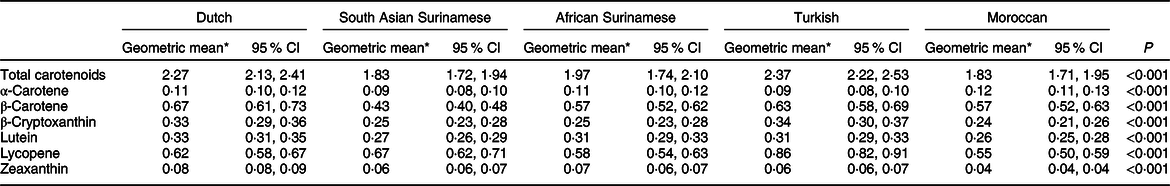
* Estimated geometric mean of log10-transformed serum carotenoid concentrations by age: 45·40 obtained using ANCOVA.
An association of fruit and vegetable intake, estimated by serum carotenoids, with T2D was found (Table 3). There was a significant inverse association between the serum concentrations of total carotenoids (PR 0·67, 95 % CI 0·54, 0·84), α-carotene (PR 0·57, 95 % CI 0·42, 0·77), β-carotene (PR 0·45, 95 % CI 0·32, 0·63) and β-cryptoxanthin (PR 0·73, 95 % CI 0·58, 0·92) and T2D in the fully adjusted model (model 3). These associations did not change after additionally adjusting for energy intake (model 4). On the other hand, no significant association was found between lutein, lycopene and zeaxanthin concentrations and T2D. These associations did not significantly change after additionally adjusting for total cholesterol and season of blood collection (online Supplementary material 2). During additional analyses, little evidence for interaction by sex or ethnicity was observed (online Supplementary materials 3 and 4).
Table 3 Association of serum carotenoid concentrations with T2D
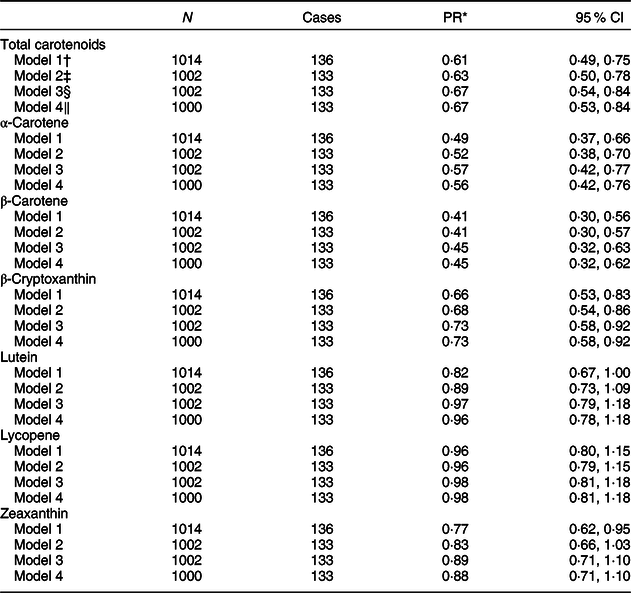
* PR (prevalence ratio) estimated using a multivariate Cox regression with a constant time at risk of 1 year, reported per 1 sd increase in the concentration of serum carotenoids.
† Model 1: adjusted for age, sex and ethnicity.
‡ Model 2: model 1 additionally adjusted for highest education achieved (low, middle, high), smoking status (current, former, never), alcohol intake (abstinence, low intake, moderate intake, high intake) and physical activity (adherence to the Dutch Healthy Physical Activity Guideline or not).
§ Model 3: model 1 additionally adjusted for BMI (kg/m2).
‖ Model 4: model 3 additionally adjusted for average energy intake (kJ/d; low, moderate and high).
Finally, differences in carotenoid concentrations did not mediate ethnic differences in T2D prevalence in our population (Table 4). After adjusting for the potential confounders, a clear difference in T2D prevalence across ethnic groups was seen. However, an additional adjustment in serum concentrations for any of the carotenoids did not lower the PR for different ethnic groups when compared to the Dutch group. For instance, the PR for the South Asian Surinamese participants compared with the Dutch group changed from 4·85 (95 % CI 2·32, 10·13) in the fully adjusted model to 4·86 (95 % CI 2·33, 10·10) after an additional adjustment for total carotenoid concentrations. For other carotenoids, such as α-carotene, the PR increased, for example, from 4·85 (95 % CI 2·32, 10·13) to 5·18 (95 % CI 2·47, 10·86). Similar trends were seen across other ethnic groups and in men and women separately (online Supplementary material 5).
Table 4 Ethnic differences in T2D adjusting for known risk factors and serum carotenoid concentrations
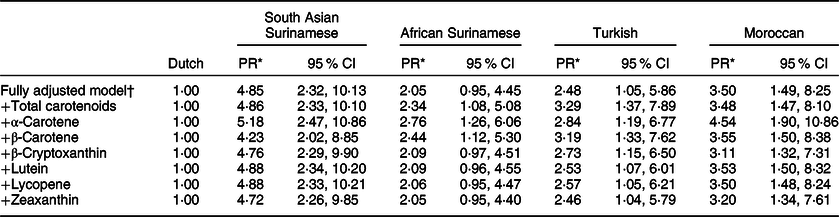
* PR (prevalence ratio) calculated using a multivariate Cox regression analysis with a constant time at risk of 1 year, reported per 1 sd increase in serum carotenoid concentrations.
† Adjusted for age, sex, highest education achieved (low, middle, high), smoking status (current, former, never), alcohol intake (abstinence, low intake, moderate intake, high intake), physical activity (adherence to the Dutch Healthy Physical Activity Guideline or not), BMI (kg/m2) and average energy intake (kJ/d; low, moderate and high).
Discussion
We found that serum carotenoid concentrations differed across ethnic groups. In addition, significant inverse associations of serum concentrations of total carotenoids, α-carotene, β-carotene and β-cryptoxanthin with T2D were found, which did not differ by sex or ethnicity. Despite the differences in serum concentrations identified across ethnic groups, and the association with T2D, these did not mediate ethnic differences in the prevalence of T2D.
In our study, the highest serum carotenoid concentrations were found predominantly in the Dutch and Turkish subgroups. The Turkish group reported consuming a Mediterranean diet rich in fruits and vegetables(Reference Martinez-Gonzalez, Salas-Salvado and Estruch32), which is in line with the high concentrations of serum carotenoids detected. The observed values for total carotenoids in the Dutch group fell within the range observed in a previous validation study in the Netherlands(Reference van Lee, Feskens and Hooft van Huysduynen33). Nevertheless, it is important to note that, despite these favourable levels as compared to other groups, the Dutch population has reported the lowest consumption of total fruits and vegetables in Europe(Reference Agudo, Slimani and Ocke34).
The observed ethnic differences confirm previous self-reported differences in fruit and vegetable intakes across different ethnic groups(Reference Sharma, Sheehy and Kolonel19,Reference Casagrande, Wang and Anderson20) and in the population under study(Reference Beukers, Dekker and de Boer28). Previous studies performed in the United States have included comparisons with ethnic groups such as Hispanics and African Americans(Reference Neuhouser, Rock and Eldridge21–Reference Schleicher, Sternberg and Pfeiffer23). In those studies, higher concentrations of certain carotenoids, such as β-cryptoxanthin, lutein and zeaxanthin, were found in African Americans compared to the majority population. In our study, African Surinamese participants had lower carotenoid concentrations than the Dutch population. Differences across studies could be explained by the diverse consumption patterns of the majority population used as reference group. A study comparing French and American populations showed that the French consumed fruits and vegetables more often than adults in the United States(Reference Tamers, Agurs-Collins and Dodd35). Furthermore, the serum carotenoid concentrations of the Dutch population in our study were higher than those reported in another study in the United States using non-Hispanic whites as the majority population(Reference Kant and Graubard22). Additionally, not all carotenoids equally reflect fruit and vegetable intake. For example, studies have shown that β-cryptoxanthin could be a better indicator of fruit intake, especially citrus fruit, whereas lutein is a good indicator of total vegetable intake, particularly leafy greens(Reference Jansen, Van Kappel and Ocke36,Reference Al-Delaimy, Slimani and Ferrari37) . The observed patterns may be a result of either distinct dietary patterns across comparison groups or differences in research methodology used.
Our findings on the association of several carotenoids with T2D are in line with studies describing an association between diets rich in fruits and vegetables (both self-reported and measured carotenoid concentrations) and T2D(Reference Cooper, Sharp and Lentjes7,Reference Satija, Bhupathiraju and Rimm8,Reference Coyne, Ibiebele and Baade12,Reference Blondin, Yeung and Mumford13,Reference Sugiura, Nakamura and Ogawa16) as well as the metabolic syndrome, a condition associated with a higher risk of developing T2D. For instance, higher serum concentrations of α-carotene(Reference Coyne, Ibiebele and Baade12), β-carotene(Reference Coyne, Ibiebele and Baade12) and β-cryptoxanthin(Reference Blondin, Yeung and Mumford13) were shown to be associated with lower blood glucose levels, corroborating the association with T2D we report in this study. Moreover, a study among Australian adults showed a linear decrease in glucose tolerance abnormality with increasing quintiles of serum concentrations of all carotenoids, except lycopene(Reference Coyne, Ibiebele and Baade12). In contrast to the latter study, we did not find a significant association with lutein or zeaxanthin, although the stratified analyses suggested a non-significant protective association in women. Our results are also in accordance with a recent prospective Japanese cohort where higher α- and β-carotene serum concentrations were significantly associated with a lower risk of T2D(Reference Sugiura, Nakamura and Ogawa16). There are several mechanisms by which diets rich in fruits and vegetables may be associated with T2D risk. A direct role of carotenoids, the biomarker of fruit and vegetable intake in our study, has been suggested. The pathology of T2D and its intermediates such as insulin resistance has been associated with low-grade inflammation and increased oxidative stress(Reference Wang and Hai38,Reference Calabrese, Cornelius and Leso39) . Carotenoids are powerful antioxidant and anti-inflammatory agents that quench free radicals, reduce oxidative stress and decrease the production of inflammatory cytokines(Reference Kaulmann and Bohn9,Reference Bohm, Edge and Truscott40) .
Interestingly, our results showed an inverse association between serum concentrations of provitamin A carotenoids (α-carotene, β-carotene and β-cryptoxanthin) and T2D, but no association with non-provitamin A carotenoids (lutein, lycopene and zeaxanthin). This suggests that, under the assumption of a causal relation, provitamin A carotenoids are potentially more effective than non-provitamin A carotenoids against T2D. Studies have demonstrated that insulin resistance is associated with an increase in retinol’s transport protein, retinol-binding protein 4 (RBP4), in the serum of both rodents and humans(Reference Manolescu, Sima and Bhat41,Reference Mercader, Granados and Bonet42) . Provitamin A carotenoids are converted into retinol in the liver; their binding with RBP4 might be a possible pathway for their beneficial association with T2D(Reference Amengual, Widjaja-Adhi and Rodriguez-Santiago43,Reference Tang44) .
Nevertheless, experimental studies on the effect of β-carotene supplementation have failed to show a benefit in women at a high risk for CVD(Reference Song, Cook and Albert45) and male smokers(Reference Kataja-Tuomola, Sundell and Mannisto46). Another trial involving a large and healthy population failed to show a significant effect of antioxidant supplementation including β-carotene on FPG(Reference Czernichow, Couthouis and Bertrais47). The lack of effect shown in trials could, for instance, suggest that the beneficial effects of fruit and vegetable intake are mediated through an interaction with other compounds present in them, and not (solely) via carotenoids. A recent meta-analysis has suggested that the impact of fruit and vegetable consumption on the risk of T2D could be the result of an improved dietary profile including higher fibre and lower fat intake, with benefits mainly observed for two to three servings of fruits and vegetables per day(Reference Wu, Zhang and Jiang48). Dietary fibre obtainable from whole fruits and vegetables can increase satiety and reduce the caloric density of meals(Reference Slavin and Lloyd49). In addition, evidence suggests that the additive and synergistic interactions of phytochemicals, compounds present in fruits and vegetables, are responsible for their health benefits(Reference Liu50).
We found that the variations in serum carotenoids, possibly reflecting fruit and vegetable intake, did not mediate ethnic differences in T2D prevalence. There was a higher prevalence of T2D among ethnic minority groups compared to the Dutch population, even after adjusting for potential confounders and serum carotenoids. While we saw an inverse association between serum carotenoids and T2D in the whole population, a focus on fruits and vegetables alone on top of the known risk factors would not sufficiently reduce ethnic differences in T2D. This suggests that while fruit and vegetable intake is beneficial, a broader approach should be used to help tackle the ethnic inequalities in T2D prevalence. This is also in line with the observed beneficial effects of combined behavioural interventions across populations(Reference Johns, Hartmann-Boyce and Jebb51).
This study has some limitations. This being a cross-sectional study, we could not confirm a causal pathway between carotenoids and T2D, compared to previous studies(Reference Cooper, Sharp and Lentjes7,Reference Satija, Bhupathiraju and Rimm8) . While we adjusted for confounders associated with T2D and serum carotenoid concentrations, whether the associations found in our study reflect residual confounding cannot be ruled out. In addition, the possibility that the significant associations were the result of a change in the dietary patterns of participants after T2D diagnosis cannot be excluded. We planned to conduct a sensitivity analysis only with newly diagnosed T2D cases. However, the small number of incident cases precluded such an analysis. Furthermore, the possibility that reverse causation may have affected our results cannot be excluded. As discussed previously, T2D is associated with higher oxidative stress and pro-inflammatory markers. For that reason, the prevalence of T2D could cause a decrease in serum carotenoid concentrations and not the other way around.
Secondly, admittedly, serum carotenoid concentrations do reflect fruit and vegetable intake of previous weeks(Reference Al-Delaimy, Slimani and Ferrari37,Reference Wang, Liu and Pradhan52) . Nonetheless, carotenoid concentrations are not under strict homeostatic control but are influenced by absorption, metabolism and excretion. Carotenoid distribution in the current study, however, is in line with ethnic differences in fruit and vegetable intake in FFQ within our population reported previously. Moreover, explorations of the validity of FFQ showed acceptable to good correlations between fruit and vegetable intake and concentrations of carotenoids(Reference Carlsen, Karlsen and Lillegaard53,Reference Sluik, Geelen and de Vries54) ; the magnitude of these correlations was comparable to that in our study (data not shown). Although a single carotenoid measurement at baseline reflected fruit and vegetable intake of previous weeks, multiple measurements over time would have provided a more accurate classification of fruit and vegetable intake of participants, especially since T2D is a chronic disease that develops over several years.
Finally, the study population constitutes a subsample of participants from the total HELIUS population that had volunteered to undergo additional research. As a result, the participants included in this study might represent a healthier sample compared to the total population. However, it was unlikely that the selection of participants differed across ethnic groups and that the between-group comparisons were affected.
In conclusion, our results show that serum carotenoid concentrations vary across ethnic groups. In addition, higher carotenoid levels in populations of diverse ethnic origins, including those at a high risk of T2D, are associated with lower T2D prevalence. However, a limited contribution of these carotenoid concentrations to ethnic differences in T2D suggests that a focus on increasing fruit and vegetable intake alone will not likely eliminate ethnic differences in T2D prevalence.
Acknowledgements
Acknowledgements: We gratefully acknowledge the AMC Biobank for their support in biobank management and high-quality storage of collected samples. We are grateful to the participants of the HELIUS study and the management team, research nurses, interviewers, research assistants and other staff who have taken part in this study. Financial support: The work of M.M. and I.G.M.V. was supported by the Health Programme 2014–2020 from the European Union, grant number 664609 HP-PJ-2014. The HELIUS study is conducted by the Amsterdam UMC and the Public Health Service of Amsterdam. Both organisations provided core support to HELIUS. The HELIUS study is also funded by the Dutch Heart Foundation, the Netherlands Organization for Health Research and Development (ZonMw), the European Union (FP-7) and the European Fund for the Integration of non-EU immigrants (EIF). The European Union, The Dutch Heart Foundation, ZonMw and EIF had no role in the design, analysis or writing of this article. Conflict of interest: None. Authorship: P.F.S., M.M. and M.N. designed the study. P.F.S. performed data analysis and wrote the manuscript together with M.M. I.G.M.V., M.N., R.J.G.P. and M.B.S. contributed to the interpretation of results. All authors critically revised the manuscript for important intellectual content and approved the version to be published. I.G.M.V. is the guarantor. Ethics of human subject participation: This study was conducted in accordance with the guidelines laid down in the Declaration of Helsinki, and all procedures involving study participants were approved by the AMC Ethical Review Board. Written informed consent was obtained from all participants.
Supplementary material
For supplementary material accompanying this article visit https://doi.org/10.1017/S1368980019004968


