In the process of empowering the consumer, nutrition labelling has become a widely discussed topic on a legislative, regulatory and public level(Reference Cheftel1–Reference Caraher and Coveney3). Providing buyers with information on the nutritional value and content of pre-packaged food products is, among other things, an attempt to fight costly overweight and obesity rates throughout Europe. It is envisaged that informed decision making could lead to a change in consumer eating habits(Reference Borgmeier and Westenhoefer4–Reference Lawrence9).
There is broad consensus among academics, government legislators and consumer protection activists that, on a European as well as national level, action must be taken to combat overweight and obesity issues(Reference Grunert and Wills5, Reference Cowburn and Stockley6, Reference Drichoutis, Lazaridis and Nayga10). Apart from encouraging physical activity, education on nutrition and healthy dieting is also regarded necessary to increase consumer information on and knowledge of nutrients and recommended daily intakes(Reference Lawrence9, Reference Lobstein and Davies11, 12). As a result, both the European Union and many of its member states have made regulating the food industry in terms of rules for nutrition labelling one of their priorities – not least due to increased pressure from consumer protection institutions and public interest in weight issues(Reference Lobstein and Davies11, Reference Nishida, Uauy and Kumanyika13–Reference Trübswasser and Branca15). However, the specific design of the label format and the content that is conveyed to consumers have evoked considerable debate. These formats range from single healthy eating symbols over complex numerical reference designs to the much debated, colour-induced traffic light signposting scheme(Reference Stockley, Kaur and Rayner16–Reference Jones and Richardson19) (Fig. 1).
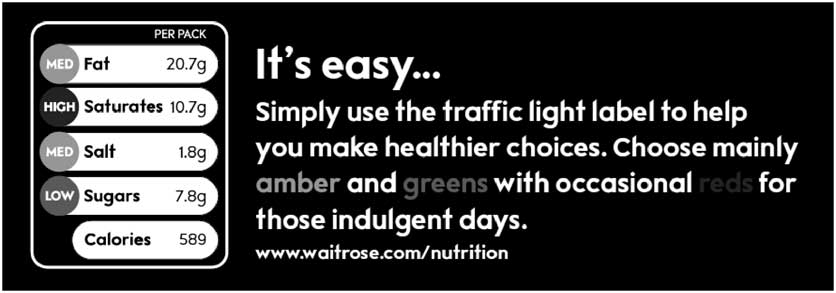
Fig. 1 Exemplary illustration of the traffic light signposting labelling format(57)
The purpose of the present paper is to contribute to scientific knowledge on consumers’ understanding of nutrition labelling by analysing an existing labelling scheme in detail. In general, little research has been done on any system concerning the actual effects of label formats on consumer behaviour. Among these, the traffic light signposting scheme – developed by the British Food Standards Agency (FSA) – is the most controversial option in labelling food products. The use of colours (red, amber and green) to indicate the (im)proper amount of certain nutrients has not satisfactorily been investigated in terms of the effects on consumers’ perception, attitude and evaluation. In order to gain insights we examine the effects of a nutritional declaration combined with a colour-coded evaluation scheme by applying a choice-based conjoint analysis. We aim to investigate the relevance of single nutrients and the resulting product preferences as well as the effect of colour coding on health evaluation.
The colour coding of the four nutrients included in the labelling scheme (fat, saturated fat, sugar, sodium) as red (high in content), amber (medium content) or green (low in content) is of central relevance. The selection of the four nutrients was based on their impact on public health. The cut-off points for the change in traffic light colours were based on the European Regulation for Nutrition and Health Claims(Reference Kelly, Hughes and Chapman20, 21). In comparison to other nutrition labelling systems, traffic light signposting has been rated as more user-friendly(Reference Harper, Souta and Ince22–Reference Gorton, Ni Mhurchu and Chen24). Critics, on the other hand, argue that the use of just three signalling colours oversimplifies complex dietary relationships and that this leads to an oversimplified, unrealistic and consumer-unfriendly labelling: good products v. bad products(25, 26).
Research on nutrition labelling schemes has mainly focused on consumers’ use of different label formats as well as their preferences for certain design schemes(Reference Borgmeier and Westenhoefer4, Reference Cowburn and Stockley7, Reference Grunert, Wills and Fernández-Celemím18). Consumer associations have undertaken a great part of these studies. They report that, in general, consumers favour (front-of-pack) nutrition labelling as they feel that it aids their shopping decisions(Reference Stockley, Kaur and Rayner16, Reference Gallani27, 28). Survey participants indicate their satisfaction with the current amount of information on labels, despite low actual usage rates during grocery shopping(Reference Harper, Souta and Ince22, 29, 30). Scientific contributions from refereed journals can be found less frequently. However, several conclusions can be drawn from the studies at hand, despite country-specific surveys and the selected nutrition labelling systems reviewed. First, consumer understanding of the information conveyed is generally highest for those formats combining text and further evaluative mechanisms such as colour schemes(Reference Borgmeier and Westenhoefer4, Reference Kelly, Hughes and Chapman20, Reference Malam, Clegg and Kirwan31). Second, simplicity and uniformity of labelling systems can be regarded as the prevailing demands from the consumer side, thus proving consumer confusion and misguidance as the predominant ‘state of mind’ regarding nutrition labelling issues(Reference Feunekes, Gortemaker and Willems17, Reference van Kleef, van Trijp and Paeps23). In addition, it has even been found that consumers appear to accept price premiums for products containing nutrition labels as opposed to those foods without label information(Reference Loureiro, Gracia and Nayga32).
From a consumer behaviour research point of view, however, there seems to be a much wider field of research with a far greater impact: a detailed analysis of label formats’ effects on consumer understanding, perception and choice of products, especially in the light of signal colour use. Most research, as illustrated above, compares different nutrition labelling systems in terms of consumer understanding, preference and ability to identify healthier food variants(Reference Borgmeier and Westenhoefer4, Reference Stockley, Kaur and Rayner16, Reference Feunekes, Gortemaker and Willems17, Reference Jones and Richardson19, Reference Kelly, Hughes and Chapman20, Reference van Kleef, van Trijp and Paeps23). Few studies have put the focus on a specific nutrition label such as the traffic light signposting scheme and examined possible effects on consumer behaviour and/or sales data(Reference Jones and Richardson19, Reference Vyth, Steenhuis and Vlot33, Reference Sacks, Rayner and Swinburn34). While these results are fragmented and differ due to the choice of sample and analysis, the authors highly recommend that ‘further research on the influence of nutrition [traffic light] signposting will be needed…’(Reference Sacks, Rayner and Swinburn34). This is in line with findings from Gorton and colleagues(Reference Gorton, Ni Mhurchu and Chen24) who reported that traffic light labels were best understood and most frequently preferred among New Zealand study participants but that more research was needed on the underlying effects of colour coding on choice behaviour and inference making. Drawing on Jones and Richardson(Reference Jones and Richardson19) who used eye-movement recording to show that traffic light labelling can help guide consumer attention to important nutrients and improve the accuracy of healthiness ratings, to date there has been only one study – undertaken by Balcombe and colleagues(Reference Balcombe, Fraser and Di Falco35) – that further investigated the effects traffic light signposting on consumer behaviour and willingness to pay(Reference Caraher and Coveney3, Reference Grunert, Wills and Fernández-Celemím18, Reference Sacks, Rayner and Swinburn34). In addition to this, effects of the single attributes of the label including the possible influence of colour-coded nutrition information on food choice have not been examined in detail. Concerning the use of colours in consumer choice, decision making and purchase behaviour, studies from related areas of research have focused on the effects of colour coding and the images conveyed by different colours(Reference Grossman and Wisenblit36–Reference Bellizzi, Crowley and Hasty40). It is noted (p. 41) that ‘colours are known to possess emotional and psychological properties. (…) Colour used in packaging can be equally important in determining a product's desirability’(Reference Madden, Hewett and Roth41). Despite national differences in perception and meaning attributed to single colours, there is agreement that green is associated with the adjectives ‘peaceful’, ‘gentle’ and ‘calming’, thus conveying positive attributes for consumers. Conversely, red denotes ‘hot’, ‘emotional’ and ‘sharp’(Reference Crowley38, Reference Madden, Hewett and Roth41). Moreover, Bellizzi and colleagues(Reference Bellizzi, Crowley and Hasty40) found consumers to perceive store environments designed in warm colours such as red as unfavourable and negative.
Research implications
Considering the importance of nutrition labelling on the one hand and the lack of qualitative research on the other hand, the need for detailed analyses of existing labelling systems and their impact on consumers’ health perceptions becomes obvious. Consequently, we focus on colour coding as a nutrition labelling mechanism as there has been increased interest of late, followed by controversial discussions. The conducted survey and the subsequent analyses should help answer the following research questions, based on the prior literature review:
1. Which elements of the traffic light signposting scheme are most important in consumers’ product health evaluations?
2. What effects do changes in the colour code of a certain nutrient (from green to amber and from amber to red) have on a food product's health evaluations?
3. Does the colour coding of nutrients have an effect on consumer perceptions and on health evaluations of food products?
Methodology
In order to achieve an understanding of the effects of food labelling and especially of the traffic light signposting scheme on consumers’ preferences and choices, we conducted a large online survey in November 2009. We asked the respondents to answer general questions regarding nutrition and health consciousness as well as to rate food products on the basis of their traffic light signpost labelling. By means of a choice-based conjoint analysis, a variety of stimuli was presented – each comprising different nutritive values within the traffic light signposting scheme. A conjoint method was chosen to assess the relative impact of single product attributes as this has proved to be an adequate tool for preference and utility measurement(Reference Chakraborty, Ball and Gaeth42, Reference Louviere43). Choice-based conjoint analyses are advantageous compared with classical rating-based approaches as choice tasks are more comparable to real-life buying decisions, thus leading to a higher external validity(Reference Moore44). In a first step, we analysed the importance of the attributes and the part-worth coefficient and utility of the attribute levels. As these are rather abstract, several subsequent market simulations were conducted in order to obtain further insights into the impact of colour changes. Market simulations show what share of preference a product with certain attribute levels would achieve compared with the other products integrated into the simulation. The main advantage of market simulations is the ease with which the results can be interpreted, as they are rescaled from 0 to 100 and are assumed to have ratio-scale properties, thus allowing a direct comparison of the values.Footnote * Additionally, the results of the hierarchical Bayes estimation can be taken into account, as the software computes shares of preferences on the basis of individual utilities(Reference Green and Srinivasan45, Reference Orme46). Hence, they were expected to contribute to properly answering the second research question on the impact of a change in nutrition colour coding on consumers’ health perception of a product and on their subsequent product preferences.
Survey
The questionnaire started off with general questions on nutrition knowledge, awareness of a healthy diet's importance and self-reported use of nutrition labels, with items derived from similar studies in the literature(Reference Borgmeier and Westenhoefer4, Reference Feunekes, Gortemaker and Willems17, Reference van Kleef, van Trijp and Paeps23, Reference Gorton, Ni Mhurchu and Chen24). The scheme was then introduced by presenting the participants with pictorial examples and having them rate the label's usefulness. The introductory part was followed by the choice-based conjoint experiment. After completing the choice sets, the respondents repeated rating the traffic light labelling system in terms of its usefulness, as it was expected that active use of the label format could lead to changes in the ratings. The survey ended with a request for demographic information, i.e. gender, age, educational level, and number of persons and children living in the household.
Design of choice experiment
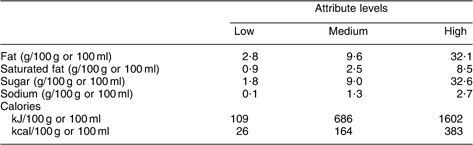
In order to simulate real buying situations, we had to create realistic choice situations of appropriate relevance for the participants. It was therefore necessary to select one exemplary product category for evaluation in the survey to help the respondents imagine a real buying decision. Yoghurt was chosen as an appropriate product category for the analysis, as it made many nutritive variations possible, especially regarding sugar, fats and saturated fats(Reference Grunert, Wills and Fernández-Celemím18). As shown in Fig. 1, the attributes included in the traffic light signposting system are: sugar, fat, saturated fat, sodium and calories per 100 g/ml. Depending on the amount of each ingredient, the attribute variations were labelled low, medium and high, with high coloured red, medium amber and low green. The calories were not colour coded but simply provided in absolute numbers below the traffic light scheme (Fig. 2).
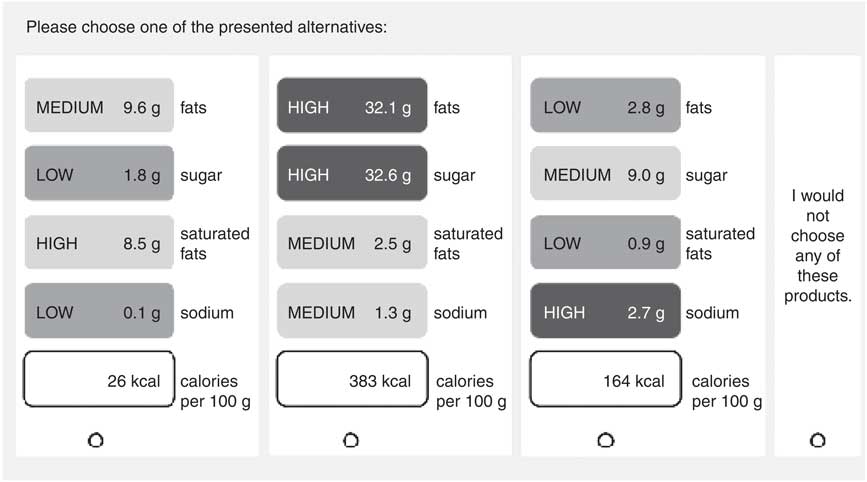
Fig. 2 Exemplary choice set
The boundaries of the attribute-level categories were adopted from reference values developed by the FSA(47). The graphical implementation was based on recommendations by the German consumer protection institution Foodwatch(48) (see also Appendix), as this design has become the most frequently used format when traffic lights are used for nutrition labelling. The respondents were presented with nine choice tasks, each containing three different hypothetical stimuli and a no-choice option. Survey participants were asked to choose the product they preferred if they were interested in selecting the healthiest alternative based only on the information on the nutrition labelling scheme. A reduced orthogonal design was applied to limit the number of required stimuli. Both stimuli and choice sets were created randomly, using a computer-generated design via the Sawtooth software version 6·4·2 (Sawtooth Software Inc., Sequim, WA, USA). Apart from choosing one of the products, the respondents could also opt for the no-choice option, meaning that they did not evaluate any of the given stimuli as healthy and would rather not buy any product at all. This was helpful in simulating a real buying decision and provides a basic utility level through which the calculated part-worth utilities can be compared(Reference Fuchs49–Reference Haaijer, Kamakura and Wedel51).Footnote * An exemplary choice situation has been demonstrated in Fig. 2.
Certain limitations had to be accepted regarding the requirements of choice-based conjoint analysis. De-compositional methods generally require their attributes to be independent from one another(Reference Fuchs49) which, when applied to food products’ nutritional values, can lead to several problems: the amount of saturated fat a product contains depends on the overall fat content, consequently it cannot exceed a certain relative threshold. Furthermore, a product's number of calories is also dependent on the rest of the nutritive values, as foods high in fat and sugar automatically contain more energy. However, as it seemed more important to fulfil the requirements of the conjoint method, unrealistic combinations were allowed for, assuming that most of the survey participants did not have the necessary nutritional knowledge to detect this(Reference Cowburn and Stockley6).
Results
Sample characteristics
In total 2056 respondents participated in the survey conducted in November 2009. With two-thirds (69 %) of the respondents female, gender distribution was rather skewed. With regard to the age distribution, the average age was rather young, with the majority of the respondents (70 %) in the 18–24 years and 25–34 years age groups (25 %). The majority of the participants (77 %) indicated that they had a higher level of education and 19 % had even graduated, which is not surprising as the survey was conducted mainly among students from a German university. The average household size was 2·63 persons, with most households (30 %) consisting of two people and only 15·3 % of respondents indicating that they had children. Not only did this account for a rather small proportion of the sample, but it also made it impossible to test children's influence on nutrition knowledge and awareness. When asked, almost all of the respondents (94 %) were familiar with the nutrition table predominantly displayed on the back of pre-packaged food products in Germany, i.e. the nutrition facts panel, and indicated that they had already seen it on food they had bought previously.
Traffic light signposting scheme
Overall, the participants rated the traffic light signposting scheme on a 7-point Likert scale as fairly understandable (mean = 5·95). However, no clear consensus could be found on the question whether it was an appropriate way to enhance health-conscious nutrition behaviour. With a mean value of 4·9, the item was rated only slightly above average and the variance of 2·67 displayed a rather scattered answering pattern. Surprisingly, the comprehensibility of the system suffered after it was put to use, as the mean value showed a significant decline (meanbefore = 4·9 v. meanafter = 4·5). Furthermore, with a mean value of 4·68 (variance = 2·89), agreement with the statement that the participants would take this labelling system into consideration during actual buying situations was only moderate. This shows that the general awareness and importance of labelling need to be increased and that the effects of the traffic light signposting system have to be explored in greater detail.
Choice-based conjoint analysis
We obtained a total of 2002 complete data sets for the conjoint analysis. With each respondent completing nine choice sets (decision situations), a total of 18 018 product ratings were available. Overall, the no-choice option was selected in 3191 (17·71 %) decision situations. Table 1 shows how often each attribute level was chosen when it appeared in a choice set.
Table 1 Count analysis for all nutrients: online survey among German undergraduate students (n 2002), November 2009
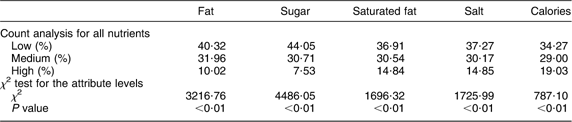
The results show that the respondents specifically avoided products high in fat (10·02 %) and sugar (7·53 %), whereas those options high in calories (not colour coded) do not seem to have a similar deterrent effect, as they were still chosen in about 19 % of cases. Owing to the variation in the attribute levels, it is possible that the respondents chose unhealthy characteristics when they appeared together with other, healthier ones that could compensate for them. When applying the χ 2 test, all of the differences between the attribute levels were significant (P < 0·05). We furthermore checked for unobserved heterogeneity using hierarchical Bayes estimation, which provides utilities at an individual level and treats heterogeneity better than other common approaches(Reference Lenk, De Sarbo and Green52). However, the analysis did not reveal any differences, thus allowing for an aggregated analysis. Consequently, we focused on the aggregated the results of the Multinomial Logit approach for the analyses to follow(Reference Fuchs49, Reference Sarstedt53).
Subsequently, both the importance of the attributes and the part-worth coefficients and utilities of the attribute levels were estimated. On applying t tests, all part-worth coefficients in the present study were significant at a level of 0·01. The average utility values were computed on the basis of the part-worth coefficients, which were rescaled (ranging from –100 to 100) and centred to 0. Based on the utilities we calculated the importance of the single attributes, showing the relative impact of the respective attributes on the participants’ decisions.Footnote * Figure 3 and Table 2 provide an overview of these results.
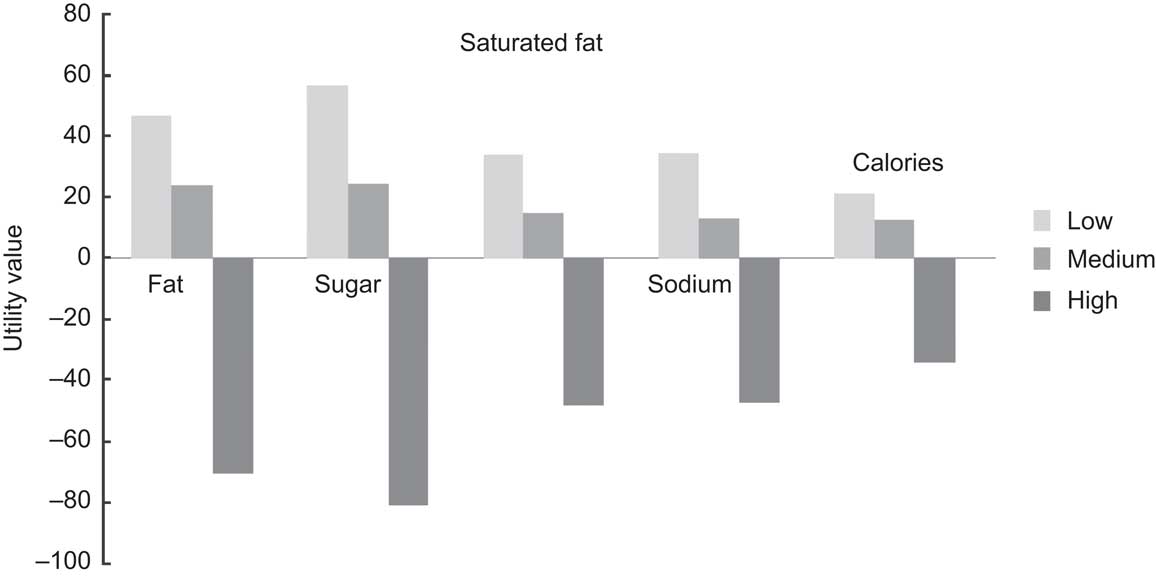
Fig. 3 Graphical illustration of utility values for all nutrients
Table 2 Utility values and importances for all nutrients: online survey among German undergraduate students (n 2002), November 2009
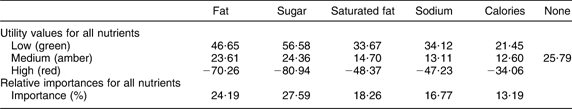
Number of data sets: 2002.
We found that with a relative importance of 27·59 %, sugar was the most important attribute of the respondents, followed by fat with 24·19 %. Surprisingly, the amount of saturated fat was regarded as less important when deciding between the different stimuli (saturated fat: 18·26 %; sodium: 16·77 %), while calories were least important with a relative importance of 13·19 %. These results provided the information required to answer the first research question on the importance of the attributes.
An analysis of the graphic representation revealed that a high amount (red) of each ingredient seemed to contribute more to a negative utility than a low amount (green) to a positive utility, especially in comparison with the baseline utility level of the no-choice option (25·79). Although the data analysis did not allow for a concluding evaluation of this finding, it can be assumed that when a red colour code is used, people associate it with mental images such as sharp, unfavourable and negative as literature has proven(Reference Crowley38, Reference Bellizzi, Crowley and Hasty40, Reference Madden, Hewett and Roth41). Consequently, the reduction in perceived healthiness of the product is greater for each attribute when the colour coding changes from amber to red as compared with a change in colour from green to amber. A product rated low (green) regarding all its attributes has an average utility of 192·45, a product rated medium (amber) has one of 88·38, while a product rated high (red) reveals a strong negative utility of −280·86. Therefore, a loss in utility of 104·07 is ascertained when all attributes change their colour coding from green to amber and a loss of 369·24 when they all switch from amber to red – a decrease of more than three times. Furthermore, the differences are much smaller regarding the caloric attribute of a nutrition label that was not colour coded.
The following market simulation results show how overall preferences change when one attribute is altered (in terms of colour coding) while all the other attributes remain constant.
Table 3 shows the results of two exemplary market simulations analysing the influence of category changes (colour coded for sugar and not colour coded for calories) on the shares of preference.
Table 3 Market simulations
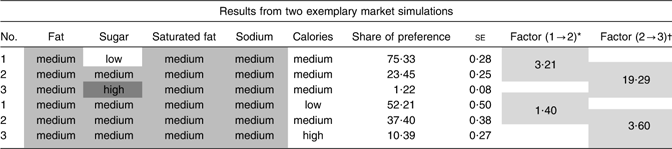
*Factor stimulus 1 to stimulus 2 (75·33/23·45 and 52·21/37·40, respectively).
†Factor stimulus 2 to stimulus 3 (23·45/1·22 and 37·40/10·39, respectively).
It can be observed that with regard to sugar, a change from green to amber leads to a share of preference which is only about a third of the original amount while a change from amber to red leads to a nineteen times higher decline compared with the baseline utility. Interestingly, the severity of this effect was not reflected in a similar change from low to medium regarding the amount of calories which were not colour coded (1·40), in comparison to the change from medium to high (3·60). Although this finding cannot be fully ascribed to the change in colours, it provides further meaningful insight into answering the second research question, as the colours seemingly enhance the effects on health evaluation.
In order to answer the last research question concerning the influence of the colour code on consumers’ health perception, we refer to respondents’ self-rating (see Fig. 4). This was necessary because the conjoint experiment could only provide an answer as to which attribute was most important and not to whether the colour or the concrete value had led to that rating.

Fig. 4 Self-rated importance of all nutrients: online survey among German undergraduate students (n 2002), November 2009. Two items were used for measurement: (i) ‘Which element of the traffic light signposting scheme did you use predominantly when choosing a product?’ (represented by bars); and (ii) ‘Did you incorporate further elements into your food choice? If so, which?’ (represented proportionally within bars; only the four most frequent answers for each element are presented, the rest was subsumed under ‘others’)
The results show that about 40 % of the respondents indicated that the colour coding was the most important element in their evaluation. The remaining label attributes were considered first by 9·0–13·8 % of the respondents while sodium was the least important attribute being mentioned only by 2·2 %. Moreover, 11·7 % of the participants indicated that they considered the number of calories first, which made them the second most important element in decision making. Consequently, calories constantly appear among the top four attributes considered as a second factor in product choices. In contrast, based on the conjoint analysis, calories were the least important attribute. Sodium, on the other hand, was considered first by only 2·2 % of the participants, whereas it was more important than the calories during the discrete choices, raising the question of whether this can be attributed to the colour coding. Hence, this analysis should help disentangle the effect arising from colour coding from the effect of the categories as such. Although self-rating should be regarded with caution, it can nevertheless be stated that most of the respondents were aware of the colours in the nutrition labelling system and many took them into consideration during the decision process as they helped reduce the complexity of it and also served as a signal.
Discussion
The present study has provided meaningful insights into the effects of traffic light labelling on consumer behaviour and food choice. It was shown that colour coding can have the anticipated(Reference Jones and Richardson19, Reference Madden, Hewett and Roth41, Reference Fuchs49), visually dominating effect on consumer health perception and subsequent product choice, as compared with ‘text-based’ nutrition declarations. However, the study should be looked at and evaluated in the light of its exploratory and experimental character. The aim was to gain an understanding of consumer decision making when using the traffic light signposting scheme.
On the basis of the results of the conjoint analysis, we found that the participants had medium nutrition knowledge, leading to the conclusion that general awareness of nutrition and healthy dieting could be enhanced. Furthermore, we explored the preference patterns of choice situations, revealing that consumers mainly focus on sugar and fats when deciding between alternatives – high amounts of these ingredients were avoided if possible. We found that saturated fat, sodium and, contrary to a general notion in literature in this field(Reference Cowburn and Stockley7, Reference van Kleef, van Trijp and Paeps23), even calories were of less importance for consumer decision making. The ranges of the part-worth utilities between medium (amber) and high (red) compared with the ones between medium (amber) and low (green) as well as market simulations showed that a change from medium to high levels of nutrients leads to a higher loss in utility or market share respectively than the change from low to medium amounts. Additionally, the analysis revealed that this effect was smaller for calories. Bearing in mind that calories are not colour coded, this can be regarded as a hint that colours intensify utility changes(Reference Grunert, Wills and Fernández-Celemím18, Reference Balcombe, Fraser and Di Falco35). When the previous results are combined with the ones obtained from the self-ratings, the importance of the colour coding becomes specifically obvious. Most of the respondents focused on the colours of the nutrition label while maintaining that they also took the number of calories into account, whereas the results of the conjoint analysis revealed the contrary: the utility values were lowest for calories. This leads to the conclusion that, as a contributory factor allowing an adequate food choice, the value of indicating the number of calories decreases if they are not colour coded in the nutrition labelling scheme. Furthermore, this confirms the signalling effect of the colour code as it helps reduce complexity of decision making(Reference Jones and Richardson19). An explanation might be that people generally try to simplify tasks by reducing the information they take into consideration before making decisions, which is called the ‘prominence effect’ as respondents emphasise more important or predominant attributes while neglecting others. This effect tends to be a greater problem in choice-based approaches than it is in rating-based ones(Reference Moore44).
Regarding the limitations of the study, application of an alternative conjoint analysis method could be a potential source of improvement as it would be useful to validate the present results using either a rating-based approach or a limit-card conjoint analysis combining the strengths of both previous methods(Reference Voeth and Hahn54). Additionally, further research should address the heterogeneity of the data in more detail. It seems plausible that respondents with children, those belonging to a special age group or those with significant nutrition knowledge would base their decisions on different facts. In the present study, this was not a possibility as the sample was rather homogeneous, especially regarding children and age. The selection of the exemplary product category also needs to be given further attention. Yoghurt seemed to be an appropriate product as it offers many nutritive variations. However, the variations regarding sodium were rather limited and therefore might have been less important in the respondents’ decision making. It is necessary to replicate these studies with other products and categories, as the choice of product could vary greatly depending on its typical nutrient content. Moreover, the choice situation as presented in this online survey could have limited the external validity of the results. With no other rating criteria available, the participants were forced to focus solely on the nutrition labelling, whereas in real-life buying situations consumers would consider a variety of other criteria (e.g. price, packaging and brands)(Reference Grunert and Wills5). Furthermore, it has been shown that the introduction of a new labelling format such as the traffic light signposting scheme can have different effects on different product categories(Reference Sacks, Rayner and Swinburn34). However, the relative effects of colours and changes in colours remain equivalent even if the absolute effects are reduced by other, real-life purchase determinants. The authors believe that the results also hold true for other groups of respondents, too, as the general processing of signalling colours has not been shown to vary to a great extent between different groups of respondents(Reference Grossman and Wisenblit36, Reference Crowley38). Nevertheless, our application of a convenient student sample accounts for a limitation that reduces the generalisability of the results. As students represent only one group of shoppers, the study should be replicated using a representative sample. Further research into real-life decision making and the actual use of labelling, as undertaken by Grunert and colleagues(Reference Grunert, Fernández-Celemín and Wills55), will be a promising extension of the study at hand; an example of measurement techniques recommended for this would be the so-called ‘thinking aloud’ method(Reference Grunert and Wills5). Lastly, the inclusion of a no-choice option constitutes a statistical limitation, as it is not possible to ascertain why people chose this alternative over one of the product variations. The literature offers a list of reasons for selecting the no-choice option: a preferred attribute level might be missing, the respondent could be uninterested in the task, he/she could not understand the task properly, or might just be indifferent to the various stimuli(Reference Haaijer, Kamakura and Wedel51, Reference Johnson and Orme56).
Conclusions
In summary, we found that nutrition labelling and consumer information on foodstuffs, while lacking sufficient empirical investigation and qualitative research, strongly influence consumer decision making. Nevertheless, impact on consumer behaviour and the health evaluation of products by different labelling schemes is barely known and understood. On the other hand, the increased attention and demand for nutrition labelling call for further, preferably applied research in order to gain further insights into consumer dieting and nutrition behaviour, as well as into the general effects of colour coding on attitude, perception and choice of food products.
Acknowledgements
This research received no specific grant from any funding agency in the public, commercial or not-for-profit sectors. The authors declare that they have no competing interests. Both authors of this paper provided substantial contributions to this research.
Appendix
Overview on the attribute levels used for the traffic light signposting scheme