


As the older adult population grows, so does the need to identify factors that affect their health and contribute to successful ageing. Nutrition is an important factor in health, especially as older adults may experience functional, physiological and economic difficulties that put them at greater nutritional risk than the general population(Reference Lee and Frongillo1,Reference Sahyoun and Basiotis2) . High-quality diets, containing fruits, vegetables, whole grains, nuts and legumes, in accordance with the Dietary Guidelines for Americans (DGA), are generally protective from disease(3–5).
The Center for Nutrition Policy and Promotion, under the United States Department of Agriculture, releases food guidance tools for the general public to reference, such as MyPyramid and MyPlate(6). These guides aim to make dietary standards available to and understandable by consumers through simple nutrition education tools(Reference Davis, Britten and Myers7). Research shows that nutrition knowledge and the use of nutrition information are associated with dietary intake and quality(Reference Spronk, Kullen and Burdon8–Reference Wardle, Parmenter and Waller15). However, these associations have not been widely investigated in the older adult population(Reference Tabbakh and Freeland-Graves11). Specifically, there is limited research on how awareness and use of the Center for Nutrition Policy and Promotion food guide tools impact overall diet quality in the older adult population. Research has shown that older adults are less likely than adolescents and younger adults to be aware of food guide messaging from the government(Reference Tagtow and Raghavan16–Reference Vaccaro and Huffman18), suggesting that they should be targeted with nutrition education. It is also important to identify which segments of the older adult population have the greatest need for nutrition education, and how this lack of awareness may be associated with their dietary intake. A recent study found that US adults, and especially those over aged 50 years, who reported using MyPyramid or MyPlate nutrition information had better dietary intake with respect to individual measures of food groups and nutrients of interest(Reference Schwartz and Vernarelli19). However, the study did not focus on older adults or their characteristics. Additionally, the study did not examine intake using a measure of overall diet quality, and did not examine intake in association with nutrition awareness. Further research on nutrition awareness, use of nutrition information and diet quality in US older adults is warranted in order to inform policy and programmes on whom to target among older adults. Programmes can use this information to help older adults optimise their food selections and dietary patterns, with the aim of improving their health(Reference Wardle, Parmenter and Waller15,Reference Hendrie, Coveney and Cox20,Reference Paulionis21) .
To our knowledge, nationally representative studies that explore the diet quality of older adults in the USA are few in number(Reference Gao, Martin and Lin22–Reference Skarupski, Tangney and Li27). Dietary pattern analysis, rather than a focus on single foods or ingredients, is an increasingly recognised approach for examining dietary practices and assessing the extent to which the practices adhere to current dietary guidance(Reference Machon, Mateo-Abad and Vrotsou28). Methods to assess the quality of dietary patterns include the use of diet indexes or scores, such as the Healthy Eating Index (HEI)(Reference Kant29,Reference Ford, Jensen and Hartman30) . A self-rated diet quality question, measured on a 5-point Likert scale from excellent to poor, has also been validated as a proxy measure for diet quality(Reference Loftfield, Yi and Immerwahr31). Studies have also shown self-rated diet quality to be associated with measures of overall dietary intake, such as the HEI(Reference Adjoian, Firestone and Eisenhower32), the Dietary Approaches to Stop Hypertension diet(Reference Powell-Wiley, Miller and Agyemang33) and diet-related biochemical measures and health outcomes(Reference Bihuniak, Ramos and Huedo-Medina26).
The current study aims to add to the body of knowledge about nutrition and older adults by: (1) determining their diet quality based on both perception and HEI-2010 score, (2) identifying the characteristics associated with their reported awareness and use of nutrition information and (3) examining factors associated with their HEI scores and self-rated diet quality.
Methods
Study design, participants and recruitment
The study population was adults aged 60 years and older from the 2009–2010, 2011–2012 and 2013–2014 cycles of the National Health and Nutrition Examination Survey (NHANES). The NHANES is a series of cross-sectional, population-based surveys, representative of non-institutionalised, civilian US residents, conducted by the National Center for Health Statistics to assess the diet, health, nutrition status and health-related behaviours of the US population. The NHANES is conducted according to the guidelines laid down in the Declaration of Helsinki, and all procedures involving research study participants were approved by the National Center for Health Statistics Ethics Review Board. Written informed consent was obtained from all participants. The data from the three NHANES cycles were merged to increase the sample size. Details of the NHANES study design, implementation, data sets, analytic considerations and other documentation are available online(Reference Ahluwalia, Dwyer and Terry34,35) .
In the current study, the sample size of respondents aged 60 years and older was 5477. Excluded from the analyses were those with no valid dietary recalls (= 509), those whose energy intakes exceeded three sd from mean energy intakes, by sex (n 14) and those who did not answer questions on awareness and use of nutrition information (n 1898). The final analytic sample was 3056.
Dietary intake variables
NHANES participants are administered a series of detailed questionnaires at an in-home interview, followed by a visit to a mobile examination centre, where they undergo health examinations. Two days of dietary intake data are obtained: one during the in-person dietary recall at the mobile examination centre, and the second by telephone, 3–10 d after the mobile examination centre interview(36). The recalls are collected on both weekdays and weekend days using the United States Department of Agriculture’s fully computerised Automated Multiple-Pass Method for collecting 24-h recalls, with standardised probes to minimise misreporting of amounts of foods consumed(Reference Ahluwalia, Dwyer and Terry34). The resulting dietary data are known as What We Eat in America(36,Reference Rhodes, Adler and Clemens37) .
Two dietary outcome variables were used to measure diet quality: the HEI-2010 and self-rated diet quality. The HEI uses a scoring metric that measures adherence to the DGA(5,Reference Kirkpatrick, Reedy and Krebs-Smith38,Reference Guenther, Kirkpatrick and Reedy39) . The 2010 version of the HEI was chosen in order to measure the adherence to the set of DGA that was in use during the years the dietary data were collected. The HEI is a density-based measure of diet quality, with most components scored in relation to energy intake, except for fatty acid ratio, and energy from solid fats, sugar and alcohol(Reference Kirkpatrick, Reedy and Krebs-Smith38). The pertinent ratios and scoring of each HEI component are based on set standards of minimum and maximum scores(Reference Kirkpatrick, Reedy and Krebs-Smith38). The HEI-2010 is composed of twelve components: nine of them assess dietary adequacy (total fruit, whole fruit, total vegetables, greens and beans, whole grains, dairy, total protein foods, seafood and plant proteins, and fatty acids ratio), while three assess components for which moderate consumption is recommended (refined grains, Na and energy from solid fats, sugar and alcohol)(Reference Guenther, Kirkpatrick and Reedy39,Reference Guenther, Casavale and Reedy40) . Higher intakes of adequacy components and lower intakes of moderation components indicate better compliance with the DGA and result in higher scores(41). The total HEI score is the sum of the component scores, and the highest quality score is 100 points. Based on reported intakes from Day 1 recalls, and from Day 2 recalls, when available, total HEI-2010 and component scores were estimated using the Per-Person method. This method first calculates the ratio of the HEI components to energy intake at the individual level. Scores for each component are then calculated based on the scoring standards. The component scores are summed to calculate the total score. When more than one 24-h recall is available, the HEI component intake from the two 24-h recalls is summed and used to estimate scores for each person(Reference Kirkpatrick, Reedy and Krebs-Smith38,42) .
The other outcome variable in the current study was self-rated diet quality. In NHANES, participants answered the question, ‘In general, how healthy is your overall diet?’ on a 5-point Likert scale, with possible answers ranging from ‘excellent’ to ‘poor.’ Participants’ responses to this question were used to categorise respondents into three groups: those who self-rated their diet as excellent, very good, those who self-rated their diet as good and those who self-rated their diet as fair or poor. For the logistic regression, those who perceived their diet to be excellent, very good and good were combined as one group. This method was consistent with those used in prior studies to categorise perceptions of diet quality(Reference Loftfield, Yi and Immerwahr31,Reference Powell-Wiley, Miller and Agyemang33) .
Awareness and use of nutrition information variables
Participants in the 2009–2010 and 2011–2012 NHANES surveys were asked whether they had (yes/no): (1) heard of MyPyramid, and (2) heard of the Food Pyramid or the Food Guide Pyramid. In the 2013–2014 survey, participants were asked if they had (yes/no): (3) heard of MyPlate. Affirmative responses to any of these three questions were coded as ‘yes’ for nutrition awareness, and otherwise they were coded as ‘no’. If individuals responded positively to the awareness question described above, they were then asked about their use of this information. In the 2009–2010 and 2011–2012 surveys, participants were asked whether (yes/no) they had: (1) tried to follow the MyPyramid Plan/Pyramid plan. In the 2013–2014 survey, respondents were asked whether (yes/no) they had: (2) tried to follow the recommendations in the MyPlate plan. Using these questions, participants were divided into three categories: (1) those who reported awareness and use of nutrition information, (2) those who reported awareness but not use of nutrition information and (3) those who reported neither awareness nor use of nutrition information (referred to as no awareness throughout this article).
Socio-demographic, economic and health covariates
Respondents in NHANES were categorised into four food security categories (food security, marginal food security, low food security and very low food security), based on responses to the US Food Security Survey Model questions(Reference Gary, Nord and Price43). In the current analysis, the two lowest categories (low and very low food security) were combined into one group. Participants in all three cycles of NHANES were asked ‘Would you say your health in general is…’, with possible answers on 5-point Likert scale ranging from ‘excellent’ to ‘poor’. Participants were also asked if they were on a diet to lose weight or for some other health-related reason and were categorised based on whether they answered yes or no.
Additional covariates for the current analysis included age, sex, race/ethnicity, marital status, education, employment, food expenditure (money spent on food in supermarkets and other stores), use of social support services (Supplemental Nutrition Assistance Program (SNAP)(44), emergency food services, home-delivered meals, senior/community centre meals and cash assistance from government agencies) and poverty-income classification. Poverty level index classification in the NHANES is based on the ratio of household income to the poverty threshold developed by the US Department of Health and Human Services. A ratio of household income to the poverty threshold value of < 1·85 is commonly used to determine eligibility for federal assistance programmes(35,45) and was used as the cut-off designating the poverty level in the current analysis.
Data analysis
Characteristics of respondents were examined by sex and compared using χ 2 tests for categorical variables, and pairwise differences in continuous variables between groups were tested using a univariate t statistic. Taylor series linearisation was used to compute variance estimates. Multivariate linear regression analyses were performed to examine associations of nutrition awareness and use of nutrition information with total HEI scores at the individual level. Multivariate logistic regression analyses were used to examine associations with self-rated diet quality. Prior to conducting our analyses, all covariates were assessed for multicollinearity, and no evidence was found of significant correlations. These regression analyses were adjusted for potential confounders shown to be related to diet quality, such as age, race/ethnicity, education, marital status, household size, self-reported health, food expenditure and food security. As interactions between sex and nutrition awareness and use of nutrition information were found to be significant, analyses were stratified by sex. Statistical analysis was performed using SAS software programme (version 9.4; SAS Institute Inc.)(46) and SAS-Callable SUDAAN version 11.0 (RTI International)(47). The analyses were adjusted for NHANES complex survey design(48).
Results
Sample characteristics and dietary factors
The total number of adults aged 60 years and older who completed at least one 24-h recalls for the 2009–2014 cycles of NHANES and answered the questions about nutrition awareness was 3056. The study population was composed of 49·2 % men, the mean age was 69·5 years and almost half of the population (47·8 %) was non-Hispanic White. Compared with women, a significantly higher proportion of men were married or partnered, were employed and lived in households that had higher incomes (Table 1). However, significantly more women than men had at least some college education (Table 1). The mean HEI score of the study population was 58·5 ± 0·5 (results not shown), and women had a significantly higher HEI score when compared with men (Table 1). More men than women lived in food secure households (Table 1). A higher proportion of the women reported being on a special diet, receiving SNAP benefits and emergency food and eating meals at senior or community centres (Table 1).
Table 1 Characteristics of adults aged 60 years and above, NHANES 2009–2014
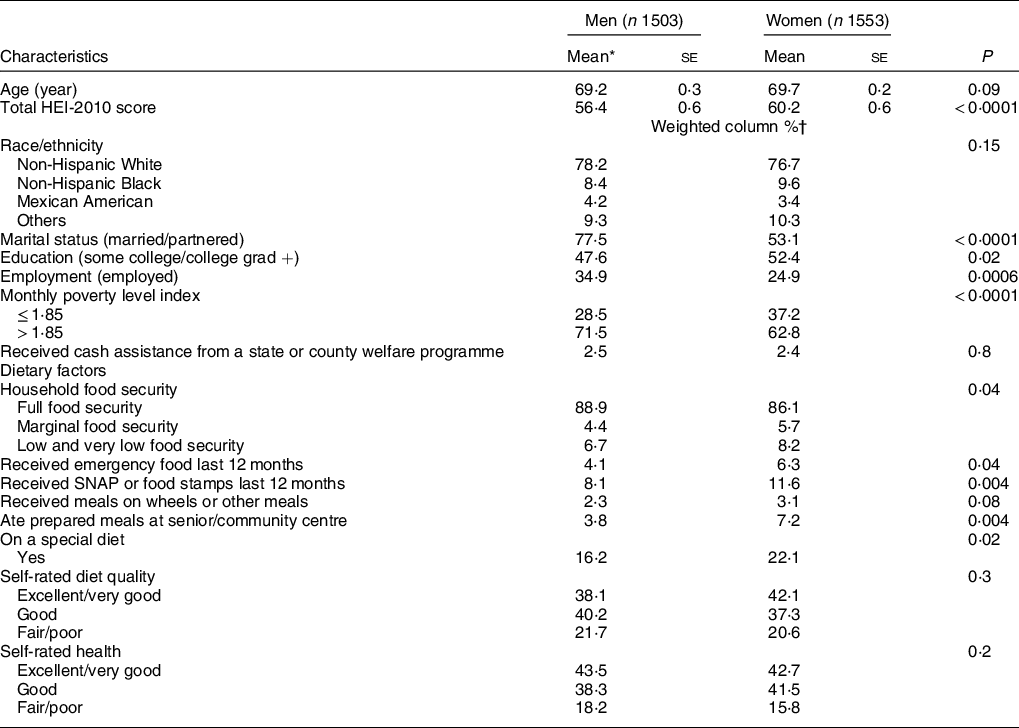
NHANES, National Health and Nutrition Examination Survey; HEI, Healthy Eating Index; SNAP, Supplemental Nutrition Assistance Program.
* Significant difference in means tested using t test.
† Significant difference in proportions tested using χ 2 test for categorical variables, percentages down the column may not sum to 100 due to rounding.
Nutrition awareness and use of nutrition information
A significantly higher proportion of women compared with men reported awareness and use of nutrition information, and more men compared with women were not aware of this information (Table 2). Adults aged 60–75 years were significantly more nutritionally aware than those aged 76 years and older and were also more likely to report use of nutrition information (Table 2). Those who were non-Hispanic White were most likely to be aware of nutrition information, while those who were Mexican American were least likely to be aware of and least likely to be using nutrition information (Table 2). Those with fair or poor self-rated health and self-rated diet were significantly less likely to have nutrition awareness, and those who self-rated their diet as excellent or very good and those who self-rated their health as excellent, very good or good were significantly more likely to report awareness and use of nutrition information (Table 2). Those who had received home-delivered meals, SNAP or emergency food in the past year were less likely to report awareness of nutrition information (Table 2). Results also show that a significantly higher proportion of those who were more educated, had higher income and were more food secure reported awareness of nutrition information as well as the use of this information (Table 2).
Table 2 Nutrition awareness and use of nutrition information by socio-demographic and economic characteristics, and OR showing associations of nutrition awareness and use of nutrition information with these characteristics, among adults aged 60 years and above (n 3056), NHANES 2009–2014*
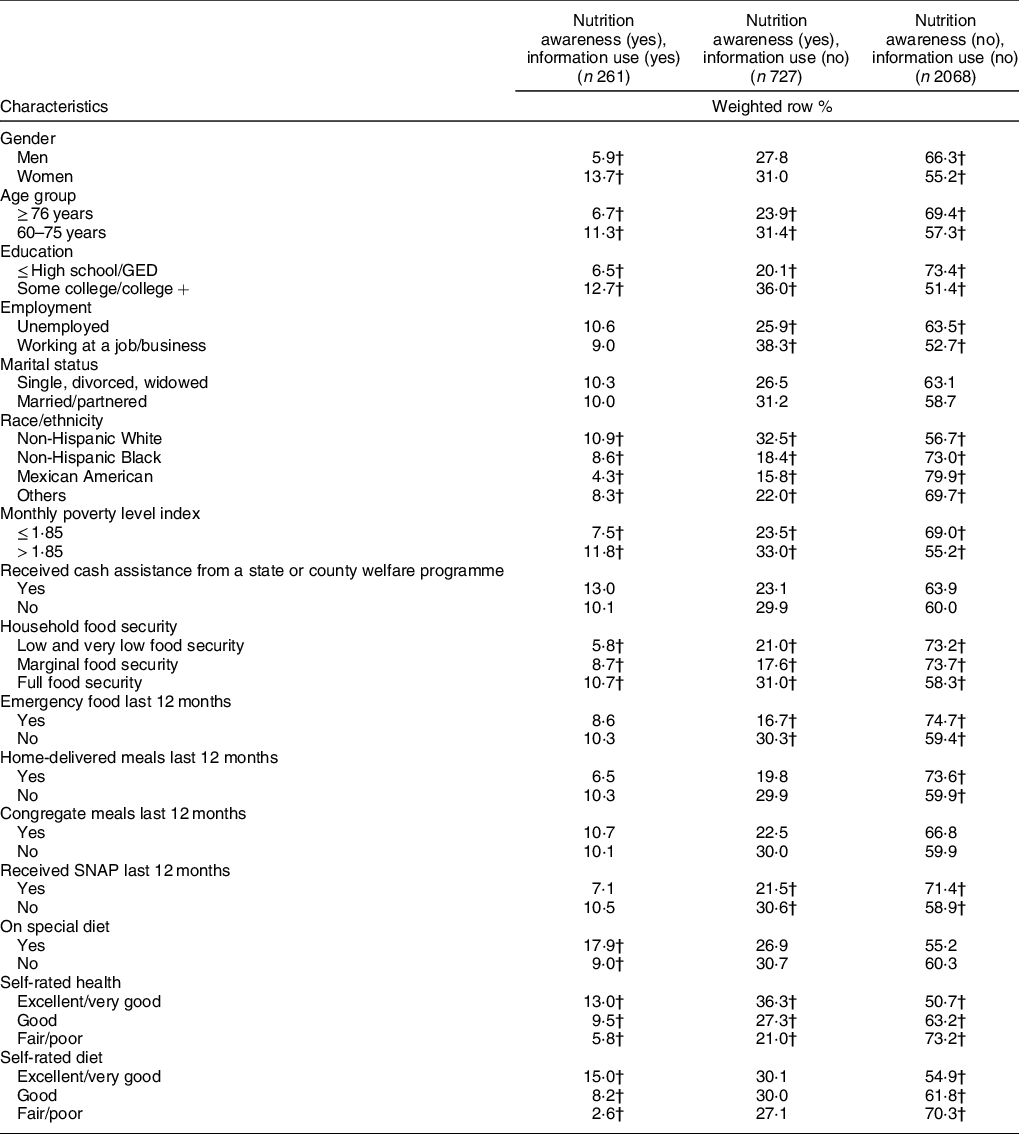
NHANES, National Health and Nutrition Examination Survey; GED, General Education Development; SNAP, Supplemental Nutrition Assistance Program.
* Significant difference in proportions tested using χ 2 test for categorical variables, percentages across the row may not sum to 100 due to rounding.
† Percentages within a column with unlike superscript letters were significantly different (P < 0·05).
Healthy Eating Index by nutrition awareness and use of nutrition information
Those who reported both awareness and use of nutrition information had significantly higher total mean HEI scores compared with those who reported awareness but not use, and compared with those who did not report awareness (Table 3). They also had significantly higher scores than the other two groups for greens and beans (Table 3). Those who reported both awareness and use of nutrition information had significantly higher scores than those who did not report awareness for total fruit, whole fruit, total vegetables, whole grains, seafood and plant proteins, and energy from solid fats, sugar and alcohol (Table 3). There was no significant difference between groups for dairy, total protein foods, fatty acids, refined grains and Na.
Table 3 Mean score and se for HEI-2010 and its components by nutrition awareness, and nutrition information use among adults aged 60 years and above, NHANES 2009–2014*

HEI, Healthy Eating Index; NHANES, National Health and Nutrition Examination Survey.
a,b,cMeans across a row with unlike superscript letters were significantly different (P < 0·05).
* Taylor series linearisation was used to compute variance estimates. Pairwise differences between groups were tested using a univariate t statistic. The significance level for statistical testing was set at P < 0·05.
† Any beans and peas not counted as total protein foods.
‡ Beans and peas included here (and not with vegetables) when the total protein foods standard is not met.
§ The ratio of unsaturated fatty acids to SFA.
|| Threshold for counting alcohol is > 13 g/4184 kJ (1000 kcal).
Multivariable associations of nutrition awareness and use of nutrition information with total Healthy Eating Index scores
When controlling for covariates in multivariate linear regression models, men who reported both awareness and use of nutrition information had a mean HEI score that was 6·0 points higher than men who did not report awareness (P ≤ 0·05) (Table 4). In women, reporting nutrition awareness, both with and without use of nutrition information, was significantly associated with higher HEI scores, when accounting for covariates (P ≤ 0·01) (Table 4). The multivariate model for both women and men showed that a special diet, older age, ‘Other’ race/ethnicity, education above high school, household food expenditure and excellent, very good or good self-rated health were all positively and significantly associated with HEI score (P ≤ 0·05) (Table 4). Food security was associated with higher HEI scores for women only (P ≤ 0·01), and Mexican American ethnicity was associated with higher HEI scores for men only (P ≤ 0·05) (Table 4).
Table 4 Multivariable linear regression coefficients of the associations between nutrition awareness and use of nutrition information with HEI-2010 scores, controlled for covariates in adults aged 60 years and above, NHANES 2009–2014*
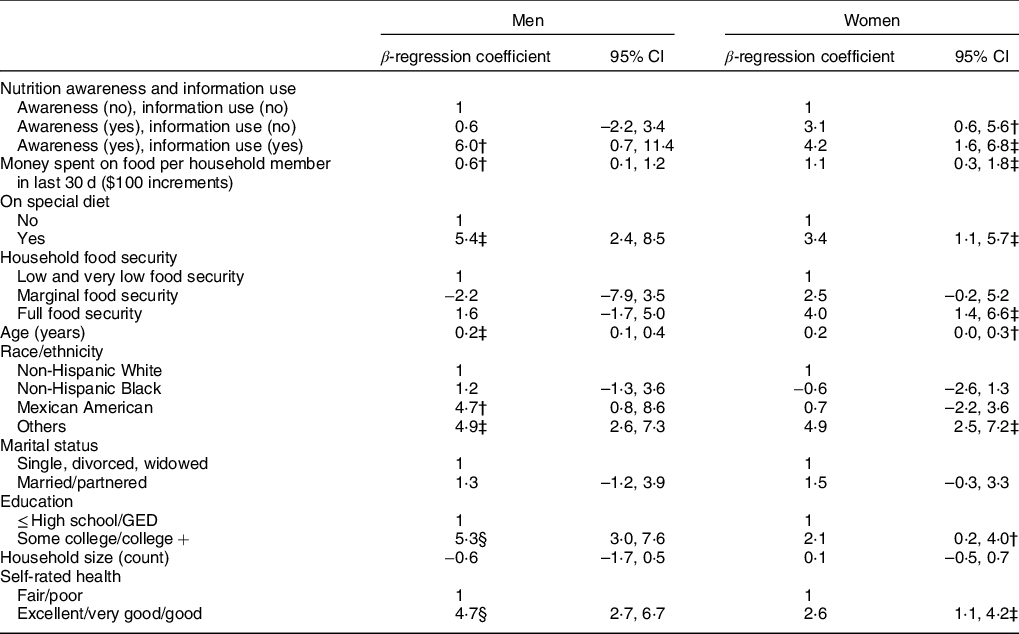
HEI, Healthy Eating Index; NHANES, National Health and Nutrition Examination Survey; GED, General Education Development.
* Multivariate adjusted linear regression models, accounting for complex survey design in NHANES.
† P ≤ 0.05.
‡ P ≤ 0·01.
§ P ≤ 0·0001.
Multivariable associations of nutrition awareness and use of nutrition information with self-rated diet quality
Logistic regression models showed that many participant characteristics that were significantly associated with HEI were also significantly associated with self-rated diet quality perceived as excellent, very good or good (Table 5). In multivariate logistic regression models, the odds of perceiving diet quality to be excellent, very good or good were significantly higher for both men (OR 5·6; 95 % CI 2·1, 15·0) and women (OR 2·1; 95 %CI 1·4, 3·0) who reported awareness and use of nutrition information (Table 5). Those with full food security had greater odds of better self-rated diet quality for both men (OR 2·2; 95 % CI 1·1, 4·3) and women (OR 1·6; 95 % CI 1·2, 2·2), compared to those with low and very low food security (Table 5). Women also had slightly higher odds of better self-rated diet quality if they lived in a household that was larger (OR 1·1 per person in household; 95 % CI 1·0, 1·3) or that spent more money on food (OR 1·3 per $100 spent; 95 % CI 1·1, 1·4). Mexican American women had lower odds of reporting excellent, very good or good diet quality in comparison with non-Hispanic White women (OR 0·5; 95 % CI 0·3, 0·7). Women who had attended at least some college also had greater odds of better self-rated diet quality (OR 1·4; 95 % CI 1·0, 1·9) (Table 5). For both men and women, those who were married or partnered had higher odds of rating their diets as excellent, very good or good, compared with those who were single (men: OR 1·5; 95 % CI 1·1, 2·1; women: OR 1·4; 95 % CI 1·0, 2·0) (Table 5). For both sexes, those who rated their health as excellent, very good and good also had higher odds of rating their diet quality as excellent, very good or good (men: OR 3·9; 95 % CI 2·4, 6·3; women: OR 4·8; 95 % CI 3·2, 7·3) (Table 5).
Table 5 OR and CI of the associations between nutrition awareness and use of nutrition information with diet quality self-rated as excellent, very good or good, controlling for covariates, in adults aged 60 years and above, NHANES 2009–2014*
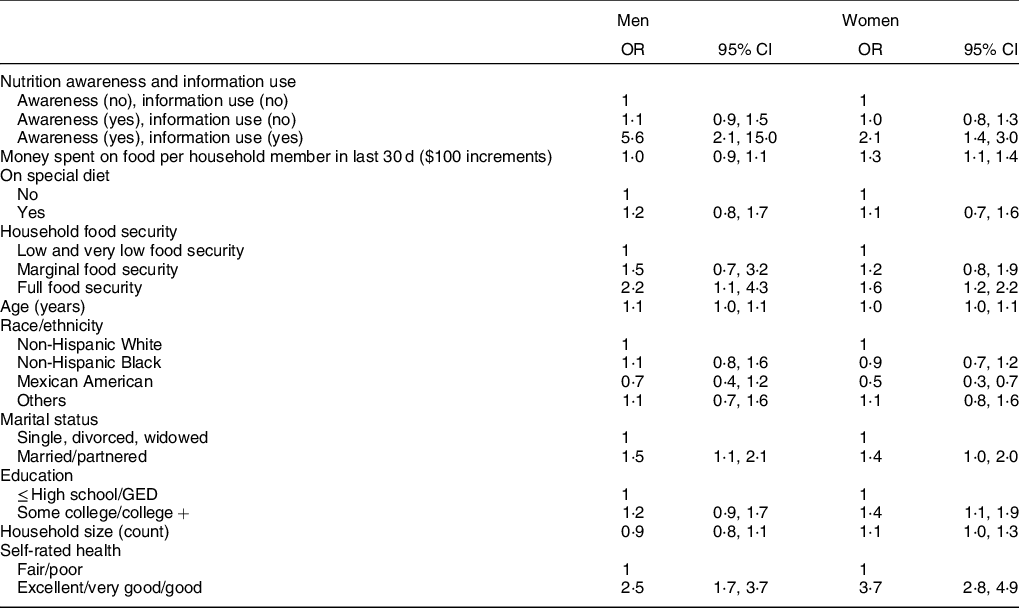
NHANES, National Health and Nutrition Examination Survey; GED, General Education Development.
* Multivariate adjusted logistic regression models accounting for complex survey design in NHANES.
Discussion
This is one of the few nationally representative studies, to our knowledge, that has investigated the diet quality of older adults and its association with awareness and use of nutrition information, as well as other factors that may influence food access and choices. The results show that older adults who reported awareness of MyPyramid or MyPlate, the US tools for educating the public on the DGA, had diets that were closer to meeting these guidelines, as measured by the HEI. This effect was independent of potential confounders in women. These results suggest that interventions that are effective at improving nutrition knowledge may have a direct and positive effect on dietary habits. Awareness and use of nutrition information had an even stronger association with diet quality, and this relationship was significant for both men and women when controlling for confounders. Education programmes that go beyond increasing awareness to coaching people on how to implement their knowledge may result in larger improvements in dietary habits.
Participants who had no awareness of MyPlate and MyPyramid had significantly lower scores for most HEI components. Our findings corroborate those of a 2019 study showing that adults aged 50 years and older who reported use of MyPyramid or MyPlate had beneficial dietary intake behaviours with regard to certain nutrients and recommended food pattern equivalents(Reference Schwartz and Vernarelli19). These studies cannot be directly compared because the 2019 study combined those who were not aware of the tools with those who were aware of them but did not use them, and it did not include the HEI as a measure of diet quality. However, both studies show a trend towards better diet quality for those with more familiarity with MyPlate and MyPyramid. In our study, these differences in total scores were driven by significantly lower component scores for total fruit, whole fruit, total vegetables, whole grains, seafood and plant proteins, and energy from solid fats, sugar and alcohol in those who were not aware of MyPlate and MyPyramid. These first five HEI components represent food groups that typically cost more money, and foods containing solid fats and sugar often come from less costly foods. It is possible that the differences in these component groups are driven by both a combination of decreased knowledge about what makes a nutritious diet and the relatively lower socio-economic status of those who are lacking in this knowledge. These are the factors that remained significant predictors in multivariate models, accounting for the effect of covariates.
Those who were women, employed, food secure, younger, more educated, higher income or of White race/ethnicity were more likely to report awareness of MyPlate or MyPyramid. These results are consistent with previous research showing that female sex, higher socio-economic status and higher educational attainment are the factors associated with nutrition-related knowledge, as measured by validated assessment(Reference Wardle, Parmenter and Waller15,Reference Hendrie, Coveney and Cox20,Reference Jackey, Cotugna and Orsega-Smith49) . Those more likely to report use of nutrition information were also younger, women, college-educated and of higher socio-economic status. Except for younger age, these characteristics are also associated with better diet quality in the literature(Reference Atkins, Ramsay and Whincup50–Reference Hiza, Casavale and Guenther53), as well as with better HEI scores in the results of this study. Lower nutrition awareness in racial and ethnic minorities and those of lower socio-economic status mirrors the well-researched health inequities that exist in the USA(Reference Keppel54,Reference Braveman, Cubbin and Egerter55) . Addressing the social determinants of these disparities is imperative for improving not only access to nutrition information, but also the health of the country as a whole. Another characteristic associated with a lower likelihood of nutrition awareness is participation in food assistance programmes, such as receiving emergency food, home-delivered meals or congregate meals, or using SNAP in the last 12 months. Although many of these food assistance programmes, such as SNAP, have a nutrition educational component(56), it is not mandatory and may not be well-targeted nor sufficiently used by the target population. Nutrition awareness and opportunities for education should be investigated further for older adults receiving food assistance, as this population is already economically and nutritionally vulnerable(Reference Leung, Ding and Catalano52,Reference Hilmers, Chen and Dave57,Reference Lee, Shannon and Brown58) . Research has shown that nutrition education interventions can decrease nutritional risk in individuals receiving home-delivered meals(Reference Wunderlich, Bai and Piemonte59). The existing relationship with a nutrition programme provides a channel for passing on information, which may be valuable to nutrition educators who wish to improve the diets of older adults.
Previous studies suggest that the relationship of living situation and diet quality in older adults differ based on demographic characteristics such as gender and race/ethnicity(Reference Davis, Murphy and Neuhaus60–Reference Bloom, Edwards and Jameson62). Some indicate that the relationship between living alone and poorer diet quality is particularly strong in men(Reference Atkins, Ramsay and Whincup50,Reference Conklin, Forouhi and Surtees61) , but we did not find this relationship in our data when controlling for covariates. Studies also report that older adults living with a spouse or partner have higher diet quality compared with those living alone, and also when compared with those living in households with people other than their spouse(Reference Davis, Murphy and Neuhaus60,Reference Chang and Hickman63) . In our study, being married was associated with better self-rated diet quality for both men and women, but there was no relationship between marital status and HEI score. One household characteristic that was an important predictor of diet quality was food security: in the multivariable analyses, household food security had a strong positive association with both total HEI scores and self-rated diet quality in women and with self-rated diet quality in men. Some studies have found no relationship between food security and diet quality in older adults when controlling for covariates(Reference Deierlein, Morland and Scanlin64,Reference Champagne, Casey and Connell65) , and it is possible that this is because they combined men and women in these analyses. More research is necessary to understand the impact of food security on diet quality, differences by gender and the mechanisms behind any differences that exist.
In the multivariable logistic models, the predictors of self-rated diet quality were similar to the predictors of HEI for both men and women; however, race/ethnicity behaved differently. The ‘other’ race/ethnicity group had higher HEI scores compared with non-Hispanic Whites, but this relationship did not exist in association with self-rated diet quality. This suggests that certain racial and ethnic groups in this age category may have healthy traditions and habits that they do not themselves equate to diet quality, but nevertheless are resulting in a higher HEI score. Similarly, a study of adults in NHANES showed that Mexican Americans did not differ in measured diet quality across levels of self-rated diet quality, while in non-Hispanic Whites and Blacks, self-rated diet quality was associated with measured diet quality(Reference Powell-Wiley, Miller and Agyemang33). Continued research is necessary to understand how different groups define diet quality, the possible influence of cultural values and perceptions, and the impact on the use of self-rated diet quality as a proxy for measured diet quality within these groups.
The current study shows important differences between older men and women in the USA with regard to economic factors, nutrition awareness and diet quality. The analysis showed that women may be more vulnerable than men, especially economically. Men in this cohort were more likely to be employed, had higher incomes and were more food secure. Despite being more socio-economically disadvantaged, usually a characteristic associated with poorer diet quality(Reference Atkins, Ramsay and Whincup50–Reference Hiza, Casavale and Guenther53,Reference Hilmers, Chen and Dave57) , women had higher HEI scores. Notably, women were also more educated and were more likely to report nutrition awareness and use of nutrition information, suggesting that although they may not have the socio-economic resources associated with diet quality, nutrition information may empower them to make healthier dietary decisions. Previous studies in younger adults found that nutrition knowledge mediated the relationship between socio-economic status and diet quality(Reference Beydoun and Wang66,Reference McLeod, Campbell and Hesketh67) . Although continued work must be done to address the systemic inequities that predispose some groups to health and nutrition challenges(Reference Baum and Fisher68), nutrition education may serve as a tool for ameliorating the impacts of these challenges. This effect must be further explored in older adults, as nutrition interventions may be a viable and efficient option for improving diet quality and nutrition-related outcomes in those of lower economic means. The MyPlate and MyPyramid are evidence-based nutrition education tools that are readily available to nutrition and public-health professionals.
A strength of the current study is the large data set from a nationally representative sample of older adults, a less studied demographic. However, the current study has limitations inherent in all observational research. Data used to determine diet quality were obtained by using 24-h dietary recalls, which rely on self-report and may not represent typical intake. However, this is the only currently available scoring method for obtaining HEI scores at the individual level when more than one 24-h recall is available. Since the method is not based on usual intakes, these scores may be biased to the extent that the dietary recall data of the component are biased. In addition, because the current evidence is cross-sectional, a causal link between the characteristics reported in the current study and diet quality cannot be established. Even though models were adjusted for covariates in an attempt to remove influence from potential confounding, there could still be residual confounding. Despite these limitations, no known studies have examined awareness and use of nutrition information in relation to dietary quality in a representative sample of the US older adult population.
Conclusions
Nutrition awareness is significantly associated with diet quality in the US older adult population, with stronger associations in those who also report use of this information. Additionally, certain segments of this population have limited nutrition awareness (men, non-Whites, those with lower education and lower socio-economic status and those participating in nutrition assistance programmes). These segments of the population may benefit from nutrition education, which is a relatively low-resource, readily available intervention.
Acknowledgements
Acknowledgements: The authors would like to acknowledge Anne Brown Rodgers, USDA consultant, for her valuable editing of the manuscript. We have received permission from Ms. Rodgers to be acknowledged in the paper. Financial support: This work was supported by the USDA Agricultural Research Service Cooperative Agreement (grant #USDA-58-1235-3-122). Conflicts of interest: None. Authorship: N.R.S., A.V., E.W. and A.M. developed the concept and design of the study. E.W. analysed the data. E.W., A.V. and N.R.S. wrote the first draft. All authors reviewed and commented on subsequent drafts of the manuscript. Ethics of human subject participation: The NHANES is conducted according to the guidelines laid down in the Declaration of Helsinki, and all procedures involving research study participants were approved by the National Center for Health Statistics Ethics Review Board. Written informed consent was obtained from all participants.


