


Body image is a multidimensional construct that involves self-perception (picture created in one’s mind regarding the size and shape of one’s body) and attitudes (thoughts, feelings and behaviours). Thus, body image has two main components: the degree of accuracy regarding the perception of body size and the subjective level of (dis)satisfaction with one’s body and appearance, which involves beliefs and emotions(Reference Slade1,Reference Pereira, Oliveira and Zollner2) . Body weight self-perception is the level of agreement between an individual’s perceived weight status and actual weight(Reference Rahman and Berenson3). Understanding this level of agreement among adolescents may provide important information regarding health behaviours and psychosocial characteristics in this population(Reference Bodde, Beebe and Chen4).
Adolescence is characterised by biological, cultural and complex hormonal changes that interact with environmental factors(Reference Chulani and Gordon5,6) . Adolescents experience pressures and concerns regarding weight-related issues, such as losing weight or gaining muscle, as well as influences from parents, peers and social media that may be related to an unhealthy body image and weight status(6–Reference Voelker, Reel and Greenleaf8). Sedentary behaviours, such as watching television or playing computer/video games, are associated with unfavourable body composition, low self-esteem, higher depressive symptoms, decreased fitness and lower perceptions of self-worth(Reference Tremblay, LeBlanc and Kho9), and higher risk for physical and psychological poor health(Reference Añez, Fornieles-Deu and Fauquet-Ars10). Reducing the amount of time adolescents engage in screen-based sedentary behaviours may improve dietary behaviours, prevent obesity and body dissatisfaction and promote critical reflections on body ideals in the media(Reference Suchert, Hanewinkel and Isensee11).
The Brazilian National School Health Survey (PeNSE) (2015) conducted in capital cities and the Federal District revealed that 84·1 % of adolescents between 13 and 17 years of age considered their body image important or very important, showing concern for their appearance(6). In previous studies, weight perception has been associated with the BMI, gender, age, lifestyle behaviours, income, education and race(Reference Xu, Greaney and Cohen12,Reference Paeratakul, White and Williamson13) . Weight misperception among adolescents may exert an influence on unhealthy behaviours and trigger body dissatisfaction, a lack of interest in adopting physical activities and healthy habits, demotivation, depression, the development of various eating disorders and the perception of risk and susceptibility for non-communicable diseases (NCD)(Reference Jáuregui-Lobera, Conde and Rodríguez14–Reference Hernan, Versace and Laatikainen16). Individuals with excess weight are more likely to neglect their actual weight status or do not realise the hazard of obesity and the high risk for NCD(Reference Fang, Li and Ma17), as they do not seek a solution to a problem that they do not recognise exists. Weight perception should be part of lifestyle or healthful behaviour change(Reference Hassan, Ojo and Galusha18).
The aim of the present study was to evaluate weight misperception as well as associations between weight self-perception and socio-demographic characteristics, BMI, screen time, self-rated food quantity and diet quality, weekly frequency of breakfast consumption, and the consumption of healthy and unhealthy foods among adolescents aged 10–19 years of age who participated in a population-based survey. Weight misperception may predispose adolescents to the adoption of risky behaviours that are detrimental to physical and emotional health, and development of NCD, which is an important topic for investigation.
Methods
Study population
The data for the present study were obtained from the cross-sectional, population-based Campinas Health Survey (ISACamp) and Campinas Food Consumption Survey (ISACamp-Nutri). Data were collected from adolescents aged 10–19 years old – according to the definition of adolescence by WHO(19,20) – from non-institutionalised individuals residing in urban areas of the city of Campinas in the state of Sao Paulo, Brazil, from 2014 to 2016. The ISACamp was conducted to assess the population’s health status, chronic diseases, social inequality in unhealthy behaviours, morbidities and well-being. The ISACamp-Nutri was conducted to evaluate the profile of food consumption, social inequality in the dietary patterns and the nutritional status of the population.
The participants in the ISACamp were selected using probabilistic cluster sampling in two stages: census sector and home. In the first stage, seventy census sectors were selected with probability proportional to size (given by the number of homes counted in the 2010 census)(21). The sectors were ordered by the average income of the heads of the household and fourteen sectors were selected from each one of the five health districts of the city. A minimum sample size of 1000 adolescents of both sexes between 10 and 19 years was established considering the maximum variability for the frequency of the events studied (P = 0·50), a 95 % confidence level (z = 1·96), a sampling error between 4 and 5 %, and a design effect of 2. In the second stage, the number of homes needed to reach the minimum sample size was defined. After updates in the field of the census sectors that were drawn and the acquisition of an updated list of addresses, 3119 homes were selected for interviews with adolescents, assuming a non-response rate of 27 %, according to a previous survey performed with adolescent residents in Campinas. Thus, we drew a larger number of households due to the presence of the non-response rate in order to reach the minimum number of interviews. The final weight of the sample was obtained by multiplication from design weight, non-response weight and post-stratification weight.
During the first home visit (ISACamp), data were collected using a structured questionnaire organised in thematic blocks in the tablet (Samsung Galaxy, model GT-P5200), which had been tested in pilot study and was administered by trained interviewers. During the second home visit (ISACamp-Nutri), the interviewers returned to the homes of the same individuals, who were invited to participate in the nutrition survey. The Informed Consent Form was signed by adolescents aged 18 and 19 years and the parents or guardians for the participants under 18 years.
Study variables
Body weight self-perception was the dependent variable and was measured by the following question: In relation to your weight, do you consider yourself…?, with seven response options: ‘very thin’; ‘a little thin’; ‘thin’; ‘normal’; ‘as having a little excess weight’; ‘as having excess weight’; ‘as having very much excess weight’. ‘Very thin’, ‘a little thin’ and ‘thin’ were combined into the ‘thin’ category of self-perceived weight. ‘As having a little excess weight’, ‘as having excess weight’ and ‘as having very much excess weight’ were combined into the ‘excess weight’ category of self-perceived weight.
Independent variables
Socio-demographic characteristics are gender, age group (10–19 years of age based on the fact that most individuals between 10 and 14 years are at the onset or in the middle of puberty and most of those between 15 and 19 years have undergone puberty and are closer to adulthood) and schooling of head of household (0–4, 5–8, 9–11 and 12 or more years).
BMI was calculated by data on self-reported weight and measured height (weight (kg)/height2 (m)). The BMI for age cutoff points recommended by the WHO was used: underweight = BMI < 3rd percentile; normal weight = BMI ≥ 3rd percentile and ≤85th percentile; overweight = BMI > 85th percentile and ≤97th percentile and obesity = BMI > 97th percentile(Reference de Onis, Onyango and Borghi22). Several studies show that it is viable to use self-reported anthropometrics measurements in public health research as these correlate positively with objective measurements(Reference Pursey, Burrows and Stanwell23–Reference Aljadani26).
Screen time was obtained through the following questions ‘How much time in total do you spend watching TV on a weekday and a weekend day?’ and ‘How much time in total do you spend on the computer on a weekday and a weekend day?’. Screen time was categorised as ‘zero to two’, ‘three to four’ and ‘five or more’ hours a day.
Self-rated food quantity and diet quality were determined by the answers to the following questions ‘Do you think that you eat more than you should?’ (‘no’ or ‘yes’) and ‘How do you consider the quality of your diet? (‘very good or good’, ‘regular’, ‘poor or very poor’).
Weekly consumption frequency of breakfast (‘every day’ or ‘zero to six times a week’), healthy foods (fruits, raw vegetables and milk) and unhealthy foods (soft drinks, cookies/crackers and snacks) categorised as ‘zero to two’ and ‘three or more’ times a week.
Statistical analysis
The association between weight self-perception and BMI was determined using Pearson’s χ 2 test with a 5 % significance level. The proportions of weight self-perception according to the selected features were estimated and associations were determined using Pearson’s χ 2 test with a 5 % significance level.
OR and 95 % CI of weight self-perception were estimated using multinomial logistic regression analysis. In the current analysis, groups that considered themselves thin or as having excess weight were simultaneously compared with the reference category (i.e., group that considered their weight normal).
Variables with a P-value < 0·20 in the bivariate analysis (relation between an independent variable and the dependent variable) were included in the final model: gender, schooling of head of household, BMI, eat more than should, self-rated diet quality, weekly intake frequency of breakfast, fruits, soft drinks, cookies/crackers and snacks. The P-value <0·20 was adopted to expand the inclusion of potential confounding factors in the model. Variables with a P-value <0·05 in the adjusted analysis remained in the final model. The Hosmer–Lemeshow test was used to verify the goodness of fit of the multinomial logistic regression model.
The interviews were entered using a mask developed in the EpiData version 3.1 (Epidata Assoc.). The statistical analyses were conducted using the survey module of the Stata program, version 14.0 (Stata Corp.), which incorporates complex sampling design.
Results
Among the 1023 adolescents included in the ISACamp (first home visit), 109 (10·6 %) did not participate of the ISACamp-Nutri (second home visit) due to refusals or losses to follow-up. Among the 914 individuals who answered the nutrition questionnaire, three did not have complete data. Therefore, 911 adolescents aged 10–19 years (mean age: 14·6 years (95 % CI 14·4, 14·8)) were analysed. Significant differences were found between the weight self-perception and gender (P < 0·01), but not between the weight self-perception and age (P = 0·4448).
The study population was composed predominantly of male adolescents (51·3 %), individuals aged 15–19 years (52·6 %), those from families in which the head of the household had up to 8 years of schooling (53·1 %), adolescents with underweight or normal weight (66·0 %) and those with screen time of five or more hours per day (57·1 %). Most reported not eating more than they should (64·9 %) and that the quality of their diet was very good or good (57·2 %). Most consumed breakfast daily (63·4 %) and consumed fruits (63·7 %), raw vegetables (58·1 %), milk (68·7 %), soft drinks (50·6 %) and cookies/crackers (55·4 %) three to seven times per week. A low consumption frequency of zero to two times per week was only found for snacks (73·3 %).
By analysing BMI and weight self-perception, a higher percentage of adolescents with overweight/obesity did not evaluate their weight properly (47·7 %, of whom 4·0 % perceived themselves as thin and 43·7 % perceived themselves as normal), followed by individuals in the ideal weight range (36·5 %, of whom 25·3 % considered themselves to be thin and 11·2 % considered themselves as having excess weight) and underweight individuals (36·1 % self-perceived themselves as having normal weight) (P < 0·01, Table 1).
Table 1 Percentage of nutritional status according to weight self-perception in adolescents aged 10–19 years. Campinas Health Survey and Campinas Food Consumption Survey (ISACamp and ISACamp-Nutri, Brazil, 2014/2016)
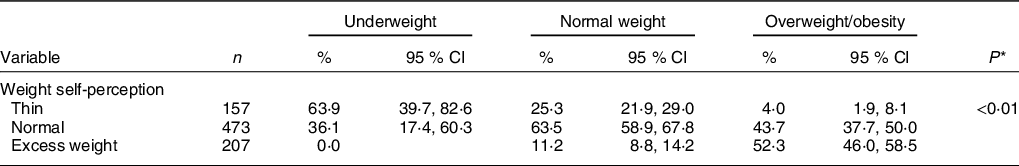
n, number of individuals in the unweighted sample; %, Percentage in the weighted sample.
* P-value from Pearson’s χ 2 test.
A significant difference in body weight self-perception was found between genders (P < 0·01), as more girls than boys perceived themselves as having excess weight (59·4 % (95 % CI 52·0, 66·3) v. 40·6 % (95 % CI 33·7, 48·0)). In contrast, no significant associations were found with the other socio-demographic characteristics, such as age (P = 0·44) or schooling of the head of the household (P = 0·15) (Table 2).
Table 2 Percentage of weight self-perception according to socio-demographic characteristics of adolescents aged 10–19 years. Campinas Health Survey and Campinas Food Consumption Survey (ISACamp and ISACamp-Nutri, Brazil, 2014/2016)
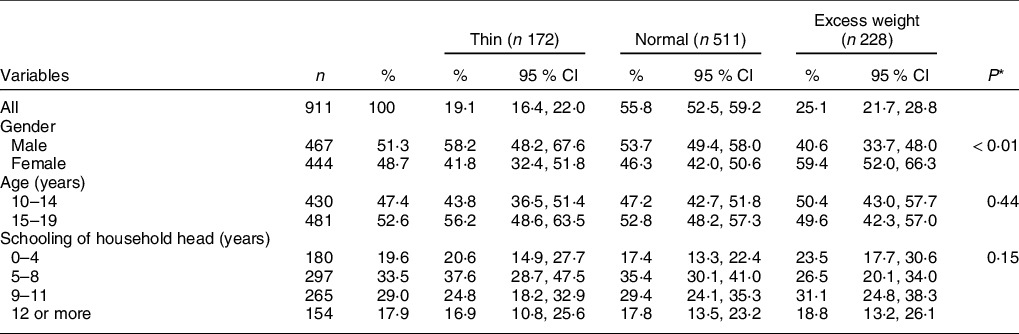
n, number of individuals in the unweighted sample; %, percentage in the weighted sample.
* P-value from Pearson’s χ 2 test.
Significant associations were found between weight self-perception and BMI status, thinking that one eats more than one should, and self-rated diet quality (P < 0·01). Screen time (P = 0·31) was not significantly associated with weight self-perception. A total of 7·1 and 26·5 % of adolescents considered themselves as being thin and having normal weight, respectively, but their nutritional status was classified as overweight or obesity (Table 3).
Table 3 Percentage of weight self-perception according to BMI, screen time, self-rated amount eaten and diet quality in adolescents aged 10–19 years. Campinas Health Survey and Campinas Food Consumption Survey (ISACamp and ISACamp-Nutri, Brazil, 2014/2016)
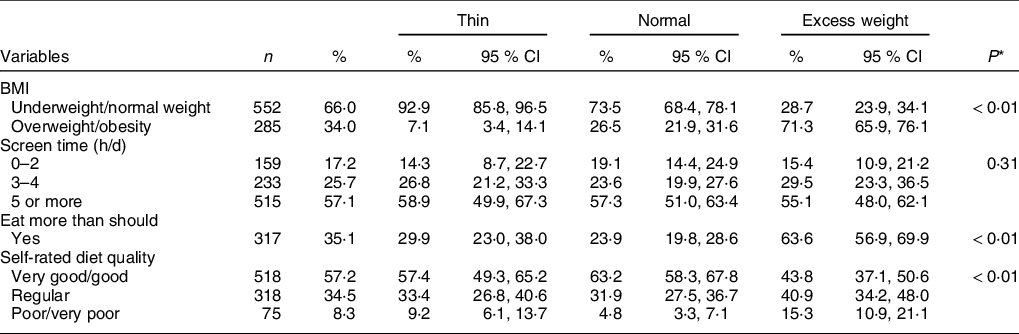
n, number of individuals in the unweighted sample; %, percentage in the weighted sample.
* P-value from Pearson’s χ 2 test.
Significant associations were found between body weight self-perception and weekly consumption frequency of breakfast, soft drinks, cookies/crackers and snacks (P < 0·01), whereas no significant associations were found regarding the weekly consumption frequency of fruits (P = 0·13), raw vegetables (P = 0·49) or milk (P = 0·20). Individuals who considered themselves as being thin had a higher intake (three to seven times/week) of soft drinks and cookies/crackers, compared with those who perceived themselves as having normal weight and those who perceived themselves as having excess weight (Table 4).
Table 4 Percentage of weight self-perception according to weekly frequency of breakfast and consumption of healthy and unhealthy foods in adolescents aged 10–19 years. Campinas Health Survey and Campinas Food Consumption Survey (ISACamp and ISACamp-Nutri, Brazil, 2014/2016)
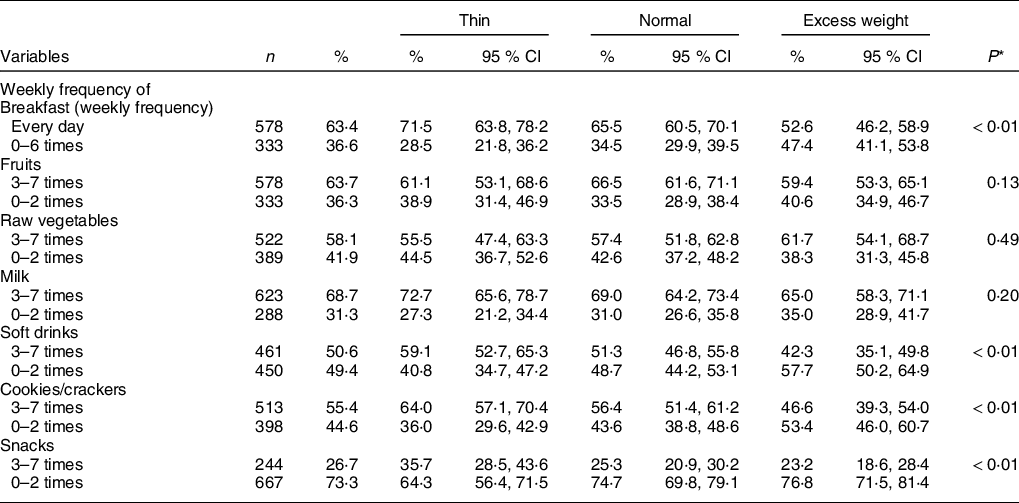
n, number of individuals in the unweighted sample; %, percentage in the weighted sample.
* P-value from Pearson’s χ 2 test.
The results of the multinomial logistic regression analysis (Table 5) revealed that a lower self-perception as being thin among female adolescents (OR: 0·65, 95 % CI 0·43, 0·97), those classified with overweight/obesity (OR: 0·18, 95 % CI 0·08, 0·39) and those who did not consume breakfast daily (OR: 0·63, 95 % CI 0·43, 0·94). Adolescents who considered the quality of their diet as being poor or very poor (OR: 2·09, 95 % CI1·01, 4·34) and those who ate snacks three to seven times per week (OR: 1·64, 95 % CI 1·03, 2·62) were more likely to have a self-perception of being thin compared to those with self-perceived normal weight. Conversely, a self-perception as having excess weight was more frequent in girls (OR: 2·15, 95 % CI 1·42, 3·26), individuals classified with overweight/obesity (OR: 7·45, 95 % CI 5·14, 10·80), those who thought they ate more than they should (OR: 5·08, 95 % CI 3·32, 7·77) and those who considered their diet quality as being poor or very poor (OR: 3·19, 95 % CI1·53, 6·64). Moreover, the self-perception of having excess weight was lower among those who ate cookies/crackers and snacks three to seven times/week, respectively (OR:0·64, 95 % CI 0·42, 0·98 and OR: 0·65, 95 % CI 0·44, 0·97).
Table 5 Multinomial logistic regression analysis* of factors associated with self-perception of body weight in adolescents aged 10–19 years. Campinas Health Survey and Campinas Food Consumption Survey (ISACamp and ISACamp-Nutri, Brazil, 2014/2016)
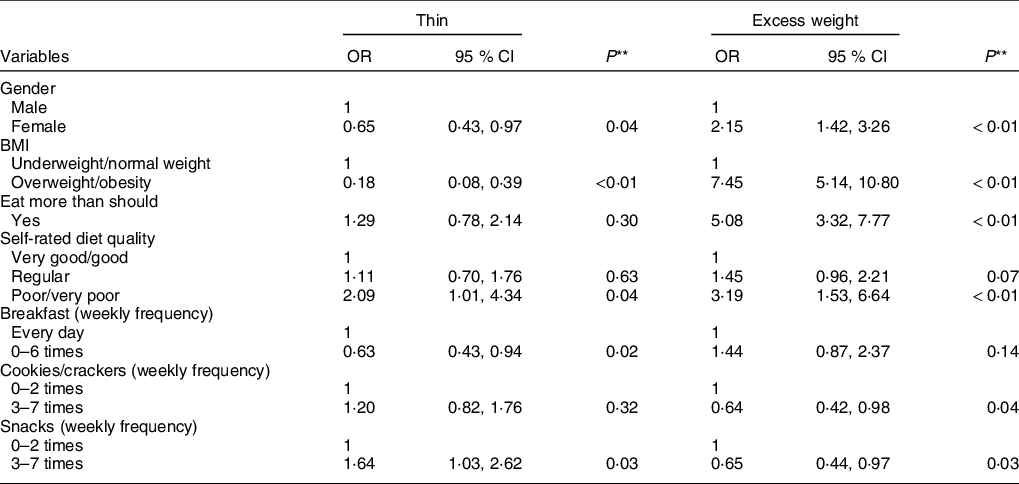
* Hosmer–Lemeshow test: P = 0·1483.
** P-value from Wald’s test. Variables incorporated into model: gender; schooling of head of household; BMI; eat more than should; self-rated diet quality; breakfast; fruits; soft drinks; cookies/crackers and snacks.
Discussion
Among the adolescents evaluated, nearly half of those with overweight/obesity underestimated their weight. Furthermore, 36·5 % of those with normal weight and 36·1 % of those with underweight also exhibited misperceptions regarding their weight. These figures are higher than those reported in a study conducted with individuals aged 7–18 years in Jilin City, China, in which 45·4 % of individuals with overweight underestimated their weight, 32·8 % with normal weight did not perceive their weight as normal and 22·2 % with underweight overestimated their weight (P < 0·001), demonstrating a discrepancy between BMI and body weight perception(Reference Wang, Liu and Wu27). Another cross-sectional study with 1643 Italian adolescents aged 11–16 years old found that both girls and boys with overweight and obesity underestimated their weight(Reference Buscemi, Marventano and Castellano28).
Weight underestimation among individuals with excess weight is generally associated with disinterest in adopting physical activity and healthy habits, possibly due to the lack of motivation related to weight loss(Reference Camacho, Lazo and Ríos29). Obesity affects physiological functions of the body and increases the risk for developing NCD, with negative impacts on quality of life and public health(Reference Chooi, Ding and Magkos30). Moreover, 80 % of obese adolescents will continue to be obese as adults(Reference Kostovski, Tasic and Laban31).
In the present study, 44·2 % of adolescents considered themselves as being thin (19·1 %) or having excess weight (25·1 %). Similar results were reported in a study conducted in the city of Pelotas, Brazil(Reference Araújo, Dumith and Menezes32) involving 4452 eleven-year-old adolescents, 19·0 % of whom perceived themselves as being thin or very thin and 25·0 % perceived themselves as having excess weight. Likewise, a study conducted in Seville, Spain(Reference Jáuregui-Lobera, Conde and Rodríguez14) involving 336 students with mean age of 12·46 ± 2·14 years found that 10·7 % deemed themselves to be thin and 23·3 % considered themselves to be overweight or obese.
In the present investigation, girls had a lower likelihood of perceiving themselves as being thin and a higher likelihood of perceiving themselves as having excess weight in comparison to boys. Godina and Zadorozhnaya(Reference Godina and Zadorozhnaya33) analysed adolescents of Russian and Kalmyk ethnicity aged 12–17 years and found that weight was the most important characteristic in body self-perception among girls, whereas height was the most important characteristic among boys. Indeed, studies report that boys are more likely to underestimate their weight status, whereas girls are more likely to overestimate it(Reference Jáuregui-Lobera, Conde and Rodríguez14,Reference Araújo, Dumith and Menezes32,Reference Lim and Wang34) . Females have been shown to control their own weight more, have a poor self-image, have a higher level of body dissatisfaction and be more critical than boys regarding self-perceived body weight, and this tendency increases with age(Reference Bucchianeri, Arikian and Hannan7,Reference Godina and Zadorozhnaya33,Reference McCabe, Ricciardelli and Banfield35) .
Adolescents generally have knowledge regarding food and that healthy eating involves consuming the right amounts in terms of balance and variety(Reference Croll, Neumark-Sztainer and Story36). Moreover, those with better eating behaviours are more likely to perceive themselves as having normal weight(Reference Marques, Naia and Branquinho37). In the present study, adolescents who considered themselves as having excess weight had a fivefold greater chance of thinking that they ate more than they should. Research conducted at a public school in the city of Juiz de Fora, Brazil, involving adolescents aged 15–19 years, found that all obese individuals and 50·0 % of overweight individuals declared that they ate in excess(Reference Vieira, Teixeira and Leite38). There is fairly consistent support for the association between obesity and ultra-processed food consumption. Such foods contain higher amounts of sugar, saturated fat, trans-fat, Na and energy density as well as lower fibre content, resulting in the potential for lower satiety and a higher glycaemic response. Furthermore, ultra-processed foods are highly palatable and packaged in large portions, which may promote overconsumption when compared with less processed foods(Reference Poti, Braga and Qin39).
In the present sample, 9·2 and 15·3 % of the adolescents who perceived themselves as thin and having excess weight, respectively, self-rated their diet quality as poor or very poor. A previous study involving 1139 students found that 43·0 % of adolescents without excess weight and 47·0 % with excess weight reported that their diet quality was poor (P = 0·40)(Reference Rodrigues, Gonçalves-Silva and Ferreira40).
Adolescents who have good eating practices are more likely to consume breakfast with the family several times a week or every day, have normal weight and have an accurate perception of their body weight(Reference Croll, Neumark-Sztainer and Story36,Reference Cai, Zhang and Ma41) . Skipping breakfast has been associated with weight management intentions, a higher likelihood of losing or gaining weight and a lower likelihood of maintaining one’s weight(Reference Raffoul, Leatherdale and Kirkpatrick42). In the present study, adolescents who did not eat breakfast every day had a lower likelihood of perceiving themselves as thin. A previous study found that adolescents who skipped breakfast (v. non-breakfast skippers) were more likely to perceive themselves as underweight, overweight or very overweight (v. normal weight)(Reference Raffoul, Leatherdale and Kirkpatrick42). Moreover, skipping breakfast has been associated with increases in the risk of overweight/obesity and BMI(Reference Camacho, Lazo and Ríos29).
The 2009 Korea Youth Risk Behaviour Web-Based Survey involving 72 399 adolescents aged 12–18 years found that those who underestimated their weight were more likely to have unbalanced eating patterns, including the consumption of snacks, sweetened beverages and fast food(Reference Lim and Wang34). In a study conducted in southern California, USA, individuals aged 13–19 years of age with daily consumption of junk food (cookies/cakes, salted snacks, regular sodas, hamburgers, etc.) had more frequent self-perceptions of being thin (57·6 %) and less frequent self-perceptions of being fit (49·1 %) and overweight (48·8 %) (P < 0·004)(Reference Gaylis, Levy and Hong43). In the present study, adolescents who consumed cookies/crackers and snacks three to seven times a week had a lower likelihood of perceiving themselves as having excess weight and for snacks, there was a higher likelihood of perceiving themselves as being thin in comparison to those who perceived their weight as being normal. Reverse causality may play a role, as individuals who perceived themselves as being thin did not worry about how often they snacked.
Poor dietary habits formed during adolescence frequently are carried into adulthood and likely affect future risk for excess weight, Fe deficiency anaemia, poor bone mineralisation, eating disorders and development of NCD (heart disease, osteoporosis, type 2 diabetes and cancer)(Reference Lytle44,Reference Larson and Neumark-Sztainer45) . In addition, a poor diet and low levels of physical activity during this life stage can have long-term consequences such as delayed sexual maturation, loss of final adult height and hyperlipidaemia(Reference Stanner46). Poor diet quality was also associated with declining psychological functioning and associated mental health problems(Reference Jacka, Kremer and Berk47).
Therefore, it is fundamental to teach and encourage healthy eating habits to children and adolescents, as such habits and customs may remain for a lifetime(Reference Silva, Teixeira and Ferreira48). Both diet quantity and diet quality are related to nutritional status. However, current eating patterns are low in fruit, vegetables and milk, involve a high intake of snacks/sweets (cookies, salty snacks and candies) and soft drinks, and often involve skipping breakfast(Reference Triches and Giugliani49). Paradoxically, the media promote a thin ideal body, especially for girls, and a muscular body for boys, which can affect an individual’s relationship with his/her own body(Reference Michels and Amenyah50,Reference Silva, Taquette and Coutinho51) . A study among adolescents found that each hour of screen time was associated with lower physical activity and higher BMI percentile, waist-to-height-ratio, body fat, waist circumference and poorer body image(Reference Suchert, Hanewinkel and Isensee11). Furthermore, media exposure encourages the consumption of ultra-processed foods, contrary to the recommendations of the Food Guide for the Brazilian Population (2014)(Reference Maia, Costa and Coelho52), and promotes negative social comparison among favourite characters in the media in relation to own body perceptions(Reference Eyal and Te’eni-Harari53). Individuals with weight misperception are more likely to experience adverse health outcomes compared to their peers with accurate perceptions regarding own weight status(Reference Lim and Wang34).
One of the weaknesses of the current study was the use of self-reported weight data to calculate BMI. The survey obtained self-reported information on both weight and height, but the participants’ height was also measured. Some studies have shown lower agreement between that reported and measured height than reported and measured weight, which leads to errors when classifying nutritional status(Reference Silveira, Araújo and Gigante54-Reference Del Duca, González-Chica and Santos56). Other studies have demonstrated a strong correlation between measured and self-reported weight (r = 0·99; P < 0·001)(Reference Davies, Wellard-Cole and Rangan57), supporting the use of self-reported weight data in cross-sectional studies. Moreover, a study that also evaluated adolescents of both genders residing in the city of Sao Paulo (near the city of Campinas and with a similar population as that of the present study) demonstrated a high correlation between self-reported and measured weight (r > 0·94)(Reference Carvalho, Piovezan and Selem58). In addition, Matthiessen et al. argued that, although these data may have some misclassification, the use of face-to-face interviews (as done in our study) was superior to questionnaire data(Reference Matthiessen, Biltoft-Jensen and Fagt59).
Another limitation of the current study is the cross-sectional design, which captures a specific period of a sample and does not enable the determination of the direction of the associations found. However, the data were obtained through a probabilistic population-based health survey that occurs periodically and enables the monitoring of body weight self-perception among adolescents. In addition, we did not collect Tanner staging value and we did not evaluate if stress can influence adolescents’ answers. Previous studies found a significant association between weight misperception and psychological distress in students. Thus, it is necessary to promote healthy lifestyle behaviours and to provide appropriate educational intervention which focus on improving weight perception of children and adolescents(Reference Lo, Ho and Mak60-Reference Riahi, Motlagh and Heshmat63).
In conclusion, we found that nearly half of the adolescents in Campinas, Brazil, perceived their weight as thin or excessive and those with overweight and obesity underestimated their weight. The female gender, overweight or obesity status, self-rated diet quality as poor or very poor, and a higher consumption of snack foods was associated with self-perceptions of both being thin and having excess weight. Not consuming breakfast on a daily basis was associated with self-perceptions of being thin. Moreover, eating more than one should and a higher consumption frequency of cookies/crackers were associated with self-perceptions of having excess weight. The present findings can help improve adolescent health by contributing information to programmes directed at preventing or treating weight misperception, reducing body dissatisfaction, adopting healthy lifestyle behaviours, achieving a healthy weight, as well as managing depression and eating disorders.
Acknowledgements
Acknowledgements: We would like to thank the Coordination for the Improvement of Higher Education Personnel (Coordenação de Aperfeiçoamento de Pessoal de Nível Superior/CAPES-Brazil, Finance Code 001) by Doctorate scholarship national (grant number 88882.434609/2019-01) and abroad (Doctoral Sandwich Program, grant number 88881.189502/2018-01) to MCS Martini, and the São Paulo Research Foundation (FAPESP-Brazil) for funding the projects Health Survey (process nº 2012/23324-3) and Food Consumption Survey of Campinas (process nº 2013/16808-7). Financial support: The projects Health Survey (process nº 2012/23324-3) and Food Consumption Survey of Campinas (process nº 2013/16808-7) were funded by São Paulo Research Foundation (FAPESP-Brazil). Conflicts of Interest: None of the authors have conflicts of interest. Authorship: M.B.A.B. and A.A.B.F. designed the study, elaborated the questionnaire and the funding acquisition. M.C.S.M. has reviewed the literature. M.C.S.M. and D.A. performed the data analysis and wrote the manuscript. J.M. and A.A.B.F. made the manuscript supervision. All authors reviewed and commented on subsequent drafts of the manuscript and approved it. Ethics of human subject participation: The current study was conducted according to the guidelines laid down in the Declaration of Helsinki and all procedures involving human subjects were approved by the Human Research Ethics Committee of the State University of Campinas (UNICAMP). Written informed consent was obtained from all subjects.


