Anemia or low Hb concentration in the blood is a major public health challenge, which has adverse health consequences, especially among children in low- and middle-income countries (LMIC)(Reference Kassebaum, Jasrasaria and Naghavi1,Reference McLean, Cogswell and Egli2) . Globally, anemia affects one-fourth of the population; the highest prevalence is among children younger than 5 years of age (47 %)(3). Nutritional deficiencies, including Fe deficiency anemia, contribute to an estimated 145 073 annual deaths among children globally(Reference Roser, Ritchie and Dadonaite4).
Childhood anemia is the manifestation of multiple underlying diseases that increases under-five mortality and morbidity in LMIC. Anemia in children can be influenced by several biological, aetiological, socio-demographic and genetic factors mainly include child sex, age, birth weight, parasites, history of recent infection, diarrhoea episode, dietary, parental education, nutrition, parity, household size, wealth index and residence(Reference Harding, Aguayo and Namirembe5–Reference Moschovis, Wiens and Arlington9). Anemia delays a child’s cognitive, physical, and motor development and increases susceptibility to infections and risk of perinatal mortality(Reference Balarajan, Ramakrishnan and Özaltin10–Reference Lozoff, Smith and Clark12). Therefore, the reduction of child anemia is imperative for saving millions of lives.
Among all forms of childhood malnutrition, anemia is one of them. Unlike child undernutrition, childhood anemia received less attention in global research and was not explicitly highlighted in global nutrition target agendas in the World Health Assembly goals(13). However, because of short- and long-term adverse health consequences, eliminating all forms of malnutrition, including anemia, by 2030 received special attention of global leaders and included in the Sustainable Development Goals (SDG) as a worldwide target (Target 2.2)(14). Awareness about anemia has increased in the past few decades(Reference Stevens, Finucane and De-Regil15). However, reducing child anemia warrants identifying vulnerable countries and subpopulations most at risk within those countries.
To date, very few studies have been conducted to evaluate overall and severe child anemia. These studies reported global and regional estimates of anemia prevalence(Reference McLean, Cogswell and Egli2,3) and their trends over time(Reference Stevens, Finucane and De-Regil15). Besides, prevalence and wealth-based inequalities in anemia have been explored across LMIC over time(Reference Yang, Liu and Zha16). Trend and projection analysis of childhood anemia at national and subpopulation levels are central to identifying key priority areas and the most vulnerable groups. However, these pieces of evidence are scarce in the current literature.
Furthermore, no studies have indicated the future directions of this indicator to assess countries towards eradicating child anemia. A comprehensive plan targeting the subgroup of vulnerable children is essential to meet the global target in eliminating childhood anemia by 2030. The paucity of evidence impedes evidence-based planning and design of future strategies for eliminating childhood anemia in LMIC.
Therefore, this study aims to update between- and within-country variations in the prevalence of anemia in children aged 6–59 months, and their temporal trends and future projections at national and subpopulation levels in LMIC.
Methods
Data and participants
We used repeated cross-sectional, large-scale, macro-level data from population-based nationally representative surveys conducted between 2000 and 2018 under the Demographic and Health Surveys (DHS) programme(Reference Rutstein and Rojas17). A detailed description of the survey year and study samples are presented in the supplementary (see online supplementary material, Supplemental Table S1). The DHS generally applies a uniform procedure using a multistage sampling technique to conduct the survey. The Inner City Fund (ICF) Institutional Review Board approved the DHS survey methodology and questionnaire, and all participants gave informed consent.
Measurements and setting targets
The participants of this study were children aged 6–59 months. Data were collected using standard procedures by trained medical personnel, and Hb was measured as previously described(18). Anemia was measured by altitude-adjusted Hb concentration and classified according to the WHO(19). According to the WHO cut-off, childhood anemia can be classified based on Hb level as mild (Hb level 10·0–10·9 g/dl), moderate (Hb level 7·0–9·9 g/dl), severe (Hb level < 7·0 g/dl) and total (Hb level < 11·0 g/dl)(19). Aligning with SDG Target 2.2 to eliminate all forms of malnutrition by 2030(14), we evaluated total anemia (not mild or moderate or severe anemia separately) to identify countries that are unlikely to eradicate anemia by 2030. We have set a target of reducing anemia in younger children (6–59 months of age) to ≤ 0·5 % by 2030 for calculating the probability of target achievement. Also, we identified countries with ‘no public health problem’ (< 5 % prevalence); ‘mild public health problem’ (5–19·9 % prevalence); ‘moderate public health problem’ (20–39·9 % prevalence) and ‘severe public health problem’ (≥ 40 % prevalence) according to the WHO(3).
Statistical analyses
We estimated the weighted prevalence of anemia with a 95 % confidence interval (CI) from the original survey data. We calculated the prevalence at national and across subgroups level in terms of child sex, residence, education of mother, age of mother and wealth quintiles constructed based on household assets by principal component analysis that the DHS provided with the survey data(Reference Rutstein and Johnson20). However, we categorised the education variable and classified the study population into two categories: below secondary (no education and primary) and secondary+ (secondary or higher) education. We restricted our analysis to country level but not at regional level due to two reasons. First, some regions (e.g. Central Asia) had data for a limited number of countries and heterogeneity between survey years (arbitrary). Second, we were interested in assessing progress across individual countries to implement country-level programmes and policies.
To examine trends, we considered thirty-six countries with data on child anemia for at least two DHS rounds. Bayesian linear regression models that used a Markov Chain Monte Carlo algorithm of multiple imputations for missing data were applied for trend and projection analysis from 2000 to 2018 and extended this trend analysis up to 2030 (Appendix S1). For each model, the first 5000 iterations were discarded as burn-in. We increased the number of iterations until the output was diagnosed as convergent. We reported 95 % credible intervals (CrI) drawn from 30 000 samples from the respective posterior distributions for each parameter. The intercept and covariate effect sizes were estimated using non-informative normal distribution priors with a mean 0 and very low precision (i.e. 0·0001). We used the same technique to examine trends in anemia rates across socio-demographic subpopulations to understand how the trends of anemia rates are changing across socio-demographic subpopulations. We used both trace plots and Gelman–Rubin diagnostic statistics to check parameter convergence using the value of the potential scale reduction factor (Appendix S1 and see online supplementary material, Supplemental Table S2). Notably, we did not provide estimates for the years below 2000 as only one country had data before 2000. We also validated our estimates drawn from regression models with those drawn from the original micro-data (see Appendix S1 and see online supplementary material, Supplemental Table S3).
Our analyses were performed in Stata (version 15.1) and R (version 3.5) statistical software.
Results
Sample characteristics
We included 776 689 children aged 6–59 months from 136 surveys in fifty-three LMIC. Overall, 48·8 % of children were female, 69·2 % resided in rural areas, 61·6 % had a mother with below secondary education and 23·8 % belonged to the poorest households (see online supplementary material, Supplemental Table S1).
Geographical variations
The prevalence of anemia in children varied between countries. Using the latest data available for each country, the prevalence of anemia in children was > 20 % in fifty-two out of fifty-three countries. The highest prevalence of anemia in children was in Burkina Faso in 2010 (87·8 %, 95 % CI 86·9–88·9 %) and lowest in Armenia in 2016 (15·9 %, 13·9–18·2 %) (Fig. 1). The prevalence of anemia in children varied across socio-demographic subpopulations. The prevalence of anemia was highest among both poorest (91·0 %, 88·5–93·0 %) and richest (77·5 %, 72·5–81·9 %) in Yemen in 2013, among urban (81·7 %, 78·1–84·9 %) in Yemen in 2013, among rural (90·0 %, 89·0–90·9 %) in Burkina Faso in 2010, among below secondary educated mother (88·7 %, 87·8–89·6 %) in Burkina Faso in 2010, among secondary+ educated mother (81·9 %, 77·0–86·0 %) in Yemen in 2013, among children of the adolescent mother (95·0 %, 90·4–97·5 %) and adult mother (87·6 %, 86·6–88·5 %) in Burkina Faso in 2010, and among male (88·7 %, 87·3–89·9 %) and female (87·1 %, 85·7–88·4 %) in Burkina Faso in 2010 (see online supplementary material, Supplemental Table S4 and Fig. 1).

Fig. 1 Prevalence of anemia in children aged 6–59 months in low- and middle-income countries during the latest DHS rounds. Values in the parenthesis denotes prevalence of respective country and survey year. ![]() , Among female;
, Among female; ![]() , among male
, among male
Trends and projections in child anemia
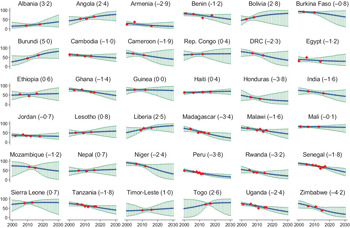
During 2000–2018, the prevalence of anemia in children was declining in twenty-two out of thirty-six countries, with the highest decline recorded in Zimbabwe (–4·2 %), Peru (–3·8 %) and Honduras (–3·8 %) (Fig. 2). During this period, anemia in children increased in fourteen countries, with the highest increase in Burundi (5·0 %), Albania (3·2 %) and Bolivia (2·8 %). If the current situation continues, it is projected that in 2030, the prevalence of child anemia will be ≥ 40 % in twenty-two of thirty-six countries, highest in Liberia (87·5 %, 95 % CrI 52·0–98·8 %), Bolivia (82·4 %, 13·2–99·9 %), Burundi (81·2 %, 44·3–97·4 %) and Sierra Leone (80·1 %, 16·8–99·4 %); and lowest in Armenia (13·0 %, 2·6–37·2 %), Peru (14·9 %, 6·2–28·4 %), Zimbabwe (17·5 %, 2·3–55·5 %) and Honduras (17·7 %, 0·6–71·3 %). The probability of target attainment in eliminating anemia in children is 0 % for almost all the study countries.

Fig. 2 Trends in the prevalence of anemia among children aged 6–59 months in low- and middle-income countries. Values in the parenthesis followed by the country name represents the average annual rate of change, calculated as: ln(rate in 2018/rate in 2000)/18. Rep Congo denotes the Republic of the Congo, DRC denotes the Democratic Republic of the Congo. ![]() , Predicted anemia;
, Predicted anemia; ![]() , credible interval for predicted anemia;
, credible interval for predicted anemia; ![]() , observed anemia
, observed anemia
Subpopulation variations
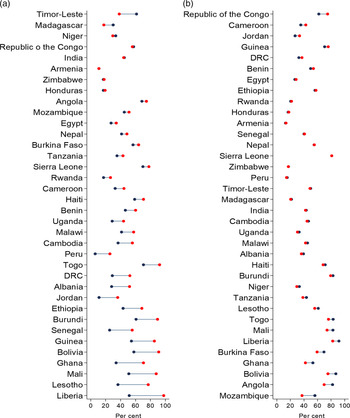
Trends in anemia in children varied across wealth quintiles. Among the poorest, the prevalence of child anemia decreased in twenty-three out of thirty-six countries with the highest decrease in Armenia (–4·1 %), while this prevalence increased in thirteen out of thirty-six countries with the highest increase in Liberia (6·9 %) during 2000–2018 (Fig. 3). At the same time, among the richest, twenty-six countries reduced child anemia with the highest reduction in Peru (–6·2 %) while child anemia increased in ten countries with the highest increase in Albania (3·9 %). Based on this trend, it is expected to have the highest prevalence of anemia in children among the poorest in Liberia (97·8 %, 95 % CrI 90·2–99·7 %) and among the richest in Togo (70·7 %, 7·0–99·5 %) in 2030 (Fig. 4). The probability of eliminating anemia is 0 % in both the poorest and richest children in almost all countries (see online supplementary material, Supplemental Table S5). We found similar results across the place of residence (see online supplementary material, Supplemental Table S6), mother’s education (see online supplementary material, Supplemental Table S7) and mother’s age (see online supplementary material, Supplemental Table S8). Projection analysis across subgroups also depicts that some countries will leave significant prevalence gaps in anemia in children between the poorest and richest (Fig. 5), rural and urban (Fig. S1), mother’s low and high education (Fig. S2), and mother’s adolescent and adult age (Fig. S3).

Fig. 3 Change rates of anemia among children aged 6–59 months in low- and middle-income countries by wealth quintiles and sex of children. DRC denotes the Democratic Republic of the Congo

Fig. 4 Trends in the prevalence of anemia among children aged 6–59 months in low- and middle-income countries by wealth quintiles. DRC denotes the Democratic Republic of the Congo. ![]() , Among poorest;
, Among poorest; ![]() , among richest
, among richest

Fig. 5 Predicted gaps in the prevalence of anemia among children aged 6–59 months in low- and middle-income countries in 2030 by wealth quintiles (a) and sex of children (b). DRC denotes the Democratic Republic of the Congo.  , Richest;
  , poorest; , male; , female
Disparities in child anemia exist and will continue in many countries between male and female children (see online supplementary material, Supplemental Table S9). The prevalence of anemia is reducing in twenty-three countries among males and in twenty-two countries among females. We noted the highest reduction in Zimbabwe for both males (–4·2 %) and females (–4·2 %). The prevalence of anemia is expected to be highest in Liberia for both males (91·6 %, 95 % CrI 68·0–99·2 %) and females (82·3 %, 42·9–98·5 %) in 2030. All countries have a 0 % probability of eliminating anemia from male and female children by 2030 (see online supplementary material, Supplemental Table S9). Many of these countries are expected to leave significant prevalence gaps in males and females in 2030 (Fig. 5).
Changes in public health burden for childhood anemia
During the earliest DHS round, thirty out of thirty-six countries suffered from the severe burden of childhood anemia, while five experienced moderate and one experienced the mild level of childhood anemia burden. The severity of public health burden for childhood anemia shifted to moderate and mild levels in some countries later, with twenty-eight countries experienced severe anemia problem during the latest DHS rounds. It is projected that in 2030, 61·1 % of the study countries (twenty-two out of thirty-six countries) will bear a severe burden for childhood anemia (see online supplementary material, Supplemental Table S10). Like subgroup projections, the public health burden for childhood anemia varied across subgroups in terms of wealth quintile (see online supplementary material, Supplemental Table S11), place of residence (see online supplementary material, Supplemental Table S12), mother’s education (see online supplementary material, Supplemental Table S13), mother’s age (see online supplementary material, Supplemental Table S14) and child sex (see online supplementary material, Supplemental Table S15) as well.
Discussion
The reduction of anemia in children is critical for ensuring the best chance to start a healthy life. Our results indicated a considerable reduction of anemia prevalence in children aged 6–69 months in many LMIC during the last two decades. In contrast, several African countries experienced a growing burden of anemia that may continue. Our findings evident progress in reducing anemia and identified the role of social factors, including household wealth, residence, age and education of mother, and sex of the child. Disparities in child anemia across these equity dimensions are also predicted to continue.
Geographical variation in the prevalence of anemia among children is expectedly common(Reference Yang, Liu and Zha16). Also, Madagascar experienced a 3·4 % decline in the prevalence of anemia in children that is close to the earlier findings (3·98 % points decline)(Reference Yang, Liu and Zha16). A recent study reported the highest childhood anemia prevalence in Burkina Faso, which also showed the lowest anemia reduction rate (from 90 % in 1990 to 85 % by 2011)(Reference Stevens, Finucane and De-Regil15). The current finding also estimated slow progression in reducing child anemia in Burkina Faso during 2000–2018. However, these two studies’ change rates had negligible differences, likely due to the difference in periods and methodological perspectives.
Reduction of childhood anemia varied between countries and subpopulations within countries. While countries like Zimbabwe, Peru and Honduras have remarkably reduced anemia in children, some countries such as Sierra Leone, Mali and Timor-Leste showed steady anemia reduction. Notably between 2000 and 2018, some low to lower-middle-income countries such as Burundi, Bolivia and Albania have experienced an increasing rate of anemia among children, presenting as countries with significant challenges for achieving the global target of eradicating malnutrition. The upward trend of child anemia in such countries could be attributed to receiving inadequate diversified diets and less consumption of Fe-rich foods, resulting from intermittent Fe supplements due to lack of attention related to regular use of supplements(Reference Stevens, Finucane and De-Regil15,Reference Yang, Liu and Zha16,Reference Marn and Critchley21) . An increasing trend in child anemia in Bolivia is well aligned with a previous study(Reference Yang, Liu and Zha16). In 2006, Bolivia launched a national programme called Zero Malnutrition Program (ZM) to eliminate malnutrition. This multisectoral initiative was buttressed by political support and strengthened by design features that differed in important ways from similar efforts of the 1970s(Reference Hoey and Pelletier22). In the first 2 years of implementing health sector interventions, the ZM champions made considerable progress in reducing child malnutrition. Still, they struggled in building and sustaining the commitment of high-level political leaders, mid-level bureaucrats and local-level implementers in the majority of other sectors(Reference Hoey and Pelletier22). The high rate of child anemia in LMIC like Bolivia demands context-specific monitoring, evaluation and implementation of effective interventions to improve appropriate and adequate diet to high-risk populations for reducing anemia in children in LMIC.
Our analysis indicates that the highest reduction in the prevalence of childhood anemia occurred in Zimbabwe (–4·2 %) and Peru (–3·8 %) during 2000–2018. Previous studies reported Peru’s progress in childhood anemia reduction that may be attributed to maternal education on diet, water and sanitation hygiene(Reference Loret De Mola, Quispe and Valle23). However, Peru’s progress was not adequate for meeting the WHO cut-off(3). Peru has prioritised local policies towards anemia reduction and set its target from 43 % in 2018 to 19 % by 2021. The Peruvian Government has implemented a multisectoral strategy involving the social programme promoters and community workers(24) to achieve the target.
Our study identified more significant disparities in the prevalence of childhood anemia in terms of wealth and residence over time, with a greater proportion of poorest and rural children are suffering from anemia that is projected to continue. Our study also shows a greater disparity in child anemia by child’s sex in some countries (e.g. Mozambique, Angola and Bolivia) where male children experienced a higher rate of anemia prevalence than female children. This data-driven evidence demonstrates the need for population-specific interventions to address this high burden of anemia in countries with a greater burden.
Our study showed a severe burden of anemia in 83·3 % of countries during the earliest DHS rounds that reduced to 77·8 % of countries during the latest rounds and projected to persist this burden in 61·1 % of countries by 2030. These suggest that most countries remain far behind to achieve the global target of eradicating child anemia by 2030. A critical area for meeting the global anemia reduction target should include scalable strategies for delivering high-impact interventions supported by a concerted effort in sustained financial commitment in poorly performing countries, targeting the most disadvantaged groups under intervention. Globally, several strategies are being used for prevention and control of anemia, including improvement of fortified and diversified dietary intake, disease control such as malaria with insecticide-treated bed nets and antimalarial drugs, deworming and hand washing, and advancement of knowledge and education about anemia prevention for civil society and policy-makers(Reference Balarajan, Ramakrishnan and Özaltin10,Reference Duggan, Watkins and Walker25,Reference Ara, Khanam and Rahman26) . Such interventions should be scaled up in LMIC, targeting and prioritising households with pregnant women, lactating mothers and children with anemia(Reference De-Regil, Suchdev and Vist27,Reference Zlotkin, Christofides and Hyder28) . Implementation of home fortification intervention may improve children’s Fe intake and increase Hb concentration in the blood. Additionally, ensuring dietary diversity during pregnancy and lactation period may ensure healthy and non-anemic children.
Fe deficiency is assumed to be a primary cause of anemia. However, the aetiology of anemia varies significantly between regions, countries and within countries(Reference Magalhães and Clements29). Global data suggest that half of the anemia cases are caused by infectious diseases such as malaria, helminthic infestation, HIV to genetic causes like sickle cell traits and thalassemia(Reference Balarajan, Ramakrishnan and Özaltin10). African, Eastern Mediterranean and Southeast Asian countries are vulnerable to malaria and genetic predisposition to anemia(Reference Modell and Darlison30,Reference Piel, Patil and Howes31) . The tropical regions, particularly some areas of Asia and Africa, are experiencing anemia mostly from hookworm infestation and schistosomiasis due to poor water, sanitation and hygiene(Reference Smith and Brooker32,Reference Brooker33) . Thus, anemia reduction strategies should incorporate context-specific interventions, including insecticide-treated bed nets(Reference Korenromp, Armstrong-Schellenberg and Williams34,Reference Tokponnon, Ogouyémi and Sissinto35) , deworming(Reference Brooker33), safe water supply and improved personal hygiene where appropriate. Our study further suggests expanding these strategies in all LMIC targeting the vulnerable groups to reduce such a high burden of anemia.
This study’s major strength is the use of a population-based nationally representative sample covering both rural and urban areas in fifty-three LMIC. The use of a unique methodology allows cross-country comparison of estimates. However, fewer data points created wider CrI for the projected estimates for some countries (e.g. Bolivia). Indeed, wider CrI are normal for projection analysis and smaller for countries with larger data points (e.g. Jordan). Estimates drawn from representative data collected from multiple sources may better predict childhood anemia with lower uncertainty. Due to the methodological perspective, we could not adjust childhood morbidity, dietary diversity and anthropometry while assessing trends and projections of child anemia.
Overall, childhood anemia tends to decline in many settings. Despite the reduction, more than half of the study countries are currently bearing > 40 % of children with anemia with substantial within-country prevalence gaps across wealth and maternal age. None of the study countries is expected to eradicate child anemia by 2030. These findings demonstrate the need for implementing effective interventions targeting subgroups in each country at greater risk. Strengthening joint efforts of country leaders, agencies and donors may help integrate policies to coherently address the burden of childhood anemia effectively and equitably across LMIC.
Acknowledgements
Acknowledgements: This research is supported partially by the Australian Government through the Australian Research Council’s Centre of Excellence for Children and Families over the Life Course (Project ID CE200100025). We thank the Demographic and Health Survey programme for providing access to the datasets. We gratefully acknowledge the commitment of the Australian Government and the University of Queensland, Brisbane, QLD, Australia, to their research efforts. To undertake the PhD degree, MMH is supported by the ‘Research Training Program’ scholarship jointly funded by the Commonwealth Government of Australia and the University of Queensland, Brisbane, QLD, Australia. Financial support: This research received no external funding. Conflict of interest: None declared. Authorship: M.M.H. conceptualsed the study and conducted data acquisition, data analysis, interpretation of the findings, and drafting the manuscript. R.J.S.M., S.A. and A.A.M. helped in conceptualising the study and provided guidance. S.P., M.T. and Y.F. helped to interpret the results and contributed to drafting the manuscript. R.J.S.M., S.A., Y.F. and A.A.M. critically reviewed the analysis and final version of the manuscript. All authors made a thorough review of the final draft and approved it for submission. Ethics of human subject participation: This study was conducted by analysing secondary data. All the information in the data was de-identified and made publicly available by MEASURE DHS. The DHS survey methodology and questionnaire were reviewed and approved by the ICF Institutional Review Board. Upon taking informed consent, the DHS collected data from respondents, and our study uses this publicly available anonymous data.
Supplementary material
For supplementary material accompanying this paper visit https://doi.org/10.1017/S1368980021002482