


Nutrition knowledge is a construct that ranges from a basic understanding of nutrients in food to decisions regarding everyday food choices(Reference Worsley1–Reference Miller and Cassady3). The concept is multifactorial in its association with behaviour change and is impacted by environmental and intra-individual factors such as socioeconomic status, cultural background, age, living and working conditions(Reference Yahia, Brown and Rapley4–Reference Giskes, Kamphuis and van Lenthe7). Higher levels of nutrition knowledge have been associated with more frequent purchasing of healthy foods, increased consumption of fruit and vegetables, more nutritious food choices and a lower consumption of nutrient-poor, energy-dense foods(Reference Kolodinsky, Harvey-Berino and Berlin8–Reference Pollard, Miller and Daly12).
Nutrition programmes at population and community levels often focus on the development of nutrition knowledge to influence dietary habits and behaviours(Reference Barreiro-Hurlé, Gracia and de-Magistris13,Reference Bottcher, Marincic and Nahay14) . Determining the effectiveness of these interventions requires a measurement of change in knowledge, which is most commonly assessed with a questionnaire. In order to be effective, a nutrition knowledge questionnaire needs to reflect current public health guidelines around dietary patterns and food beliefs that are targeted within an intervention(Reference Worsley1,15) . If the questionnaire fails to cover all aspects of nutrition knowledge, it is unlikely to be a valid measure, which can impact legitimacy of results when evaluating the effectiveness of these interventions, or identifying areas for further activity(Reference Hendrie, Coveney and Cox11). In turn, associations are more likely to be observed when using a thoroughly validated questionnaire(Reference Bradette-Laplante, Carbonneau and Provencher16).
In the UK, Parmenter and Wardle(Reference Parmenter and Wardle17) developed a standardised psychometrically valid and reliable questionnaire to test nutrition knowledge, the General Nutrition Knowledge Questionnaire (GNKQ)(Reference Parmenter and Wardle17). This questionnaire was specific to dietary recommendations within the UK at the time and did not have assumed validity outside of the student population or country in which it was validated. Over the ensuing 20 years, the GNKQ was subsequently validated in at least sixteen countries worldwide including the US, Turkey, Italy, Germany, Portugal, Brazil, South Africa and Lebanon(Reference Jones, Lamp and Neelon18–Reference Itani, Chatila and Dimassi25). In Australia, a modified version of this questionnaire was validated in 2008(Reference Hendrie, Cox and Coveney26). Changes in dietary guidelines and national nutrition messaging since the original publication of the questionnaire have resulted in the redevelopment and revalidation of the GNKQ in the UK in 2016(Reference Kliemann, Wardle and Johnson27).
Public health nutrition guidelines in Australia have also experienced change, with the National Health and Medical Research Council (NHMRC) releasing Nutrient Reference Values (NRV) in 2006, with subsequent revisions in 2017(28–30). The NRV underpinned revisions to the 2003 Dietary Guidelines for all Australians(31) in the form of the Eat for Health Australian Dietary Guidelines (ADG)(32) and supporting food selection guide, ‘Australian Guide to Healthy Eating’, in 2013(28). Changes to the nutrition landscape in Australia during this time included shifts in dietary patterns and the food supply as shown through the national nutrition survey(33), suggesting that Hendrie et al.’s(Reference Hendrie, Cox and Coveney26) validated questionnaire may no longer reflect contemporary nutrition knowledge and guidance in Australia(Reference Spronk, Heaney and Prvan35,Reference Ridoutt, Baird and Bastiaans36) .
A preliminary review of the literature indicated a lack of current, validated nutrition knowledge questionnaires for Australia since the Hendrie et al.(Reference Hendrie, Cox and Coveney26) questionnaire. Given the changes to public health nutrition guidelines and the nutrition landscape, a validated questionnaire to assess the outcomes and effectiveness of nutrition education strategies and programmes is needed. Therefore, the purpose of this study was to validate a contemporary nutrition knowledge questionnaire appropriate for an Australian audience.
Method
A stepwise approach was used in this study, with the research conducted in two phases. Phase 1 was a critique of current validated nutrition knowledge questionnaires, which informed phase 2, the development and validation of a revised Australian nutrition knowledge questionnaire.
Phase 1: critique of validated nutrition knowledge questionnaires
A literature review was undertaken in April 2018. This review aimed to determine the extent to which general nutrition knowledge questionnaires had been developed and validated internationally. The following search terms (‘nutrition knowledge’ and ‘question’ or ‘survey’ and ‘valid’) informed the literature search. Databases searched included ERIC, Web of Science, Scopus, Medline, PubMed, Cochrane, ProQuest and Science Direct. Any type of research study conducted on an adult population in the English language, with no date limitations, were included for review. Studies were excluded if they did not use a previously validated questionnaire as a basis for their study. Data on country, population, sample size and validation techniques from eligible studies were extracted. The articles were reviewed and critiqued by the research team to determine the most commonly used nutrition knowledge questionnaires and validation techniques that informed the development of a questionnaire for study 1.
Phase 2: study 1 – content validity
Participants
A convenience sample of fifteen academic dietitians at each university with a nutrition and dietetic academic programme, Australia-wide, were approached via e-mail.
Questionnaire design
An online questionnaire was developed for distribution based on nutrition knowledge questions derived from the literature review. Comparable items between identified questionnaires from the literature review were matched, and participants were asked to select and clarify the questions they preferred. Remaining items from the identified questionnaires were collated and participants were asked to identify inclusion or exclusion of the question with a rationale.
Analysis
The quantitative and qualitative data from participants were analysed by the first author. These results were then presented and discussed by all authors with reference to key Australian nutrition documents such as the ADG(32), NRV(28), Australian Food Composition Database(37), Australian Health Survey(38) and the Australian Dietary Guidelines Review of Evidence(39). An iterative process was used; if participant’s comments aligned with the key documents, suggestions were actioned accordingly and items that did not reflect contemporary Australian eating and public health messages were reviewed and updated accordingly. This questionnaire informed the basis for the next stage of validation in study 2.
Phase 2: study 2 – face validity
Participants
A convenience-based sample of twelve workers from a retail store in Brisbane were approached to complete the questionnaire online. The aim was to obtain the perspective of individuals aged ≥18 years, whose highest level of education was year 12 or equivalent, to determine the readability, ease of understanding and length of time taken to complete the questionnaires. Participants were offered a coffee voucher for participation.
Questionnaire design
The questionnaire developed in study 1 was reviewed by the participants who provided feedback through cognitive interviewing on their understanding of the questions, context, wording and readability of the overall questionnaire(Reference Willis40). These interviews took place in a location that was familiar and convenient to the participants and lasted between 15 and 30 min.
Analysis
Participant feedback was collated into a spreadsheet and reviewed by all authors. The recommendations from participants on the readability of the questionnaire were actioned accordingly. On completion, the questionnaire was distributed for validation.
Phase 2: study 3 – construct validity and test–retest reliability
Participants
University undergraduate students from any year studying either a nutrition and/or dietetics degree or an engineering degree were invited to participate in the study via a student website post or e-mail to determine construct validity and reliability of the questionnaire. It was anticipated that the nutrition/dietetic students would have higher levels of nutrition knowledge compared with the engineering students. The participants were given an opportunity to enter into a prize draw of four $50 vouchers as an incentive.
Questionnaire design
The online questionnaire developed from study 2 and additional questions to identify relevant demographics, course and year of study were distributed online over a 2-week period. All participants were invited to provide contact details and approached one week later to complete the questionnaire for test–retest reliability.
Analysis
Statistical analyses were undertaken using IBM SPSS Statistics, version 23. Participants’ responses were downloaded into a spreadsheet and coded for correct and incorrect responses. Statistics were run on each of the four questionnaire categories and the questionnaire as a whole, which included frequency of missing data, missing value patterns analysis and Little’s Missing Completely at Random (MCAR) test(Reference Ibrahim, Chen and Lipsitz41–Reference Fox-Wasylyshyn and El-Masri43). Data cleaning was then undertaken to remove invalid or incomplete responses, which were identified by cells that did not contain any data. Multiple imputation was undertaken using the Markov Chain Monte Carlo algorithm known as fully conditional specification(Reference Sterne, White and Carlin44–Reference Van der Heijden, Donders and Stijnen46).
Total and section scores were assessed for normality using Shapiro–Wilks statistic. Demographic information was analysed using χ 2 test to determine if there were any significant differences in characteristics between the cohorts at baseline. Descriptive statistics were used to describe the scores obtained by nutrition and engineering students to assess construct validity. Normally distributed data were reported using mean (±sd), and non-normal data using median (IQR). Independent samples t test for normally distributed data and Mann–Whitney U test for non-normally distributed data were used to determine if there was a statistically significant difference (P = 0·05) between responses by nutrition and engineering students. Internal reliability was analysed for the questionnaire, whereby a Cronbach’s α value >0·7 indicated high reliability(Reference Tavakol and Dennick47). Cronbach’s α was also analysed to determine which items, when removed, either improved or reduced the reliability of the questionnaire to highlight items valuable in measuring the construct of nutrition knowledge. Item discrimination was measured to indicate whether individual items are a good determinant of knowledge using item–total correlation >0·2, which indicates good correlation(Reference Kliemann, Wardle and Johnson27,Reference Field48) .
Test–retest reliability was measured using Pearson’s correlation coefficient for normally distributed data, Spearman rank-order correlation for non-normally distributed data and intraclass correlation coefficient. Overall, 0·7 and 0·75 are considered indicators of strong positive correlations and consistency and reliability, respectively(Reference Koo and Li49,Reference Ratner50) . Paired sample t tests for normally distributed data and Wilcoxon signed-rank tests for non-normally distributed data (P = 0·05 for statistically significant differences in mean or median between groups) are also reported.
A power analysis was conducted in GPower using a two-tailed test to determine a sufficient sample size, with α = 0·05, power = 0·8 and effect size (d) = 0·96. The desired sample size for the two groups was eighteen nutrition students and eighteen engineering students(Reference Hendrie, Cox and Coveney26,Reference Faul, Erdfelder and Lang51) .
Results
Questionnaire development
Twenty-eight validated nutrition knowledge questionnaires were identified in the literature; fifteen used the GNKQ in its Australian or UK form as a basis for their study, five used other questionnaires, five did not specify where they obtained their questions from, and three self-developed all the questions. Therefore, this literature review informed the extraction of three valid and reliable questionnaires that have been used most frequently and consistently by researchers worldwide(Reference Parmenter and Wardle17,Reference Hendrie, Cox and Coveney26,Reference Kliemann, Wardle and Johnson27) . The three questionnaires contained a similar structure, with items aligning to four sections of nutrition knowledge: dietary recommendations, sources of nutrients, food choices, and diet–disease relationship. The four sections were retained based on their relevance to assessing the construct of nutrition knowledge. A review of each questionnaire’s content found strong similarities between items, answer options and nutrition information presented in both Parmenter and Wardle(Reference Parmenter and Wardle17) and Kliemann et al.(Reference Kliemann, Wardle and Johnson27) questionnaires. To avoid repetitiveness and to include items that more accurately reflected the most current nutrition information, only questions from Hendrie et al.(Reference Hendrie, Cox and Coveney26) and Kliemann et al.(Reference Kliemann, Wardle and Johnson27) were included in this study. Refer to ‘study 1’ in Table 1 for the breakdown of questionnaire distribution.
Table 1 Number of questions and scores of the original questionnaires compared with the iterations in this study

* Study 1 was a combination of Hendrie and Kliemann (all questions were included in review).
† Final AUS-R NKQ.
Study 1: Content validity
Eight participants from the fifteen universities (n 8, 53 %) completed the preliminary questionnaire, which included participants from each Australian state with a nutrition and dietetic academic programme. The questionnaire consisted of ninety-three items across four sections, forty-five of which were recommended for inclusion, thirty-five for exclusion and thirteen did not reach consensus. A qualitative analysis was undertaken on items that were recommended for exclusion and lacked consensus, with common themes emerging such as items not reflecting current key nutrition documentation(28,32,37–39) relevant to an Australian audience, terminology not reflecting current Australian language and foods not reflecting the current Australian food supply. The forty-five items recommended for inclusion were categorised into the four sections used in Hendrie et al.(Reference Hendrie, Cox and Coveney26) and Kliemann et al.(Reference Kliemann, Wardle and Johnson27) questionnaires and allocated to a component within the key Australian nutrition documents. As per feedback, all demographic questions were sourced exclusively from the National Nutrition and Physical Activity Survey(34) and the Census of Population and Housing(52).
Where the quantitative and qualitative components were inconsistent or multiple questions were allocated to a single key nutrition message, the question was either removed or combined with other existing questions to form a single item addressing the topic. If there was not an appropriate question or answer options from the available pool to meet an aspect of the key nutrition documentation, other validated nutrition knowledge questionnaires were consulted. Nine questions from other validated questionnaires were included on topics such as breastfeeding(Reference Vijayapushpam, Menon and Raghunatha Rao53), food safety(Reference Byrd-Bredbenner, Wheatley and Schaffner54), menu and kilojoule reading(55), health star rating(Reference Parker, Souvlis and Parry Husbands56), sources of vitamins/minerals(Reference Lafave, Lafave and Nordstrom57) and foods high/low in added sugar(Reference Alsaffar58). Two questions were developed by the research team, on waist circumference(59) and water recommendations(32).
Overall, twenty-nine questions were retained from either Hendrie et al.(Reference Hendrie, Cox and Coveney26) or Kliemann et al.(Reference Kliemann, Wardle and Johnson27), nine questions were included from other questionnaires or online materials, and two questions were developed. Questions that did not originate from Hendrie et al.(Reference Hendrie, Cox and Coveney26) or Kliemann et al.(Reference Kliemann, Wardle and Johnson27) were specifically asked for comment by the retail workers in study 2. This informed the questionnaire that was distributed as part of study 2 (face validity), the breakdown of which can be seen under ‘study 2’ in Table 1.
Study 2: Face validity
Eleven of the twelve employees completed the questionnaire (n 11, 92 %). The participants described a lack of clarity regarding terminology for two concepts: the answer option ‘discretionary foods’ was removed and replaced with individual food items, and the definition of CVD was included. Foods that were not well understood or common in the Australian context included ‘mackerel’ (changed to ‘tuna’) and ‘bok choy’ (changed to ‘green leafy vegetables’). The wording of concepts was also adjusted to reflect participants’ understanding, such as reducing the range of answer options for food safety temperatures (six to five), including both cups and litres in the question on water consumption, and changing exclusive ‘breast milk’ to ‘breastfeeding’ as per the ADG recommendation. Please refer to ‘study 3’ under Table 1 to review the final questionnaire breakdown.
Study 3: Construct validity and test–retest reliability
Approximately 250 nutrition and 2500 engineering undergraduate students were approached, with 143 students accessing the questionnaire (response rate estimate 5 %). Responses were categorised as 0 = incorrect/not sure, and 1 = correct, and summed for each section. The questions and answer options are in the supplementary material, Supplemental Fig. 1. The total number of questions with maximum scores can be seen in ‘study 3’ in Table 1.
Frequency of missing data, missing value patterns analysis and Little’s MCAR test using expectation maximisation (EM) were undertaken. For sections 1 (P = 0·78), 2 (P = 0·78), 3 (P = 0·57) and 4 (P = 0·99), the results were non-significant, and therefore the missing data were completely at random. Respondents with >20 % of the data missing were removed (n 50), and multiple imputation was undertaken for random missing data(Reference Peng, Harwell and Liou60). Overall, forty-seven nutrition students and forty-six engineering students (n 93) had data eligible for analyses.
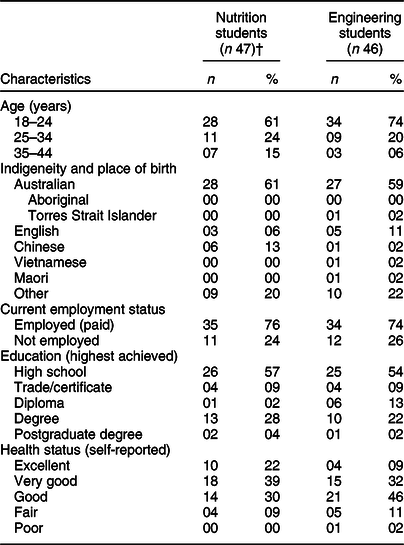
The demographic characteristics of participants are presented in Table 2. With the exception of the course of study (e.g. nutrition or engineering), no significant differences were noted between students across all categories (P > 0·05).
Table 2 Demographic characteristics of study 3 participants* (n 93)
* χ 2, no significant differences between nutrition and engineering students.
† One student was missing all demographic data.
Construct validity
Descriptive statistics were undertaken to analyse the distribution of the data (Table 3). The minimum and maximum scores obtained by nutrition students were higher than those of engineering students in all categories, excluding section 3 where participants in both cohorts obtained a score of 9 out of 10. The differences in results obtained by nutrition and engineering students were significant across all sections of the questionnaire (P < 0·01). Overall, nutrition students obtained a median score of 102 out of 117 (87 %), compared with engineering students who scored 82 (77 %). This resulted in a reported difference of 20 marks, which was significant (U = 114, P < 0·01).
Table 3 A comparison of nutrition knowledge questionnaire scores obtained by participants in study 3 (n 93)

† Descriptive statistics.
‡ Mann–Whitney U test, significance: *P < 0·01, **P < 0·001.
§ Non-normally distributed scores reported as median and IQR: 25th, 75th percentiles.
‖ Normally distributed scores reported as mean with standard deviation.
Internal reliability and item discrimination
Overall, the questionnaire reported a high Cronbach’s α (0·92) for reliability (Table 4). Cronbach’s α for each section was also analysed to indicate whether items within the questionnaire would improve or reduce the reliability of the questionnaire. Cronbach’s α for section 2 ‘nutrients in foods’ (α = 0·86) and section 4 ‘diet–disease relationships’ (α = 0·83) was above the acceptable value of 0·70-0·95 for reliability. Section 1 ‘dietary recommendations’ was just below the minimum cut-off (α = 0·67) and section 3 ‘food choices’ was below an acceptable value (α = 0·37). Section 1 would improve above a significant Cronbach’s α (0·67–0·70) if question 16 was removed; however, sections 2–4 and the questionnaire as a whole would only improve marginally if the selected items were removed. Item–total correlation was used to measure item discrimination by reviewing each question to see whether it obtained a correlation value >0·2, indicating that it was a good determinant of nutrition knowledge. For each section of the questionnaire, between 6 and 18 questions were considered to have a ‘low level of correlation’ with other available items in that section. When the sections were analysed individually, a total of thirty-nine questions were not well correlated; however, when the questionnaire was analysed as a whole, only twenty-four questions were not well correlated. Consequently, all questions were retained.
Table 4 Questions identified in AUS-R NKQ that if removed would alter reliability

† Questions that when removed improved or reduced the reliability of the questionnaire.
‡ Item–total correlation.
§ Items in a section of the questionnaire with correlation >0·2.
Test–retest reliability
Twelve nutrition students and seven engineering students provided data eligible for inclusion in the test–retest analysis. Paired sample t tests and Wilcoxon signed-rank tests were conducted to analyse the consistency of the nutrition knowledge questionnaire. Each section of the questionnaire was assessed for statistical significance in separate cohorts. There was no significant difference in responses obtained by nutrition (t11 = –0·10, P = 0·92) or engineering (Z = –0·85, P = 0·40) students between the first and second administrations of the questionnaire. The analysis of Pearson’s correlation coefficients and Spearman’s rank-order correlation found a strong, positive correlation for the average reliability coefficient of nutrition (r = 0·89, P < 0·01) and engineering students (r = 0·83, P < 0·05). The correlation coefficient for the questionnaire as a whole was high (r = 0·96, P < 0·01). All section values were >0·7 and, therefore, were strong and positively correlated(Reference Ratner50) (Table 5). Intraclass correlation was undertaken using a two-way mixed effect with absolute agreement, and the average rater measure is reported throughout (Table 5). A high correlation among nutrition (ICC2,1 0·94, 95 % CI 0·81, 0·98, P < 0·01) and engineering students (ICC2,1 0·96, 95 % CI 0·96, 0·99, P < 0·01) was reported. Overall, strong correlations were found between the two questionnaire administrations (ICC2,1 0·99, 95 % CI 0·98, 0·99, P < 0·01). All sections of the questionnaire obtained an ICC >0·75 indicating good-to-excellent reliability (0·83–0·98), as seen in Table 5 (Reference Koo and Li49).
Table 5 Correlation and agreement at time 1 and time 2 of test–retest scores

Non-normally distributed scores reported as significance: *0·05, **0·01, ***0·001.
† Normally distributed scores reported as Pearson’s correlation coefficient (r).
‡ Non-normally distributed scores reported as Spearman rank-order correlation coefficient (r s ).
§ Non-normally distributed scores reported as ICC.
Discussion
Our study has developed the AUS-R NKQ, a thirty-eight-item questionnaire that assesses the four sections of nutrition knowledge: dietary recommendations, nutrients in foods, food choices, and diet–disease relationships. This questionnaire is able to discern significant differences between nutrition knowledge scores obtained by nutrition and engineering student cohorts. This is consistent across sections and the overall questionnaire, indicating that the developed questionnaire accurately distinguishes between individuals with differing levels of nutrition knowledge. While university-educated students were the focus of the current validation study, the initial findings suggest that the questionnaire is able to distinguish between individuals with higher or lower levels of nutrition knowledge(Reference Hendrie, Cox and Coveney26). The research thus far is promising for the future use of the proposed questionnaire in diverse populations in Australia.
Questionnaire validation
The results obtained in AUS-R NKQ were similar to those obtained by Hendrie et al.(Reference Hendrie, Cox and Coveney26) and Kliemann et al.(Reference Kliemann, Wardle and Johnson27), where differences between two groups were statistically significant. Overall, the questionnaire was able to measure nutrition knowledge consistently over time, which is an important component when evaluating the effectiveness of nutrition interventions(Reference Hendrie, Cox and Coveney26). The questionnaire obtained a high overall reliability with Cronbach’s α equivalent to that of Hendrie et al.’s(Reference Hendrie, Cox and Coveney26) questionnaire and only marginally below Kliemann et al.’s(Reference Kliemann, Wardle and Johnson27). Sections 1, 2 and 4 obtained a high reliability independently; however, section 3 was below an acceptable internal reliability and, therefore, should not be used separately. This section consisted of ten questions with the highest possible score, a total of 10 marks, which is lower than all other sections within the questionnaire, indicating that section 3 may have a lower degree of correlation between items. A comparison of reliability and validity across AUS-R NKQ, Hendrie et al.(Reference Hendrie, Cox and Coveney26) and Kliemann et al.(Reference Kliemann, Wardle and Johnson27) questionnaires is presented in supplementary material, Table 2. AUS-R NKQ obtained the same level of internal reliability as Hendrie et al.(Reference Hendrie, Cox and Coveney26) (α = 0·92) with Kliemann et al.’s(Reference Kliemann, Wardle and Johnson27) internal reliability only slightly higher (α = 0·93) than that of AUS-R NKQ, indicating that the revised questionnaire performed well in comparison to existing tools. AUS-R NKQ also reported a higher intraclass correlation coefficient for the questionnaire overall (ICC = 0·99) compared with Kliemann et al.’s(Reference Kliemann, Wardle and Johnson27) questionnaire (ICC = 0·89).
Item discrimination was undertaken; however, all items were retained as the questionnaire intended to cover a range of nutrition constructs, as indicated by key nutrition documentation. There was no relationship between questions across the four constructs that would improve or reduce the reliability of the overall questionnaire. Sections 2 and 4 can be distributed separately to measure these aspects of nutrition knowledge, while the removal of a single question in section 1 would also allow its individual distribution; however, no question on water recommendations would then exist within this component. Therefore, it is important to understand which items most effectively measure nutrition knowledge in order to develop a questionnaire that retains high validity and reliability while using the minimum number of items possible to reduce time-associated barriers with the questionnaire’s future use.
The construct of nutrition knowledge
The AUS-R NKQ found that participants (both nutrition and engineering students) tended to score lower on section 2 ‘nutrients in foods’ but scored well on section 4 ‘diet–disease relationships’. This contrasts with Hendrie et al.(Reference Hendrie, Cox and Coveney26) who reported that participants scored consistently poorer on questions relating to diet–disease relationships. Current research indicates that nutrition science is tending to shift more towards a ‘food and dietary pattern’ focus as opposed to ‘knowledge of individual nutrients’, which may explain the lower levels of reported knowledge(Reference Worsley, Wang and Byrne61,Reference Ridgway, Baker and Woods62) .
Engineering students tended to score higher in section 3 ‘food choices’, which included questions on menu reading, food label interpretation and the ‘health star rating’. The Australian government initiatives such as the ‘health star rating’ campaign have utilised online advertising since 2014. The ‘kilojoules on the menu’ campaign adopted by five of the seven Australian states and territories advertised via Facebook since 2016(63,64) . The strong media presence of these campaigns may have assisted in improving individuals’ knowledge on choosing healthier options. Nutrition and engineering students’ scores showed less differentiation in this section, which may be a reflection of areas where major public investments and successful social marketing campaigns have raised awareness of these topics among the general public.
Environmental and personal factors are ever-changing, and the revised Australian questionnaire is a static measure of nutrition knowledge that is relevant based on current national nutrition recommendations and guidelines(Reference Worsley1). Health beliefs advertised in the media were a common discussion point when evaluating the longevity of AUS-R NKQ. Relevance to the current population resulted in the inclusion of commonly consumed meals and fad foods (such as coconut oil). Some participants believed limiting the consumption of fruit, milk, yoghurt and cheese was recommended by the ADG, which is a common nutrition misconception(32,Reference Whitney and Rolfes65) .
This questionnaire used a scoring system to rate an individual’s nutrition knowledge where a higher score assumed a higher level of knowledge. However, the baseline score in which an individual would be said to have adequate nutrition knowledge is unknown. Therefore, a lower score within the questionnaire may not be associated with a level of nutrition knowledge that would contribute to sub-optimal dietary behaviours(Reference Spronk, Heaney and Prvan35). It is important to use this questionnaire to compare results as part of an intervention while considering a variety of environmental and intra-individual factors when assessing the relationship between nutrition knowledge and, for example, dietary intake(Reference Worsley1).
This study has provided insights into the process of developing and validating a questionnaire, and highlighted the complexity in the dynamic field of nutrition knowledge. The construct of nutrition knowledge is subjective, which was highlighted by the varied responses and lack of consensus among the academic dietitians and difficulty in finalising items to form the basis of AUS-R NKQ. These insights reiterate the complexity of a concept such as nutrition knowledge.
Limitations
Limitations of the research include sample size and characteristics. A post hoc power analysis of the mean differences between groups from the test–retest study determined the study to have a small to medium effect size (d = 0·48). To obtain statistical power at the recommend level of 0·8, the sample size needed to be around thirty-six participants. Participants in studies 2 and 3 were not necessarily representative of their respective populations and do not reflect the Australian population as a whole. Research has shown that individuals with higher levels of education tend to demonstrate higher levels of nutrition knowledge, indicating that findings from a general public sample may tend to be lower than those obtained by this study(Reference Deniz and Alsaffar19,Reference Contento66) . Therefore, results obtained by this study are limited to the context in which it was undertaken, and require further validation before being administered on more diverse samples, for example, children, elderly and mixed socioeconomic and cultural groups(Reference Bonaccio, Di Castelnuovo and Costanzo6,Reference Grosso, Mistretta and Turconi67) . Another limitation is the potential for participants to guess or search for correct responses due to the online format of the questionnaire. To reduce this limitation, individuals were asked to select ‘not sure’ instead of searching or guessing as per the Kliemann et al.(Reference Kliemann, Wardle and Johnson27) questionnaire; however, if this occurred the results from this study did not appear to be impacted.
The process used in the development of AUS-R NKQ reflected agreement with the definitions and four sections of nutrition knowledge established in the original Parmenter and Wardle(Reference Parmenter and Wardle17) questionnaire and replicated in Hendrie et al.(Reference Hendrie, Cox and Coveney26) and Kliemann et al.(Reference Kliemann, Wardle and Johnson27) questionnaires. Due to time restraints associated with the study, only items from the GNKQ tools were used to underpin the development of AUS-R NKQ. However, it would be recommended to review items and include a more representative pool of questions prior to conducting validity studies.
The short timeframe between the first and second administrations of the questionnaire was initially believed to explain the results obtained in the test–retest reliability statistics. However, research indicates that there has been no significant differences in results between a 2-d v. a 2-week test administration(Reference Marx, Menezes and Horovitz68) and that a 1-week time interval between administrations is enough to avoid recall bias(Reference Turconi, Celsa and Rezzani69). Time spent completing the questionnaire was not recorded, and estimated based on the face validity study with retail workers. It was not possible to record times via the online questionnaire; however, this may be important in determining ways in which participant burden can be reduced. Kliemann et al.(Reference Kliemann, Wardle and Johnson27) reported no significant differences by sex when assessing the validity and reliability of the questionnaire in a university sample, and was thus considered to lack relevance in comparison to questions on age, ancestry or education status when developing the revised Australian questionnaire. However, when developing future questionnaires, it is recommended to include sex in order to account for the associated bias in populations outside of a university sample. While this questionnaire was developed online, it may not be appropriate for all demographics or socioeconomic groups within Australia due to issues associated with internet access and self-selection methods(Reference Bethlehem70). The questionnaire was, however, developed online in a format that can be easily transferred to a paper version. The concept and priorities of nutrition knowledge are ever-evolving and a revision of the definition with expert consensus may change what essential components need to be measured. While the nutrition knowledge of a group within the Australian population has been analysed, this questionnaire does not explain where individuals obtain their nutrition information from, how this may influence their food supply or its relationship to dietary intake(Reference Pollard, Pulker and Meng71).
Further validation of AUS-R NKQ is required to test its usability in practice, for example, measuring changes in nutrition knowledge among student cohorts or testing the effectiveness of nutrition interventions. This will assist in refining particular items and sections within the questionnaire to improve overall validity and reliability.
Conclusion
This is the first questionnaire to be redeveloped for an Australian audience since the original publication of Hendrie et al.’s(Reference Hendrie, Cox and Coveney26) questionnaire. AUS-R NKQ is based on the synthesis of items from two nutrition knowledge questionnaires, with their alignment and adherence to the Australian nutrition recommendations. This questionnaire is able to distinguish between individuals with known nutrition knowledge levels with high reliability and consistency within an Australian sample.
Acknowledgements
Acknowledgements: The authors wish to thank all participants of the research: the academic dietitians, the store manager and retail workers, and the QUT nutrition and engineering students. This research was supported by the School of Exercise and Nutrition Sciences at QUT. Financial support: None. Conflict of interest: None. Authorship: D.G. conceptualised the study; all authors contributed to the methodology. C.T. collected the validity data; all authors analysed the data. C.T. prepared the original manuscript. All authors reviewed and edited the manuscript; all authors have read and approved the final manuscript. Ethics of human subject participation: This study was conducted according to the guidelines laid down in the Declaration of Helsinki, and all procedures involving study participants were approved by UHREC at QUT, approval number 1800000549. Written informed consent was obtained from all participants.
Supplementary material
For supplementary material accompanying this article visit https://doi.org/10.1017/S1368980019005135


