


The consumption of sugar-sweetened beverages (SSB) has been associated with cavities(Reference Moynihan and Kelly1), obesity(Reference Malik, Popkin and Bray2,Reference Pereira3) , metabolic syndrome(Reference Malik, Popkin and Bray2,Reference Narain, Shing Kwok and Mamas4) , type II diabetes(Reference Malik, Popkin and Bray2,Reference Neuenschwander, Ballon and Weber5) , CVD(Reference Malik, Popkin and Bray2,Reference Xi, Huang and Reilly6,Reference Monnard and Grasser7) and some cancers(Reference Chazelas, Srour and Desmetz8). Worldwide, an estimated 0·58 8-oz servings of SSB are consumed per person per day, with young adults consuming more SSB compared with other age groups(Reference Singh, Micha and Khatibzadeh9). SSB represent a significant contributor to added sugar in a western diet(Reference Langlois, Garriguet and Gonzalez10–Reference Welsh, Sharma and Grellinger12). Recent estimates from Canada and the USA indicate that SSB account for 32% of added sugar consumption(Reference Malik, Newman and Hunt11), 23·6% of total sugar consumption(Reference Langlois, Garriguet and Gonzalez10) and represent 5% of total energy intake, which is the largest contribution of any single source of energy(Reference Malik, Newman and Hunt11). These values are more significant when you consider that all beverage consumption accounts for ~16% of total energy intake(Reference Malik, Newman and Hunt11). Increased consumption of SSB is also associated with decreased consumption of nutritionally superior beverages, such as milk(Reference Neilsen and Popkin13). Considering the significant negative health impact of SSB consumption, reducing the intake of SSB should be a public health priority.
Environmental interventions or ‘nudges’ have been more effective at changing nutrition behaviour than educational campaigns alone, and current literature focuses on combining environment changes with individual-level education campaigns to induce behaviour change(Reference Lu, Dickin and Dollahite14). Several types of environmental interventions have been used successfully to reduce SSB intake, including limiting or restricting the sale or distribution of SSB and sugar taxes. Primary and secondary schools restrict the availability of SSB in schools in the hope of reducing consumption; however, there is low certainty evidence that these policies are associated with reduced consumption, as school-age children may still have access to these beverages outside of school(Reference von Philipsborn, Stratil and Burns15). These results may differ at post-secondary institutions, though few policies exist(Reference Bole16–Reference Strom18). Three post-secondary institutions have proposed beverage policies that limit access to SSB; the University of California San Francisco (UCSF)(Reference Bole16), the University of Michigan Health System (UMHS)(17) and the University of Sydney(Reference Strom18); however, formal evaluation of these initiatives is limited to a single article describing the health impacts of the UCSF initiative(Reference Epel, Hartman and Jacobs19).
In adult environments, such as post-secondary institutions, interventions that favour personal responsibility are preferred compared with environment-centred, population-based approaches(Reference Howes, Freeman and Wi20), and implementing policies to restrict the sale of SBB on post-secondary campuses may be met with trepidation by senior leadership and the campus community. Despite the lack of public support, similar policies have been advocated for(Reference Wojcicki21) and implemented in hospital settings and demonstrated success in altering beverage consumption patterns without significant revenue loss(Reference Eneli, Oza-Frank and Grover22).
Post-secondary institutions are committed to the health and well-being of their faculty, staff and students(23). This commitment is demonstrated through the adoption of the Okanagan Charter: An International Charter for Health Promoting Colleges and Universities (23), which sets out a vision, calls to action and principles for health promoting campuses to embed health into all aspects of campus culture, across administration, operations and academic mandates(23). Access to healthy food and beverage products on campus and the provision of information necessary to make healthy dietary choices are in line with the Okanagan Charter while also supporting the well-being and academic success of the community.
Inspired by the Okanagan Charter, the University of British Columbia (UBC) developed the Healthy Beverage Initiative (HBI) to alter the beverage landscape on campus with the intention to reduce SSB consumption. Few policies exist on post-secondary campuses with this goal and policies of this type are often met with significant resistance. Therefore, the aims of this paper are to describe the development, implementation and preliminary evaluation of the UBC HBI. Finally, as the UBC HBI is an ongoing initiative, future directions for the HBI will be discussed. In doing so, we describe a process that could be adopted by other institutions.
Methods
Initiative development
UBC is the largest university in British Columbia and the third largest university in Canada(24), with ~65 000 students and ~17 000 staff across two campuses, in Vancouver and Kelowna, British Columbia. It was one of the first adopters of The Okanagan Charter (23) and this adoption led to the subsequent development of the UBC Action Framework for a Nutritionally Sound Campus (25) and the current Wellbeing Strategic Framework (26). These frameworks aim to increase the UBC community’s intake of safe, healthy and sustainable foods and support the development of nutrition skills and knowledge.
Recognising that SSB are the single largest contributor of added sugar in the diet(Reference Welsh, Sharma and Grellinger12), the UBC Food and Nutrition committee, which includes all major food and beverage provider stakeholders, in collaboration with students, staff and faculty across the university, worked together to develop the UBC HBI to change the beverage landscape of the UBC campus. Beginning in November 2016, this initiative was informed by community engagement through focus groups and a formal survey. The identification of the priorities for the HBI was approved by the stakeholders in Spring 2018(27). The HBI was brought before the UBC Board of Governors and Executive Committee and approved in April 2018. Implementing the HBI at UBC has been a complex undertaking, supported across campuses and aligned with UBC’s approach to embedding and operationalising well-being. Fiscal implications as well as impact on operations were, and continue to be, considered in all aspects of the initiative. However, UBC’s commitment to improving the health and well-being of the community remains the HBI’s priority.
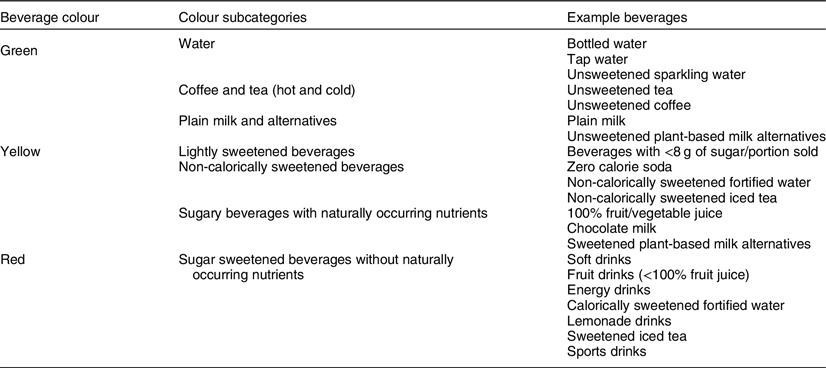
The HBI has three distinct priorities: (1) encourage water consumption through increased access to safe drinking water; (2) promote healthier beverage choices within the community and (3) modify the environment to support healthier beverage consumption(27). The multipronged approach was developed based on the philosophy that changing food consumption behaviours via policy and environmental nudges is more effective than education alone(Reference Lu, Dickin and Dollahite14). To facilitate these priorities, beverages are grouped into a tiered traffic light system, with green beverages to be chosen most often (e.g. water and unsweetened coffee and tea), yellow beverages to be chosen sometimes (e.g. chocolate milk, 100% fruit juice, diet soda) and red beverages (e.g. sweetened soda and iced tea, fruit drinks) to be chosen rarely. Table 1 presents the complete beverage classification system.
Table 1 Beverage classification system
Initiative implementation
Cold beverage agreement modification
Like most Canadian universities, UBC has a Cold Beverage Agreement (CBA) that partners the university with a major beverage producer to provide a variety of beverage options. The revenue generated from beverage sales and sponsorship contributes to the profitability of food services partners and stakeholders at UBC. These contracts not only limit the brands of products sold on campus but also describe which beverages need to be sold in all retail locations and vending machines and even include descriptions as to where these beverages are placed in the coolers. Additionally, these agreements also include marketing obligations for the university to promote certain products on campus. As such, implementing the UBC HBI would have been impossible under the previous CBA. In renewing their CBA, UBC Food Services developed a new CBA approach to align with the planned activities of the HBI. During the tendering process, applicants were required to demonstrate how they would support the HBI by focusing on marketing and selling healthier beverage options and no longer advertising sugary beverages (red beverages) in select locations (e.g. residence dining halls). The new CBA was reached with Coca-Cola Refreshments Canada. There are three unique features of the new CBA: (1) UBC has no obligations to market any red beverages anywhere on campus (e.g. all vending machine wrappings have been changed from classic Coca-Cola branding to water); (2) UBC can exclude red beverages from certain retail locations and expand the number of retail locations that do not sell red beverages (e.g. removing red beverages from residence dining halls) and (3) UBC now has the ability to align all vending locations with the provincial Ministry of Health healthy vending policy(28). The new CBA aligns with action 2, promoting healthier beverage choices, and action 3, modifying the environment to support healthier beverage consumption. In July 2020, UBC entered the third year of the multiyear agreement with commitment to continue to support the HBI, as well as more sustainable options, including reusable bottling.
Tap water campaign
In alignment with action 1, to promote the consumption of tap water, a marketing campaign was developed and implemented in Spring 2019. UBC has a large international student population (~25%), many of whom come from countries where tap water consumption is neither common nor safe. The tap water on both UBC campuses is clean, safe to consume and regularly tested to maintain these standards. A tap water promotion campaign was implemented to educate students who may not be aware of the health and environmental benefits of drinking tap water. The campaign aimed to (1) educate the community on the safety of drinking tap water and the harms of drinking SSB and (2) address the sustainability concerns of bottled water. The campaign was developed by the UBC Food and Nutrition Committee and UBC Student Housing and Community Services, with the support of the HBI stakeholders. It used multimedia tactics to increase likelihood of exposure, including a website (h2omg.ca), social media, campus events, posters and ads, floor and water fountain decals, bus banners, buttons, stickers, digital signage and a media tool kit. Seven key messages were developed for the campaign: (1) drinking water is an informed decision made by intelligent people; (2) tap water is as healthy, pure and safe as bottled water; (3) drinking bottled beverages has environmental implications; (4) drinking sugary bottled beverages has negative environmental and health implications; (5) ‘Big Soda’ uses misleading marketing to encourage purchasing; (6) tap water is a positive economic choice and (7) never leave home without your reusable water bottle. The HBI stakeholders plan to re-run the campaign in the future.
Removing red beverages from select locations
In alignment with action 3 of the HBI, to modify the environment to support healthier beverage consumption, we piloted removal of red beverages from select locations, specifically in a residence dining hall. The pilot was intended to serve as a preliminary investigation of the removal of red beverages’ impact on revenue – a potential concern for UBC and their beverage partners, compensatory purchasing behaviour (e.g. greater red beverage purchases in retail outlets near to the dining hall), and patron perceptions of the acceptability of the beverage removal. Future plans to implement the removal of red beverages from all retail locations across campus will likely require support of the campus community; thus, a formal evaluation of red beverage removal was planned. The formal objectives of the evaluation were to (1) examine changes revenue generated from beverage sales compared with (a) the previous year and (b) similar residence dining halls; (2) evaluate any potential compensatory purchasing behaviour (increased revenue) at the nearest retail locations selling red beverages and (3) determine patron’s attitudes and perceptions of the acceptability of the beverage removal.
Evaluating the University of British Columbia Healthy Beverage Initiative
Removing red beverages from select locations
Red beverages were removed from the Feast Dining Hall at the Totem Park Student Residence (Intervention) and replaced with healthier beverage options (green or yellow beverages) in September 2018. This was compared with two other first-year residences at UBC Vancouver, Gather Dining Hall at Place Vanier (Comparison 1) and Open Kitchen Dining Hall at Orchard Commons (Comparison 2). All three dining halls are open to the public, though mostly frequented by first-year students, and charge customers per cost of item. These dining halls are opened for meal and snack purchases from 7 am until 9 pm for Intervention and Comparison 1 dining halls and until 10 pm for Comparison 2 dining hall. The dining halls are operated by UBC Student Housing and Community Services and subject to the CBA, as such the beverages offered in all three dining halls were essentially identical prior to the implementation of the HBI. The residences in which these dining halls are located are designated first-year residences and the students who live in them are required to purchase a meal plan that operates on a declining balance system – a meal plan is purchased, and item costs are deducted from the meal plan balance. Totem Park (Intervention Residence) has 2130 beds in ten mixed gender houses; Place Vanier (Comparison 1 Residence) has 1464 beds in twelve single and mixed gender houses and Orchard Commons (Comparison 2 Residence) has 1078 beds in two houses with mixed gender floors. Despite the smaller size of the Comparison 2 Residence, it is the busiest dining hall as it is more centrally located to the rest of campus.
Dining hall users were not informed of the changes to beverage availability prior to the beverage removal. Point of sales data were collected from the three dining halls for two semesters, from September to December 2018 (Post-HBI 1) and January to April 2019 (Post-HBI 2) and compared with the same time periods Fall 2017 (Pre-HBI 1) and Winter 2018 (Pre-HBI 2) to examine both the impact of the red beverage removal and changes in beverage purchases over time. Residence dining halls are not open during the summer (May to August). Point of sales data were extracted from the cash register’s databases following the investigation periods. The databases record the number and revenue generated from the sale of each type of beverage and records this in an itemised list. Based on their composition, beverages were classified as green, yellow, red, according the HBI classification system (Table 1) or as bulk and other beverages. Bulk beverages are soda and juices that come from self-serve fountain beverage machines and are entered into the point of sale system under a single category. The fountain machines contain green, yellow and red beverages, and it is impossible to discern which beverage type was purchased based on the point of sales records; therefore, they are considered together in this analysis. The other beverages include beverages such as kombucha, which are generally sweetened but have some health claims associated with them. As the evidence to their health benefit is currently inconclusive, we have considered these beverages separately in the current analysis.
To examine any compensatory purchasing behaviour due to the red beverage removal, point of sales data were extracted and collected from the two convenience stores located in Totem Park (Intervention Residence, Convenience 1) and Place Vanier (Comparison 1 Residence, Convenience 2), in the same manner as the dining hall data. It was reasoned that since red beverages were not removed from these locations, they represent the closest geographic locations where patrons could purchase red beverages in the Intervention and Comparison 1 residence complexes. Any observed increases in red beverage sales at Convenience 1 could be interpreted as compensatory purchasing behaviour due to the removal of red beverages at the Intervention site. Comparison 2 residence does not have a convenience store or comparable retail location operated on site and therefore did not have comparable data.
Finally, in-person intercept surveys were conducted with patrons of each of the three dining halls to assess attitudes and perceptions of the intervention. Trained researchers stood beyond the point of sales systems (cash registers) to conduct the survey during lunch (11:30 a.m.–2:30 p.m.) and dinner (5:00 p.m.–8:00 p.m.) Monday to Thursday to capture weekday behaviour. Researcher conducted the survey verbally whenever possible or under direct supervision when not possible. Participation was incentivised by entry into a draw to win one of six healthy food baskets ($25 value). The survey examined the acceptability and attitude towards the current intervention and potential future HBI interventions. The survey was conducted in all three dining halls in September 2018, immediately following red beverage removal and repeated in December 2018 in the Intervention site only after the red beverages had been removed for several months. A total of 336 respondents completed the survey in September, and eighty-six respondents completed the survey in December. Survey respondents were asked demographic information (relationship to UBC, year of study, gender, international or domestic student) and if they were aware that the SSB had been removed from the dining hall. They were asked about instrumental and affective attitudes regarding the removal of red beverages from dining halls and were asked to rate them on a five-point scale. Instrumental attitudes included good–bad, useful–useless and acceptable–unacceptable. Affective attitudes included insulting–not insulting, fair–unfair and happy–unhappy. The attitude measures were constructed based on Theory of Planned Behaviour guidelines(Reference Ajzen29). Respondents were also asked about ten potential HBI activities and asked to rate them on a five-point scale as to how supportive they were of each activity in the September survey only. The activities were derived from previous work by Howes and colleagues(Reference Howes, Freeman and Wi20).
Data analysis
Total revenue and units sold were calculated for each category of beverages based on the data extracted from the point of sales systems. Percentage changes in total and individual beverage category revenue and units sold were calculated and compared over time (Pre-HBI 1, Pre-HBI 2, Post-HBI 1, Post-HBI 2) and between dining halls (Intervention, Comparison 1, Comparison 2). Percent contribution of each beverage category (both revenue and units sold) was also calculated to examine the contribution of each beverage type to total sales and how it changed following the removal of red beverages from the Intervention Dining Hall. Differences in revenue changes were determined based on historical trends and fluctuations in percent changes of revenue of ~10% are considered within the normal range. For analysis of the five-point scales, mean ± sd were calculated with 1 representing the most negative opinion and 5 representing the most positive opinion, and independent sample t-tests were used to determined difference between the September and December survey. All statistical analyses were completed using SPSS version 26.0.
Evaluation results
Sales impact
Overall, significant declines in beverage sales revenue were observed between Pre-HBI 1 and Post-HBI 2 across all dining halls, regardless of whether red beverages had been removed. When examining the combined total revenue from the Pre-HBI 1 and Pre-HBI 2, compared with Post-HBI 1 and Post-HBI 2, we observed an ~12–24% decline in total revenue across all three dining halls (Fig. 1a) and paralleled by an ~20–26% decline in units sold. However, when we examined the semester by semester change, we observed that the most significant decline in revenue and units sold occurs between Pre-HBI 1 and Pre-HBI 2 before the red beverages were removed from the Intervention dining hall. When examining the change in revenue from Pre-HBI 2 to Post-HBI 1, the semesters on either side of the red beverage removal in the Intervention dining hall, there was an ~10% decline in revenue and ~11% decline in units sold. This is compared with the ~3–10% increase in revenue and ~3–8% decrease in units sold in the other dining halls during this time. Comparing Post-HBI 1 and Post-HBI 2 in the Intervention dining hall, a 4·4% increase in revenue and 1% decline in units sold were observed. In Comparison 1 and Comparison 2, an ~8–15% decline in revenue and ~2–12% decline in units sold were observed over the same time period. These changes suggest that changes of ~10% in either revenue or units sold are within the expected levels observed in the dining halls. The lack of change in total revenue can be attributed to the redistribution of beverage purchases following the removal of red beverages (Fig. 1b). Increases in the sales of green beverages were observed in the first semester of the intervention, while increases in yellow beverages were observed in the second semester.
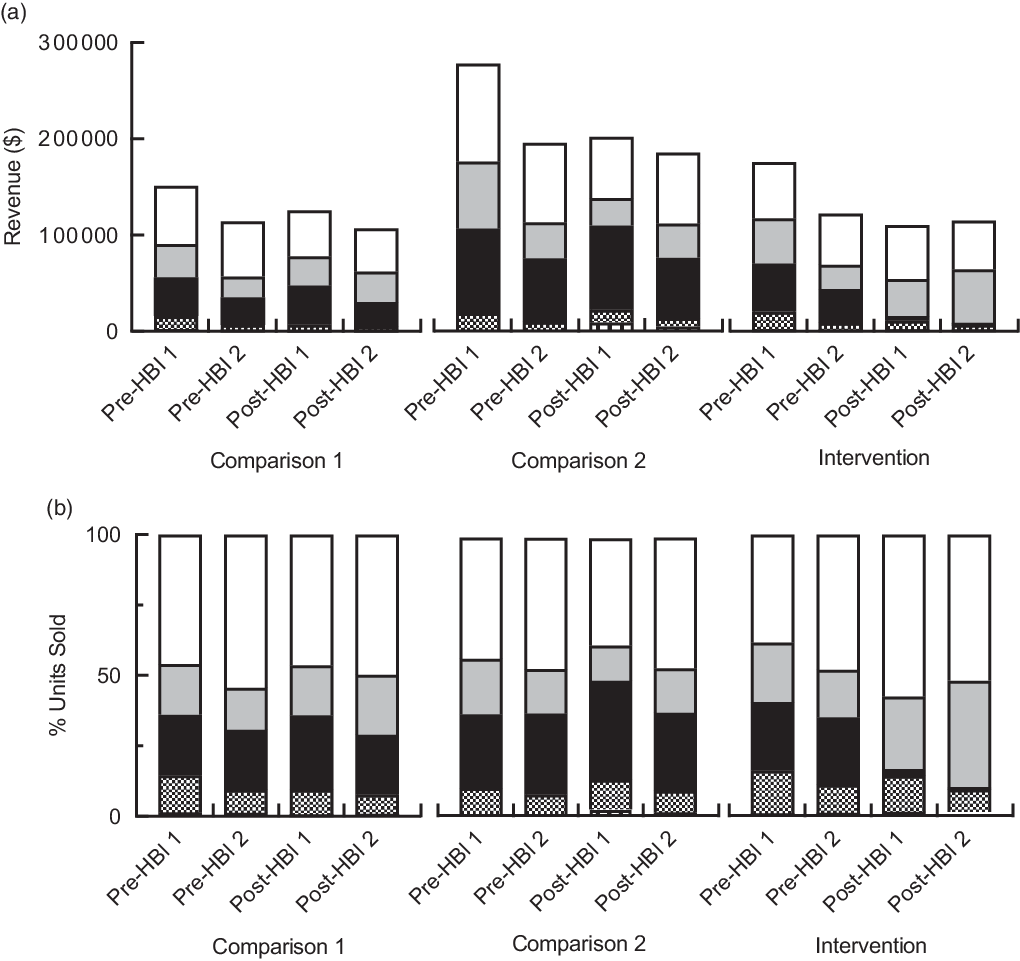
Fig. 1 Beverage revenue and units sold following the removal of red beverages. (A) Changes in beverage revenue prior to (Pre-HBI 1 and Pre-HBI 2) and following the removal of red beverages from Intervention Dining Hall (Post-HBI 1 and Post-HBI 2); (B) changes in percentage of beverage type sales over time. ![]() , Green;
, Green; ![]() , Yellow;
, Yellow; ![]() , Red;
, Red; ![]() , Bulk;
, Bulk; ![]() , Other
, Other
Compensatory purchasing
There was limited evidence of compensatory SBB purchasing at Convenience 1 as a result of the red beverage removal from the Intervention dining hall. Overall, an ~19% increase in the number of beverages sold (all classes) and an ~25% increase in revenue generated from beverage sales was observed at Convenience 1 between the 2017/2018 school year (Pre-HBI) and the 2018/2019 school year (Post-HBI). This corresponds to an ~10% increase in the number of red beverages sold and an ~15% increase in the revenue generated from these beverages. Conversely, at Convenience 2 convenience store, associated with Comparison 1 Dining Hall, an ~25% decrease in the number of beverages sold (all categories) and an ~17% decrease in revenue generated from beverage sales were observed. Red beverage sales declined by ~36% and revenue declined by ~29%. When red beverage sales are considered as a percentage of total sales, we actually see a decline in sales at both locations between the Pre-HBI year and the Post-HBI year. At Convenience 1, red beverages accounted for ~55% of beverage sales and ~57% of revenue Pre-HBI. This declined to ~51% and 52%, respectively, Post-HBI. At Convenience 2, red beverages accounted for ~49% of beverage sales and ~51% of revenue Pre-HBI. This declined to ~42 and ~43%, respectively, Post-HBI. Taken together, these data suggest that the removal of the red beverages at the Intervention dining hall did not lead to increased purchases of red beverages at Convenience 1.
Patron attitudes and perceptions
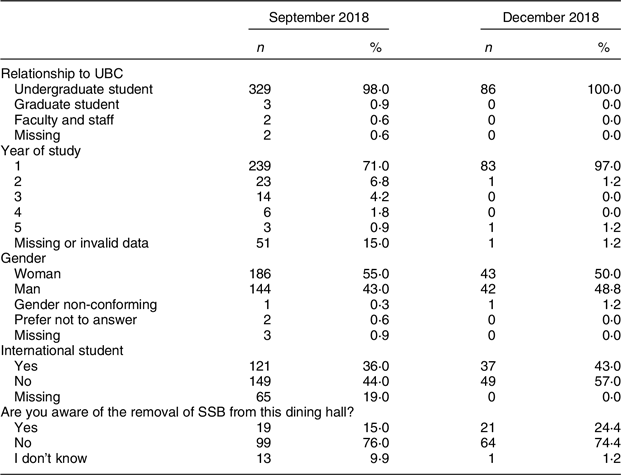
The majority of the participants who responded to our survey were first-year undergraduate students. The full demographic characteristics of the survey respondents are presented in Table 2. During the September survey, 76% of survey respondents indicated that they were unaware that SSB (red beverages) had been removed from the dining hall cafeteria, and, perhaps surprisingly, this statistic remained similar at the follow-up December survey with ~74% of respondents indicating that they were unaware of the red beverage removal.
Table 2 Survey respondent demographics
In general, attitudes towards the removal of the red beverages were positive in September. The majority of respondents (combination of positive response and somewhat positive) indicated that they thought the intervention was good, useful, not insulting, fair, acceptable and were happy about it. These attitudes continued in the affirmative direction in December (Fig. 2), with good (Sep: 4·0 ± 1·0 v. Dec: 4·4 ± 0·9, P = 0·001), not insulting (Sep: 4·0 ± 1·1 v. Dec: 4·6 ± 0·8, P < 0·001), fair (Sep: 3·5 ± 1·1 v. Dec: 4·0 ± 1·1, P < 0·001), acceptable (Sep: 3·9 ± 1·1 v. Dec: 4·6 ± 0·8, P < 0·001) and happy (Sep: 3·5 ± 1·0 v. Dec: 3·8 ± 1·0, P = 0·045) reaching a statistically more positive response, though there were no significant differences for useful (Sep: 4·0 ± 0·9 v. Dec: 4·2 ± 1·1, P = 0·399). When asked which HBI activities they would be supportive of, the most popular activities were increased access to free drinking water (4·8 ± 0·5 AU), lower price of healthier beverages (4·7 ± 0·7 AU) and altered placement of healthy beverages in the refrigerators (4·4 ± 0·7 AU). The least supported activities were replacing SSB in the dining rooms (3·0 ± 1·2 AU) and vending machines (3·0 ± 1·1 AU) and replacing diet beverages in the dining room (3·0 ± 1·1 AU) and vending machines (3·0 ± 1·1 AU; Fig. 3), though the majority of survey respondents were supportive or neutral regarding these activities. These views persisted despite ~75% of respondents not noticing the beverages had been removed.
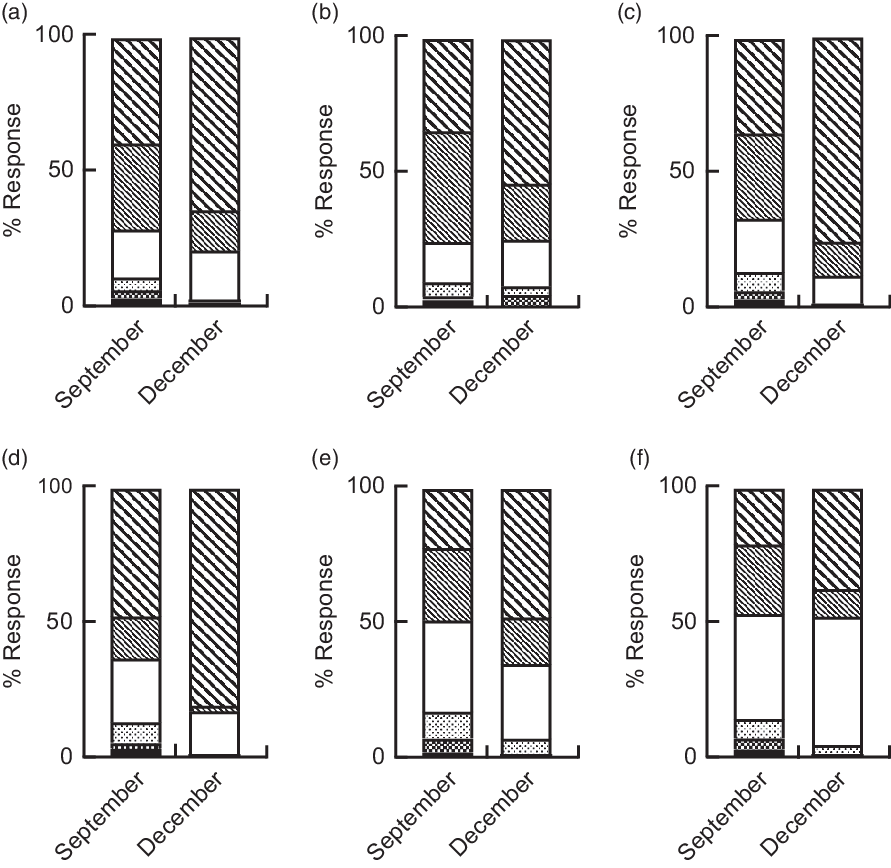
Fig. 2 Instrumental and affective attitudes towards the removal of red beverages from Intervention Dining Hall. (A–C) Instrumental Attitudes; (a) Good–Bad; (b) Useful–Useless; (c) Acceptable–Unacceptable; (D–F) affective attitudes; (d) Not Insulting–Insulting; (e) Fair–Unfair; (f) Happy–Unhappy; positive attitude. ![]() , Positive Attitude;
, Positive Attitude; ![]() , Somewhat Positive;
, Somewhat Positive; ![]() , Neutral;
, Neutral; ![]() , Somewhat Negative;
, Somewhat Negative; ![]() , Negative Attitude;
, Negative Attitude; ![]() , Missing
, Missing
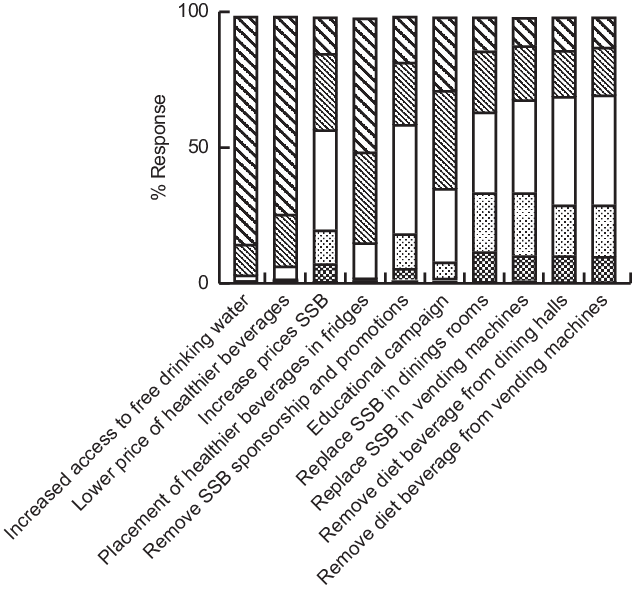
Fig. 3 Perceptions of potential HBI activities. ![]() , Extremely Supportive;
, Extremely Supportive; ![]() , Somewhat Supportive;
, Somewhat Supportive; ![]() , Neutral;
, Neutral; ![]() , Somewhat Unsupportive;
, Somewhat Unsupportive; ![]() , Extremley Unsupportive;
, Extremley Unsupportive; ![]() , Missing
, Missing
Discussion
The HBI was developed to ultimately reduce the consumption of SSB on campus. The implementation of the HBI has met with little resistance from the UBC community, and the removal of SSB from residence dining locations did not result in any significant revenue loss or compensatory purchasing behaviour. This suggests that environmental intervention initiatives appear to be a viable option that may reduce SSB consumption on post-secondary campuses.
Although elements of the HBI are not unique(Reference Bole16–Reference Strom18); formal evaluation of these initiatives is not publicly available. In 2013, both UCSF(Reference Bole16) and UMHS(17) launched initiatives to remove SSB from on-site cafeterias, food vendors, vending machines, catering and retail locations. UCSF took a campus-wide approach, whereas UMHS targeted their hospitals and health centers, administrative buildings and their medical school. In 2017, the University of Sydney proposed their HBI, using a multipronged approach aiming to (a) phase out the sale of sugary drinks from all campus retail outlets and vending machines, (b) regulate the marketing of sugary drinks on campus, including events run by student clubs and societies and (c) promote healthier beverage options through availability, pricing and product placement programs and provide more water fountains on campus(Reference Strom18).
In comparison, UBC HBI priorities most closely resemble those described by the University of Sydney initiatives, in that both initiatives aim to reshape the beverage landscape on campus using a multipronged approach. Additionally, the University of Sydney most closely resembles UBC, with ~60 000 students; however, there is little publicly available information on the evaluation of the University of Sydney intervention or the UCSF and UMHS initiatives. UCSF and UMHS campuses differ significantly from UBC. UCSF is a small (~3000 students) post-graduate university, with a health-focused curriculum. The UMHS initiative was undertaken only in the medical and health services buildings and not across the whole of the University of Michigan. To date, one study has been published evaluating the UCSF HBI focusing on the health benefits for UCSF staff members(Reference Epel, Hartman and Jacobs19). The workplace ban of SSB sales was associated with a reduction in SSB intake and waist circumference within 10 months and suggests that sales bans offer promising strategy for reducing the harmful health effects of SSB consumption(Reference Epel, Hartman and Jacobs19). The UBC HBI may have similar health benefits for staff and students as the initiative progresses.
In addition to the potential health benefits of banning SSB, the UBC HBI has the potential to shape the health behaviour patterns of UBC students. Behaviour patterns that affect long-term health are often established during the transition from adolescence to adulthood(Reference Small, Bailey-Davis and Morgan30). This period of time is also associated with increased autonomy over dietary choices, such as food purchasing and preparation(Reference Plotnikoff, Costigan and Williams31). Approximately 50% of all adults consume at least one SSB per day, with adults between 20 and 39 consuming the highest levels of SSB(Reference Rosinger, Herrick and Gahche32). Specifically, 65% of college students consume at least one SSB daily(Reference Smith West, Bursac and Quimby33) and SSB intake increases between childhood and young adulthood(Reference Demory-Luce, Morales and Nicklas34). Altering the beverage landscape to encourage healthier beverages choices may aid in the formation of healthier habits during this time as most university students are young adults. However, empirical support for the removal of SSB from school settings in mixed. A Cochrane review of reduced availability of SSB in primary and secondary schools demonstrated a low certainty of evidence based on five studies(Reference von Philipsborn, Stratil and Burns15). While all studies demonstrated reduced overall intake, only three of five studies reached significance. However, the same Cochrane review demonstrated with moderate certainty a significant reduction in SSB intake when there was improved access to low-calorie beverages in the home environment(Reference von Philipsborn, Stratil and Burns15). Post-secondary institutions are a unique environment as a significant number of students live on campus. Residence dining halls most likely fall somewhere between a school and home environment; thus, altering SSB availability may significantly alter consumption. Additional components of the UBC HBI have also shown to significantly alter SSB consumption, including a traffic light labelling system(Reference von Philipsborn, Stratil and Burns15), which suggest the labelling system should be included more widely in future HBI activities.
Loss of revenue is a particular concern when SSB are removed from retail locations and is considered an ‘adverse event’ in interventions designed to reduce SSB consumption in various retail settings(Reference von Philipsborn, Stratil and Burns15). In the current evaluation, the declines in beverage sales observed in the Post-HBI year were comparable with declines observed at locations without red beverage removal and considered within normal revenue fluctuations in the dining halls. Beyond the current study, there is limited evidence on the impact of SSB removal on revenue. One study that looked at revenue following the removal of SSB from a children’s hospital demonstrated altered beverage sales but no significant difference in revenue(Reference Eneli, Oza-Frank and Grover22). These findings are similar to those observed in the current study, suggesting that patrons may choose healthier beverage options when no SSB are available.
The literature suggests that compensatory purchasing behaviours, purchasing SSB from alternative retail locations when their sale or access is limited at a particular location, may occur when access to SSB is limited but not banned(Reference Bauhoff35). Measuring compensatory behaviour is difficult and is a large source of bias in these types of studies(Reference von Philipsborn, Stratil and Burns15). This study is unique in that we have access to point of sales data from the closest retail outlets that continued to sell red beverages following the red beverage removal from the dining hall. No compensatory purchasing of SSB was observed at other retail outlets in the current study, as red beverages accounted for a lower percentage of total sales in convenience stores following the red beverage removal from the dining hall. This suggests that students did not visit these alternative locations to purchase red beverages. However, there are other locations on and off campus where students could have purchased SSB that were not evaluated.
Significant resistance to the proposal of regulating SSB on university campuses has been observed previously. The prevailing student belief is that universities should promote health but not enforce it(Reference Howes, Freeman and Wi20). The least amount of support is often seen for interventions that restrict access to SSB in an adult-centred environment such as a post-secondary campus. Interventions that require higher levels of personal responsibility are favoured(Reference Howes, Freeman and Wi20) as was demonstrated in the current investigation, though the majority of respondents in the current study were neutral or supportive of removing red beverages from retail locations. Additionally, the majority of students were unaware of the red beverage removal months after its implementation. Students may be immune to limited SSB access as many secondary schools have policies in place restricting SSB access, including in British Columbia(36). SSB consumption also appears to be declining in the general population in Canada(Reference Langlois, Garriguet and Gonzalez10) and the USA(Reference Malik, Newman and Hunt11). Increased access to drinking water and reducing the price of healthier beverage alternatives are favoured interventions in the literature(Reference Howes, Freeman and Wi20) and the current study. These types of interventions may be used in tandem with the removal of SSB to promote consumption of healthier beverages.
Limitations
There are several limitations to the current study, including several HBI activities having no formal a priori evaluations such as the tap water campaign, the removal of SSB advertising and removal of red beverages from the campus vending machines. Additionally, point of sales data were used as a proxy for beverage consumption in the red beverage removal evaluations, and we did not evaluate beverage consumption or the potential health impacts in the current study. The UBC campus is ~4 km2, and there are many retail locations at which students can purchase SSB, which were not evaluated in the current study. Additionally, students can freely leave campus and access SSB; therefore, off-campus compensatory purchasing is possible. Student meal plans may also significant influence beverage purchasing patterns in the red beverage removal evaluation. Students living in the first-year residences in the current study are required to purchase meal plans that operate on a declining balance system. Meal plan concerns, such as budgeting or running out of money, may influence beverage choices as students opt for free tap water, without any considerations as to the health benefits.
Future activities of the Healthy Beverage Initiative
The HBI is an ongoing initiative with future activities continuously being planned in partnership with stakeholders and community members. UBC is working on removing promotional material of red beverages from all locations across campus and replacing it with materials advertising healthier beverage options (e.g. water). These materials include but are not limited to beverage cooler wrappings, vending machine wrappings and permanent and temporary signage at all UBC events. This activity aligns with the second aim of the HBI, to promote healthier beverage choices. To increase access to tap water, UBC is mapping all of the current drinking fountain locations and their usage, to determine where additional access to tap water is needed and if wayfinding signage to existing fixtures may improve usage.
We also plan to expand the pilot initiative of removing red beverages from the coolers in residence dining halls to additional locations and focus future evaluations on these new types of retails locations to provide support for expanding the HBI. Piloting this activity in other types of food service locations, beyond residence dining halls, will determine additional challenges that may arise in other food retail locations. Red beverages are also being removed from all vending machines on campus; to date, 30% of the vending machines on campus have been updated, and the changes in vending machine sales will also be examined.
An HBI compliance designation with an accompanying branding logo will be developed that will allow food vendors who operate on campus outside of the key HBI stakeholders to opt in and be recognised as participating in the HBI. This logo will be ubiquitous across campus and during campus events, designed to indicate to patrons that an establishment or event complies with the UBC HBI. This is particularly useful for campus food providers which are not run as part of UBC Food Services (e.g. independent food vendors). UBC HBI is planning outreach activities to encourage the participation of these vendors in the initiative.
Conclusion
The UBC HBI aims to reshape the beverage landscape on campus by encouraging water consumption, promoting healthier beverage choices within the community and modifying the environment to support healthier beverage consumption. To date, the HBI has resulted in a new cold beverage agreement specifically sought to support the activities of the HBI, the removal of red SSB beverages from select retail location(s) on campus and a multimedia campaign to promote tap water consumption. These activities have altered beverage purchasing patterns, are generally supported by the campus community and not led to significant loss of revenue. This suggests that a HBI to modify the beverage landscape may be a viable option for many post-secondary campuses with little negative consequences.
Acknowledgements
Acknowledgements: The authors would like to thank the HBI stakeholders for their support and contribution to this initiative. The authors would also like to thank the research assistants who aided with survey data collection. Financial support: There is no specific funding associated with this project. K.M.D.S. is funded by a MITACS Accelerate award. G.F. receives support through a Canadian Institutes of Health Research-Public Health Agency of Canada (CIHR-PHAC) Chair in Applied Public Health. These funding bodies had no role in the design of the study and collection, analysis, and interpretation of data, and in writing the manuscript. Conflict of interest: None. Authorship: K.M.D. conceived of the manuscript idea and K.M.D. and G.F. developed the idea. S.K., M.B. and M.D. developed and implemented the HBI. K.M.D., S.K. and M.B. collected and analysed the data. K.M.D. and G.F. wrote the manuscript. All authors critically reviewed, provided feedback and approved the final manuscript. Ethics of human subject participation: This study was conducted according to the guidelines laid down in the Declaration of Helsinki, and all procedures involving research study participants were approved by the UBC Office of Research Ethics. Verbal informed consent was obtained from all participants. Verbal consent was witnessed and formally recorded.


