


Today’s teenagers are tomorrow’s adults, and the foods they eat are important determinants of lifelong health. Adolescence is a period of rapid physiological growth and maturation that coincides with increased social and economic independence(Reference Das, Salam and Thornburg1). Dietary patterns during adolescence are associated with risk of chronic disease later in life and often persist into adulthood(Reference Mikkilä, Räsänen and Raitakari2,Reference Movassagh, Baxter-Jones and Kontulainen3) . Adolescent weight status also tends to carry through to adulthood(Reference Singh, Mulder and Twisk4). Optimal nutrition during adolescence is therefore important for both physiological development and the establishment of healthy dietary habits(Reference Das, Salam and Thornburg1). However, the majority of Australian adolescents do not meet recommendations for fruit and vegetable intake(Reference Morley, Scully and Niven5) and derive an estimated 41 % of daily energy intake from discretionary food and drinks that contribute excess energy, sodium, sugar and/or saturated fat to the diet(6). On school days, adolescents consume over a third of their daily energy at school and secondary schools are therefore a prime environment for encouraging the development of healthy dietary habits(Reference Bell and Swinburn7,Reference Bell and Swinburn8) .
The Australian government does not provide school meals or subsidise food in schools, although most Australian schools have a canteen offering a range of meals, snacks and beverages for purchase(Reference Bell and Swinburn8). The National Healthy School Canteen Guidelines were established in 2010 with the aim to improve the overall nutritional quality of foods and beverages sold in Australian school canteens(9). Each state and territory has a region-specific policy which is mandated (but not enforced) for all government schools in most jurisdictions(Reference Wu, Berg and Neeson10). Each policy is underpinned by the Australian Dietary Guidelines(11), and most adopt a traffic light system for classifying food and beverages into three groups to facilitate practical application by schools. A ‘green’ classification (or ‘everyday’ food and drink, in the state of New South Wales (NSW)) is assigned to items that should dominate the menu. These items are based on the core food groups (fruits, vegetables, wholegrains, meat or alternatives, and dairy or alternatives) and adhere to maximum portion sizes and allowances for sugar, sodium, saturated fat and/or fibre per serve(9,Reference Wu, Berg and Neeson10) . ‘Amber’ foods designate items to ‘select carefully’ or ‘choose sometimes’ (or ‘occasional’ in NSW) and have some nutritional value but contain moderate amounts of energy, saturated fat, sugar and/or sodium, while ‘red’ foods contribute excessive amounts of these nutrients and are not recommended for sale in school canteens(9). Menu composition recommendations vary between policies, the most stringent being that the menu must consist of ≥75 % ‘everyday’ options (introduced in NSW in 2016(12)), and the least stringent being ≥50 % green (implied by the national guidelines and many region-specific policies(9,Reference Wu, Berg and Neeson10) ). Common to all policies, however, is that ‘red’ foods and some specific energy-dense, nutrient-poor products such as confectionery and sugar-sweetened drinks not be sold(9,Reference Wu, Berg and Neeson10) .
Although the guidelines apply to both primary and secondary schools, most research assessing canteen menu compliance has been conducted in primary schools. Research that has included secondary schools has been limited to specific states(Reference de Silva-Sanigorski, Breheny and Jones13,Reference Myers, Sauzier and Ferguson14) , and the sole nationwide audit of secondary school canteen menus conducted in 2012 only assessed menus that could be found online(Reference Woods, Bressan and Langelaan15). This limited research in Australian secondary schools found poor compliance with guidelines and demonstrated canteen offerings to be of poorer nutritional quality than in primary schools(Reference Wu, Berg and Neeson10,Reference Woods, Bressan and Langelaan15) . For example, in a 2009 audit of a convenience sample of Victorian primary and secondary schools from primarily disadvantaged areas, no canteen menus complied with the guideline to have at least 50 % green items, only one had no red items available, and over a third offered confectionery or sugar-sweetened soft drinks for purchase(Reference de Silva-Sanigorski, Breheny and Jones13). In Western Australia, a similar audit of online canteen menus from government schools in 2017 revealed that while most consisted of at least 60 % green items in accordance with the state’s school food policy, a majority also offered banned red items for purchase(Reference Myers, Sauzier and Ferguson14).
The National Healthy School Canteen Guidelines recommend that as well as dominating the menu, green items should be promoted as healthy, tasty and good value options(9). Some region-specific policies also recommend that menus be colour coded to encourage healthier choices(Reference Myers, Sauzier and Ferguson14). In addition to identified shortcomings in the provision of healthier menu items, previous studies of Australian school canteens indicate room for improvement in promotional strategies and pricing of healthier options. For example, audits of canteen menu pricing in both primary and secondary schools have demonstrated that items of higher nutritional quality tend to be more expensive than less healthy options(Reference Woods, Bressan and Langelaan15–Reference Billich, Adderley and Ford17), and a minority of primary schools in one region surveyed in 2013 included only healthy foods in meal deal promotions(Reference Yoong, Nathan and Wyse18).
Given that most research has been conducted in specific states, has not focused on secondary schools exclusively, and has shown canteen offerings to be of poorer nutritional quality in secondary schools than primary schools, the present study aimed to provide a nationwide picture of canteen menus in Australian secondary schools. We audited canteen menus from the two most recent waves of a nationally representative cross-sectional survey of secondary schools in which school representatives directly supplied the canteen menus. First, we aimed to estimate the traffic light profile of menu items according to the National Healthy School Canteen Guidelines. We examine the consistency of the nutritional quality of canteen offerings between 2012–2013 and 2018 (during which time region-specific guidelines were either established or updated in six out of eight Australian states(Reference Wu, Berg and Neeson10)), and by school characteristics and menu sectors to identify opportunities for improvement. The first survey wave analysed in the present survey also corresponds with the only nationwide audit of compliance with school canteen guidelines in secondary schools of which we are aware(Reference Woods, Bressan and Langelaan15). Second, we estimated the proportion of secondary schools that met guidelines for the availability of green and red items and that offered specific food and beverage products of interest (i.e., those of lower nutritional quality (e.g., sugary drinks, fried potato products and confectionery) and higher nutritional quality (e.g., raw vegetables, fresh fruit and plain water)). Finally, we describe the strategies used to promote different menu items, including the relative price of healthier v. less healthy items and other promotional strategies (e.g., meal deal promotions, menu labelling).
Methods
Sampling of schools
We used samples of secondary schools from the two most recent waves of the National Secondary Students’ Diet and Activity surveys conducted in 2012–2013 and 2018. The repeated cross-sectional survey employed a stratified probability sampling procedure whereby schools were stratified by education sector (government, Catholic and independent) within each state and territory and randomly selected from each sector to ensure the sample reflected the distribution of schools in each strata. The school response rate to participate in the survey was 21 % in 2012–2013 and 8 % in 2018. The surveys were administered by an independent survey agency and approved by an Institutional Human Research Ethics Committee, relevant state/territory education authorities and school principals.
School characteristics
The postcode of each participating school was used to classify schools by location (metropolitan or regional/remote, Australian Statistical Geography Standard Remoteness Structure(19)) and to assign a measure of socio-economic status (SES, Socio-economic Index for Areas) of relative socio-economic disadvantage(20). School SES was categorised into low, mid and high according to national tertiles. The number of students enrolled in each participating school was recorded from the ‘My School’ website (administered by the Australian Curriculum, Assessment and Reporting Authority(21)). Enrolment figures from 2014 (the earliest year for which data were provided) were assigned to schools participating in the 2012–2013 survey, and figures from 2018 were assigned to schools participating in the 2018 survey. Schools were classified into size tertiles based on the distribution of enrolment numbers in the participating schools (small: 91–663 enrolments, medium: 664–1020 enrolments and large: 1021–2728 enrolments).
Menu assessment
Participating schools were asked to provide a copy of their canteen menu. A menu audit was conducted to classify menu items based on the National Healthy School Canteen Guidelines (2014), using only the information provided on menus(Reference Reilly, Nathan and Wolfenden22). The project team developed a detailed systematic protocol for extracting and coding data from school canteen menus in consultation with a qualified dietitian experienced in canteen menu assessment. An iterative pilot study approach was adopted, whereby two authors (AH and CG) first jointly coded three canteen menus and then independently coded a further subset of ten canteen menus to refine the protocol and establish interrater reliability. A further twenty-eight menus were each coded by two of three authors (final year undergraduate students of Nutrition Science: RB, MC and IR). This process resulted in double coding of 16 % of canteen menus, with the remaining menus coded by one author (RB, MC or IR). Interrater reliability for the traffic light and product category decisions was satisfactory in each set of double coded menus (80·7–100 % agreement, Krippendorff’s α = 0·79–0·93). Discrepancies in coding decisions were resolved by discussion between coders and arbitration by a third (AH).
Traffic light classification
Each menu item was assigned a green (‘always on the menu’), amber (‘select carefully’) or red (‘not recommended on the menu’) traffic light classification. If the menu provided insufficient information for a decision between adjacent categories, the item was coded as ‘inconclusive green-amber’ or ‘inconclusive amber-red’ to quantify the degree of uncertainty. For example, the national guidelines class low or reduced-fat milk as green while full-fat milk is classed as amber. A milk product was assigned a classification of ‘green-amber’ if the fat content could not be determined from information provided on the canteen menu. Likewise, some items were assigned a traffic light based on ingredients, fillings, toppings or cooking methods. For example, a chicken sandwich filled with skinless chicken breast was classified green, while a sandwich containing processed chicken loaf was classified amber; however, this was commonly not specified in which case a ‘chicken sandwich’ was classed as ‘green-amber’.
Product category classification
Menu items were classified into five product sectors: hot meal foods, cold meal foods, breakfast items, snack foods and drinks. It was also recorded whether a menu item satisfied any of the following criteria: contains confectionery, contains raw vegetables, contains a serve of dairy or dairy alternative, contains raw fruit, ‘fried’ potato product (including commercially available oven bake chips, typically high in fat and fried during manufacture), plain water, plain milk and sugary drinks. Several different definitions were used to classify sugary drinks due to differences in guidelines between states (sugary drinks ‘all’, encompassing soft drinks, fruit drinks, slushies, flavoured water, sports drinks, energy drinks, iced tea, 100 % juice and flavoured milk; and narrower categories excluding 100 % juice and/or flavoured milk).
Price, frequency of availability
The price of each menu item was recorded, and a frequency weight was derived for each item to allow its contribution to analysis to be weighted by the item’s availability. For example, an item available during terms 1 and 4 only was assigned a frequency weight of 0·5; an item available on Fridays only was assigned a frequency weight of 0·2.
Promotion strategies
For each item, the coder recorded whether the item was promoted and the strategy used. Eligible strategies were (a) part of a ‘meal deal’ or having a special price, (b) labelled with a smiley face or other icon, (c) labelled as ‘tasty’, a ‘good value’ option or a ‘smart choice’, (d) highlighted using graphic design features or (e) colour coded with a green traffic light or marked as an ‘everyday’ option.
Provision of health indicators
Information on whether each school canteen menu labelled items with traffic light colour coding or other classification scheme (e.g., ‘everyday’ v. ‘occasional’ foods, or Health Star Ratings whereby items are assigned a rating of 0·5 to 5 stars, indicating lowest to highest nutritional quality within their category(23)) was collected. Accuracy of the labels was not assessed.
Treatment of items with unspecified varieties
Where multiple variations of an item were listed (e.g., flavoured milk: chocolate, strawberry and vanilla), each item was counted individually. Many menus did not specify the varieties of some classes of items (e.g., ‘sandwiches: assorted fillings’). Failing to account for the full set of these menu items could have biased estimates of the overall nutritional quality of the menus. Therefore, for each type of product where varieties were not specified (sandwiches, salads, ice creams, soups, toasted sandwiches, sushi, drinks and pasta), a set of items representing the average number of items in each traffic light category and the average price within each traffic light category were identified from menus where the varieties of those products were fully specified. This average set was then imputed in menus where the original varieties were not specified to more accurately represent the proportion of items across traffic light categories and their prices. From a total of 21 501 menu items assigned a traffic light, 2604 items (12·1 %) were imputed using this methodology.
Statistical analyses
Data were entered using Microsoft Excel and collated and analysed using Stata MP 16.0. Both unweighted and weighted (by state and education sector to reflect the population of Australian secondary schools) proportions are reported, and all regression analyses applied sample weights. For analysis, all items coded as ‘inconclusive green-amber’ or ‘inconclusive amber-red’ were conservatively assumed to be of higher nutritional quality (green and amber, respectively) as decided a priori and in line with previous menu assessment protocols(Reference Myers, Sauzier and Ferguson14). Results were robust to sensitivity analyses applying frequency weights to account for some menu items not being available everyday (results not reported).
Using menu items as the unit of analysis, a weighted logistic regression analysis was conducted to examine the odds of items being classified as green by survey wave, product sector and school characteristics (SES, location, state, education sector and size) and was repeated to examine the odds of items being classified as red. To examine promotion and pricing by traffic light profile, logistic (predicting the odds of an item being promoted) and linear (predicting item price) regression analyses were conducted adjusting for survey wave, product sector and school characteristics.
The following information was aggregated on a per school basis: (i) meeting the guideline for at least 50 % green items, (ii) meeting the guideline for excluding red items, and for schools that promoted any products on their menu, (iii) meeting the guideline for promoting only green items and (iv) promoting any red items. For all schools included in the menu analysis, information about (v) the presence of the following specific items on the canteen menu was also aggregated: ‘healthier’ options (items containing fresh fruit, items containing raw vegetables, items containing a serve of dairy, plain milk and plain water) and ‘less healthy’ options (items containing confectionery, sugary drinks (all sugary drinks and sugary drinks excluding 100 % juice and/or flavoured milk) and ‘fried’ potato products). Separate logistic regression analyses were conducted to examine whether survey wave or school characteristics predicted the probability of each of these school-level menu characteristics.
Results
Sample characteristics
Of the 300 participating secondary schools, 244 provided a copy of their canteen menu (81·3 % response rate). There were no significant differences in school characteristics between those that provided v. did not provide a copy of their canteen menu, except for the distribution by state and education sector (NSW government schools did not provide menus in 2012–2013 as this aspect of the protocol was not approved by the NSW Department of Education, see online Supplemental Materials for comparison). The majority of schools included in the menu analysis were government schools and from metropolitan areas, with an average of 944 enrolments (Table 1).
Table 1 Characteristics of schools included in menu analysis†
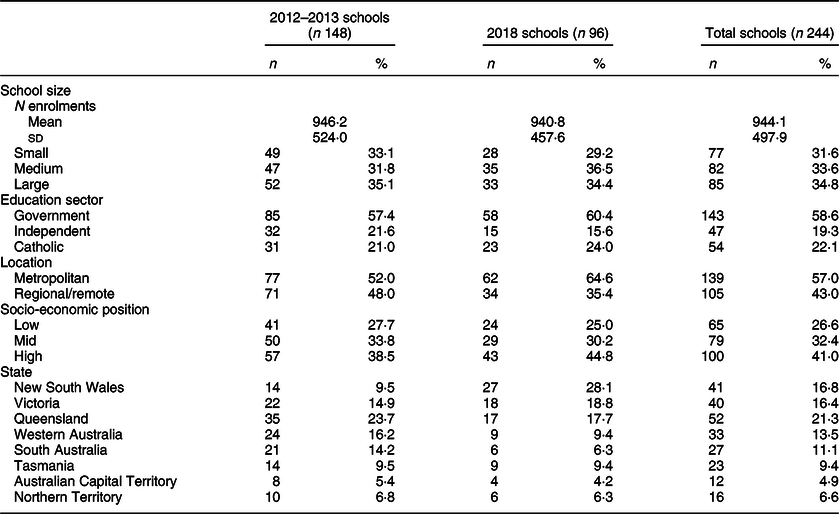
† Data are unweighted. Percentages may not sum to 100 % due to rounding.
Characteristics of menu items
A total of 21 798 menu items were extracted from school canteen menus and 21 501 were classified according to the traffic light scheme (1·4 % could not be categorised due to insufficient information). The majority of items could be confidently coded as green, amber or red (62·1 %), while the remainder were inconclusively classified as ‘green-amber’ or ‘amber-red’ (and were assumed green and amber for primary analyses, respectively). There was some variation across product sectors: 56·3 % of hot meal items, 57·1 % of cold meal items, 66·2 % of snacks, 71·4 % of breakfast items and 73·4 % of drinks were conclusively coded. The traffic light profile of items across product sectors assuming inconclusive items were of lower nutritional quality (amber and red, respectively) is reported in online Supplemental Materials. School menus contained an average of 89·1 items (sd = 39·8, range 12–242), the majority of which (89·8 %) were always available, while the remainder were available on selected weekdays or were part of a seasonal menu.
Table 2 reports the prevalence of menu items by traffic light category overall and by survey wave and product sector. Approximately half of all items were classified as green (50·7 %), 30·2 % amber, and 19·1 % red, which was similar across survey waves. In logistic regression analyses, neither survey wave nor school characteristics (SES, location or size) were significantly associated with the proportion of green or red items (results not shown). However, the proportion of green and red significantly varied across product sectors: cold meal foods had significantly higher odds of being classified as green (69·4 % of cold meal items) and lower odds of being classified as red (<1 % of cold meal items; adjusted OR (AOR) for items in all other product sectors all ≤0·42, P < 0·001 (green) and all ≥37·89, P < 0·001 (red)). Snacks and drinks had the highest odds of being classified as red (approximately 40 % of snacks and drinks, respectively) and snacks had the lowest odds of being classified as green (27·8 % of snack items).
Table 2 Characteristics of items on school canteen menus
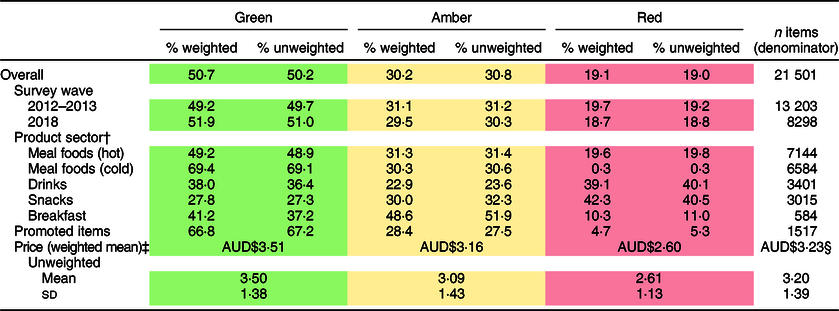
† Relative to cold meal foods, all other product sectors had significantly lower odds of being classed as green and significantly higher odds of being classed as red (all P <0·001).
‡ Relative to green items, amber and red items were significantly lower in price (both P <0·001).
§ n 20 848 as price was not listed or decipherable for some items (3.0 % missing).
Of all menu items, 7·1 % were promoted (Table 2). The most common promotional strategy for menu items was to colour code them as green or highlight them as a ‘smart’, ‘everyday’ or ‘healthy’ option (74·2 % of all promoted items). A further 16·7 % of all promoted items were part of a meal deal, 6·9 % were marked with a smiley face icon and 1·4 % were highlighted with graphic design features. Although green items made up the majority of promoted items on canteen menus (66·8 %, followed by 28·4 % amber and 4·7 % red), they were significantly more expensive on average (m = AUD$3·51) than both amber (m = AUD$3·16, b = −0·17 (95 % CI −0·24, −0·11), P < 0·001) and red items (m = AUD$2·60, b = −0·31 (95 % CI −0·39, −0·24), P < 0·001, Table 2).
Menu evaluation by school
Characteristics of school canteen menus are summarised in Table 3. Approximately half of the menus evaluated met the guideline of consisting of at least 50 % green items, but only one school in each survey wave did not have any red items available for purchase. Of the 42 schools that promoted any menu items, only three across both survey waves promoted only green items, while the majority (54·8 %) promoted at least one red. Thirty-three menus (approximately one in ten) used health indicators. The most common ‘health indicator’ scheme was traffic light icons (48·5 %), while 36·4 % used ‘smiley faces’ or another icon to indicate healthier options and 12·1 % used ‘everyday’ or ‘occasional’ labels. One school used the Health Star Rating scheme.
Table 3 Characteristics of canteen menus (per school)
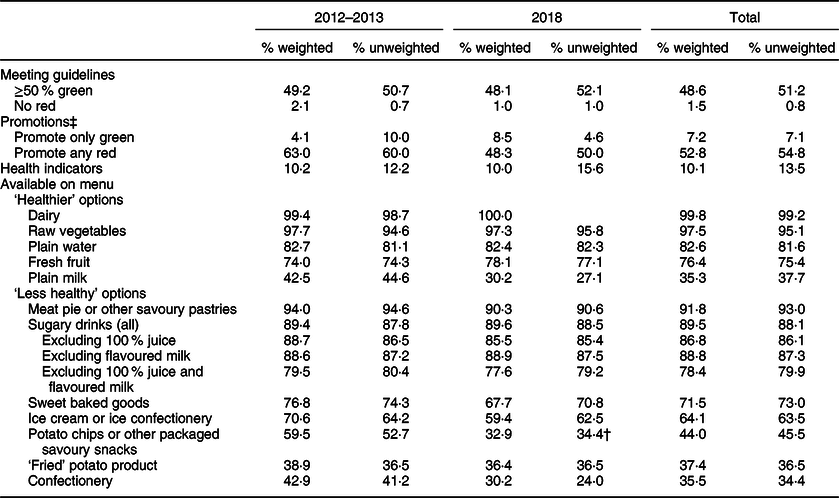
†P <0·05 for comparison with 2012–2013, all other yearly comparisons P >0·05. n 148 for 2012–2013, n 96 for 2018, n 244 total for all rows, except ‡n 20 for 2012–2013, n 22 for 2018, n 42 total for schools with ‘promotions’.
In terms of specific menu items (listed in descending order of frequency in Table 3), the availability of most discretionary product categories declined between 2012–2013 and 2018, but comparisons were not statistically significant unless otherwise stated. For example, 42·9 % of school menus offered some form of confectionery in 2012–2013, which declined to 30·2 % in 2018; 59·5 % offered potato chips or other packaged savoury snacks in 2012–2013, which dropped to 32·9 % in 2018 (AOR = 0·36 (95 % CI 0·17, 0·78), P = 0·01). There was a decline in the proportion of schools offering sweet baked goods, meat pies (or other savoury pastries) and ice creams (or other iced confectionery) between survey waves; however, the majority of schools still offered these products in 2018. Over one-third of schools listed a fried potato product on their canteen menu in each survey wave. Across survey waves, 89·5 % of canteens offered sugary drinks for purchase, but this figure was lower when 100 % juice and flavoured milks were not classified as sugary drinks (78·4 %). Nearly all schools listed items containing a serve of dairy or raw vegetables (≥97·5 %), and three-quarters offered fresh fruit (76·4 %). Most schools offered plain water for purchase (82·6 %); however, only 35·3 % offered plain milk, and there was little change in the availability of these products between survey waves.
Logistic regression analyses revealed that large schools had lower odds of meeting the guideline of having a menu consisting of at least 50 % green items than small schools (AOR = 0·25 (95 % CI 0·09, 0·72), P = 0·01). Large schools also had higher odds of offering plain milk (AOR = 4·21 (95 % CI 1·37, 12·89), P = 0·01) and medium schools had lower odds of offering potato chips or other packaged savoury snacks (AOR = 0·36 (95 % CI 0·13, 0·98), P < 0·05) than small schools. Medium (relative to small) schools and those in the least disadvantaged (relative to the most disadvantaged) areas had lower odds of offering sugary drinks (AOR = 0·29 (95 % CI 0·09, 0·94), P = 0·04; AOR = 0·24 (95 % CI 0·07, 0·79), P = 0·02). Schools in the least disadvantaged areas also had lower odds of offering meat pies and other savoury pastries than those in the most disadvantaged areas (AOR = 0·14 (95 % CI 0·02, 0·85), P = 0·03), and regional schools were significantly more likely to offer plain water than those in metropolitan areas (AOR = 3·60 (95 % CI 1·19, 10·86), P = 0·02). Neither the probability of schools offering red items nor the probability of listing other specific menu items was significantly associated with survey wave or other school characteristics (results not shown).
Discussion
The present study assessed the nutritional quality of Australian secondary school canteen menus against the National Healthy School Canteen Guidelines(9). While 50 % of schools had menus consisting of mostly healthier (‘green’) items, almost all schools also offered ‘red’ items, contrary to advice provided in region-specific policies and national guidelines. These figures were consistent between survey waves, despite the introduction and revision of region-specific policies in the interim. However, as a large proportion of items could not be definitely assigned to one of three traffic light categories (and were subsequently assigned to the more ‘healthy’ traffic light for analysis), the current study is likely to overestimate the nutritional quality of school canteen menus in Australian secondary schools.
The poor adherence to the guideline to exclude red items from canteen menus evidenced in the present national study extends more localised research conducted to date in Australian secondary schools. In a recent audit, only 8 % of an online sample of twenty-five government secondary schools in Western Australia excluded red items from canteen menus, which was significantly lower than in primary schools(Reference Myers, Sauzier and Ferguson14). Other studies have also found secondary school canteens to have a less healthy nutritional profile than primary schools(Reference Woods, Bressan and Langelaan15 ,Reference Hills, Nathan and Robinson24) . Secondary schools may offer products of lower nutritional quality due to demand from students or lower parental volunteer support, resulting in greater reliance on ultra-processed heat-and-serve products(Reference Myers, Sauzier and Ferguson14 ,Reference Drummond and Sheppard25) . In addition, the greater freedom to leave school grounds and means to purchase food and drinks externally among secondary school students may exert pressure for canteens to continue to offer less healthy products that appeal to students to maintain profits (or at least remain financially viable(Reference Drummond and Sheppard25)). Cost has been found to be a significant barrier to offering healthier options(Reference Ronto, Rathi and Worsley26). Previous research in primary school canteens has found menus to be of higher nutritional quality in schools with larger student numbers and in areas of higher SES (characteristics which may be proxies for school resources(Reference Yoong, Nathan and Wyse18)). In the present study, we found that schools in the most disadvantaged areas were more likely to offer sugary drinks and savoury pastries than those in the least disadvantaged areas; however, smaller schools were more likely to offer mostly green items than larger schools.
Consistent with other Australian research conducted in specific states or solely in primary schools(Reference Myers, Sauzier and Ferguson14 ,Reference Yoong, Nathan and Wyse18) , we found greater adherence to the guideline that green items should ‘dominate’ the canteen menu than the guideline that red items should be not be sold. Supporting schools to replace common red items with healthier alternatives may therefore be more useful than increasing the overall range of healthier items. Our analysis of the traffic light profile across menu sectors provides some further guidance for where these efforts might be most fruitful. We found that snacks and drinks had the least healthy profiles. A positive finding was that most schools offered items containing raw vegetables or fresh fruit, which in the latter case likely indicates the presence of healthier snack alternatives. However, the dominance of canteen snack offerings by less healthy options (such as potato chips, ice creams and sweet baked goods, which a majority of menus offered) conveys the meta-message that these products are an acceptable part of a healthy diet and suitable for everyday consumption(Reference Bell and Swinburn7). The same could be said for the dominance of drinks menus by amber and red options. Even by the most restrictive definition (excluding 100 % juice and flavoured milk) the majority of canteen menus in the present study listed sugary drinks. While a large proportion of menus also offered plain water (and less commonly, plain milk), sugary drink options may be especially appealing to students given that drinking water is freely accessible in most schools(Reference Ooi, Yoong and Sutherland27).
The healthiest sector of canteen menus was cold meal foods, of which 70 % were classified as green and <1 % red on average. However, meal items were more likely than snack, drink or breakfast items to be ‘inconclusively’ categorised due to the potential for wide variability in ingredients, fillings, toppings or cooking methods that were not specified in canteen menu text. Therefore, the overall nutritional quality of meal items is especially likely to be overestimated. Although hot meal foods were moderately healthy (approximately 50 % green and 20 % red on average), the majority of school canteen menus listed meat pies or other savoury pastries that were mostly classified as red. Savoury pastry products may be perceived as a classic staple of the Australian school canteen; however, many are high in saturated fat and sodium and their availability on secondary school menus competes with more nutritious meal options. Therefore, another target for improving canteen menu offerings may be to encourage the development of healthier hot meal options or update policies to limit the availability of savoury pastries to several days per week as in Western Australia(Reference Myers, Sauzier and Ferguson14).
Another key finding of the present study is that healthier items were significantly more expensive than less healthy items. This is consistent with previous research in Australian primary and secondary school canteens(Reference Woods, Bressan and Langelaan15–Reference Billich, Adderley and Ford17). With price and value for money being key influences on food purchasing in school settings(Reference McEvoy, Lawton and Kee28), and evidence that interventions to reduce the price of fruits, vegetables and healthier snacks in schools resulted in increased sales of those items(Reference French, Story and Jeffery29 ,Reference French, Jeffery and Story30) , revising pricing strategies may help to encourage purchase of healthier options by secondary school students in Australia. Additional support to schools to develop strategies for reducing the price differential between healthier and less healthy menu options may therefore be useful. For example, reducing the price of healthier items may be subsidised by increasing the price of less healthy items, and this may help to shift demand towards healthier products. Although only a small proportion of schools adopted menu-based promotional strategies in the present study (e.g., offering meal deals, graphic design features or special icons), healthier items were more likely to be promoted than less healthy amber or red items. However, we also found that few schools exclusively promoted green items, and several promoted red items, consistent with previous findings in primary schools(Reference Yoong, Nathan and Wyse18). Increasing the use of menu-based promotional strategies to increase student demand for healthier options may enable an economy of scale to make bulk purchase and preparation of healthier foods viable and therefore address the price differential.
The present findings demonstrate a need for higher standards for the implementation of school food policies in secondary schools around Australia and show little improvement from 2012–2013 (coinciding with the last nationwide audit of secondary school canteen menus in Australia) to 2018 (following the introduction and revision of policies in many Australian states). Some state policies are mandated and impose higher quotas for the proportion of healthier items than those implied by the national guidelines(Reference Wu, Berg and Neeson10). These differences may at least partially underlie the variation in nutritional quality of canteen offerings between jurisdictions found in previous research(Reference de Silva-Sanigorski, Breheny and Jones13–Reference Woods, Bressan and Langelaan15); however, we found that the majority of secondary schools in Australia did not meet even the less stringent non-mandated national guidelines. Instead, differences are likely to be more strongly attributable to additional implementation support in some jurisdictions rather than minor differences in the policies themselves(Reference Bell and Swinburn7). This is consistent with qualitative research involving canteen stakeholders suggesting that lack of support and resources negatively impact compliance(Reference Drummond and Sheppard25 ,Reference Ooi, Yoong and Sutherland27 ,Reference Abery and Drummond31) . In a randomised controlled trial in one region of NSW, canteen menus in schools provided with additional implementation support were more likely to be policy-compliant, which was maintained at post-programme follow-up(Reference Wolfenden, Nathan and Janssen32 ,Reference Wolfenden, Nathan and Reilly33) . In schools provided with implementation support, canteen sales were lower in fat than in control schools and revenue was not negatively impacted(Reference Wolfenden, Nathan and Janssen32). In Western Australia, an external organisation in partnership with the Department of Education provides training and workshops for canteen staff, parents and school staff; audits canteen menus and administers an accreditation programme to reward schools for healthy food policy compliance(34). Only 13 % of stakeholders surveyed in this state reported that they found the food policy difficult to implement(Reference Pettigrew, Talati and Sauzier35). Government funding to establish support initiatives in other jurisdictions using the model provided by existing trials may be useful. In addition, ongoing compliance monitoring to ensure that nutrition is prioritised among the competing commitments of school principals and canteen managers may help to achieve higher standards of nutrition in secondary school canteens across Australia.
Strengths of the present study were that we used national samples of secondary schools and applied population weighting to produce estimates of the nutritional quality of school canteen menus. The large samples allowed comparison of menu characteristics by school size, socio-economic disadvantage and location, and we analysed differences in canteen menu compliance over time. Sourcing menus directly from schools circumvented potential sampling bias that may arise when samples are limited to canteen menus available online (potentially more common among larger schools or those with better-resourced canteen services). Although there was a high response rate for the provision of canteen menus, the response rate for the survey as a whole was low. There were systematic differences between survey waves attributable to government schools from NSW not providing menus in 2012–2013. This omission may have biased our findings given differences in canteen menu policies and implementation support between jurisdictions, although we controlled for school characteristics including education sector and state, and canteen menus in NSW government primary and secondary schools have been previously shown to have a similar nutritional profile to those in most other states of Australia(Reference Woods, Bressan and Langelaan15). Our assessment involved comparing the price of all menu items and was therefore more comprehensive than previous research in secondary schools comparing the price of single items (e.g., the cheapest salad v. the cheapest meat pie as exemplars of healthy and less healthy foods(Reference Woods, Bressan and Langelaan15 ,Reference Billich, Adderley and Ford17) ). We adopted a brief menu audit methodology to assess the traffic light profile of menu items that involved making assumptions about ingredients and preparation methods. This approach was deemed most appropriate due to the large number of canteen menus sourced and has been demonstrated to be an accurate and resource-efficient alternative to a more comprehensive menu audit involving seeking additional information about ingredients, nutrient composition and cooking procedures from canteen staff(Reference Reilly, Nathan and Wolfenden22). Nonetheless, our estimates are likely to be biased towards a more positive picture of the nutritional quality of school canteen menus due to ‘inconclusively’ categorised menu items being assigned to the ‘healthier’ category for analysis. Our assessment of the promotion of different food and drink items was also limited to strategies that were evident in the menu text supplied by schools. In previous research, interviews revealed that in situ promotional strategies in school canteens were commonly used (such as placing certain items at eye level to encourage purchase)(Reference Yoong, Nathan and Wyse18). However, few canteen managers reported exclusively promoting ‘healthier’ items(Reference Yoong, Nathan and Wyse18), which mirrors our findings.
Conclusions
The brief menu audit methodology (and associated assumptions) and the low school response rate warrant caution in interpreting the results of the present study. These limitations aside, the results illustrate opportunities for improvements to be made in the availability and promotion of healthier options and the elimination of less healthy ones in Australian secondary school canteens. This may be achieved with greater resourcing of implementation support and stronger monitoring and enforcement of existing policies. The school canteen provides a prime opportunity to foster healthy food and beverage consumption and lifelong healthy eating habits among adolescents, but additional support is needed to make the most of this opportunity.
Acknowledgements
Acknowledgements: We are grateful to Megan Sauzier (Western Australian School Canteen Association) and Gael Myers (Cancer Council Western Australia) for feedback and advice on canteen menu coding; Andrea Schmidtke, Jane Martin (Obesity Policy Coalition, Cancer Council Victoria) and Wendy Watson (Cancer Council New South Wales) for feedback on the manuscript; and Elizaveta Ilchenko (Centre for Behavioural Research in Cancer) for validation. Financial support: The National Secondary Students’ Diet and Activity (NaSSDA) surveys are principally funded by State Cancer Councils through Cancer Council Australia. Additional funding support was received from the National Heart Foundation of Australia and the State and Territory Government Health Departments for the 2012–2013 survey wave, and from the South Australian Health and Medical Research Institute for the 2018 survey wave. Conflict of interest: There is no conflict of interest. Authorship: A.H., A.M., B.M., M.S., H.D. and M.W. designed the study, A.H., C.G., R.B., M.C. and I.R. ran the study, A.H. analysed the data and prepared the manuscript and all authors reviewed and approved the manuscript. Ethics of human subject participation: The current study was conducted according to the guidelines laid down in the Declaration of Helsinki and all procedures were approved by Cancer Council Victoria’s Institutional Research Ethics Committee, participating school principals and relevant educational authorities.
Supplementary material
For supplementary material accompanying this paper visit https://doi.org/10.1017/S1368980020003535


