


Overweight in adolescence is considered a public health problem because of the immediate implications on physical, social and mental health, and long-term effects, such as the development of non-communicable chronic diseases in adulthood(1). The prevalence of overweight in Brazilian adolescents is increasing. According to a previous study on the cardiovascular risk factors in adolescents, 25·5 % of the Brazilian adolescents are overweight(Reference Bloch, Klein and Szklo2). Several epidemiological studies have demonstrated the importance of dietary habits in the development of overweight and disease(Reference Willett, Howe and Kushi3–5). Inadequate dietary habits may favour the weight gain and lead to the development of overweight(6).
Most dietary habits are formed and established during adolescence. This is considered a risk period for the development of overweight(Reference The, Suchindran and North7). Diet is a process that involves the consumption of different foods or food groups simultaneously, with a complex interaction between nutrients; a study on dietary patterns will help determine the effect of the combination of foods and nutrients on health outcomes and disease(Reference Kristiansen, Lande and Sexton8,Reference Azevedo, Diniz and Monteiro9) .
Therefore, identifying the dietary patterns of adolescents and their longitudinal association with nutritional status is important to determine the impact of dietary habits on nutritional status, over time, and to ensure that interventions and policies in the prevention of excess weight are developed. However, studies that assess the dietary patterns and nutritional status of adolescents in Brazil are limited, and most have a cross-sectional design(Reference Borges, Marchioni and Levy10,Reference Cunha, Costa and De Oliveira11) . No previous longitudinal studies have examined the impact of dietary patterns on the nutritional status of adolescent students in Brazil.
Accordingly, this study aimed to identify dietary patterns and evaluate their influence on the nutritional status of adolescents participating in a longitudinal study in a city of Northeast Brazil.
Methods
A longitudinal epidemiological study was conducted using the data from the Longitudinal Study on Sedentary Behavior, Physical Activity, Dietary Habits and Health of Adolescents (LONCAAFS), which started in 2014. The LONCAAFS was conducted in sixth-grade adolescents, aged 10 to 14 years (mean 12·02 years), from the public schools (municipal and state) in the municipality of João Pessoa. The sample was monitored annually until 2017 in order to analyse the inter-relationships between sedentary behaviour, physical activity, diet and health.
The following parameters were taken into account to calculate the sample size: size of the reference population (9520 sixth-grade adolescents); the prevalence of the outcome equal to 50 %, to determine the largest possible sample size with the same percentage error; a CI of 95 %, acceptable absolute error of four percentage points, and a design effect equal to 2. Based on these parameters, the minimum sample size was 1130 adolescents. This number was increased by 40 % to compensate for possible losses and refusals, resulting in a final sample of 1582 adolescents. Subsequently, the sample power was calculated for the present study, which was 99 %.
Selection of sample was performed using single-stage cluster sampling: 28 schools (14 municipal and 14 state schools) were selected, proportionally distributed according to the geographic location and the number of students enrolled in the sixth grade in 2014. In the selected schools, all students in the sixth-grade classes were invited to participate in the study.
Adolescents outside the age group of interest in the study (below 10 and above 14 years in 2014), with a disability that prevented or limited the practice of physical activity or response to the questionnaire, who were pregnant, whose anthropometric measurements (height and BMI) were not obtained, and who did not respond to the 24-h recall survey, were excluded.
In 2014, the study sample initially consisted of 1431 adolescents. Between 2014 and 2015, approximately 17 % of the sample were lost to follow-up; between 2015 and 2016, 15 %; and between 2016 and 2017, 13 %. Approximately 46 % of the total sample were lost to follow-up at the end of the 4-year study period (see online Supplemental Table 1). At the end of the study, in 2017, the sample only consisted of 773 adolescents. There was no statistical difference between the adolescents who remained and those who left the study.
Data collection
Data collection was carried out between February and December of each year by a previously trained team, composed of undergraduate and graduate students and professionals in the areas of nutrition and physical education. The socio-demographic data, level of physical activity and sedentary behaviour were obtained through a face-to-face-interview held during the class shift in school using a questionnaire and had a mean duration of 50 min. Data collection was performed individually, in a reserved room at the school for this purpose only.
Dietary assessment
Food consumption was measured using 24-h dietary recall. The adolescents were asked about all foods and beverages consumed in the last 24 h, form of preparation, brand (industrialised foods) and weight or size of portions, in grams, ounces or household measures. The second 24-h dietary recall was conducted in 30 % of the total sample, each year, in order to reduce the intrapersonal variability of diet and increase the accuracy of the estimation of dietary intake, respecting the seasonal dietary variation at different times of the year and increasing the randomisation of the several weekdays in a more equitable way possible(Reference Verly, Castro and Fisberg12). The data were tabulated in the ‘Virtual Nutri Plus’ software, and regular intake of energy and nutrients was estimated using the multiple source method. This method is suitable to estimate individual usual intake in the case of repeated measurements and a defined time period.
Dietary patterns
The foods were divided into fourteen groups, according to the correlation (correlation matrix) and/or similarities in nutritional composition: basic foods (rice, couscous and cassava), beans, fruits and vegetables, meats, processed meats, butters and margarines, breads and breakfast cereals, sweets, pastries, sweetened drinks, dairy products, cheeses, coffee and tea, and soups (Table 1). The items in the 24-h dietary recall consumed by less than 5 % of the sample were excluded from the analysis, each year. The habitual consumption of food groups was estimated using the multiple source method.
Table 1 Structures of dietary patterns identified by factorial analysis of adolescents in public schools in João Pessoa during the LONCAAFS study, from 2014 to 2017†,‡

LONCAAFS, Longitudinal Study on Sedentary Behavior, Physical Activity, Dietary Habits and Health of Adolescents.
Bold values are significant (P < 0·05).
† Kaiser–Meyer–Olkin Test (KMO) = 0·57.
‡ Explained variance = 0·35.
§ Loadings in bold: ≥ 0·30 or ≤ −0·30.
Dietary patterns were identified using exploratory factor analysis by principal components. The adequacy of the data for factor analysis was verified by the Kaiser–Meyer–Olklin test and Bartlett’s sphericity test(Reference Hair, Anderson and Tatham13). The eigenvalue value (values above 1·0), eigenvalue graph (Scree plot) and the interpretability of the patterns were the criteria used to identify the number of patterns to be retained(Reference Hair, Anderson and Tatham13). Varimax orthogonal rotation was performed to generate uncorrelated factors to facilitate factor interpretation. The highest factor load values were taken into account to identify the patterns found(Reference Hair, Anderson and Tatham13). These procedures were performed each year, separately, to verify if the eating patterns were similar throughout the years(Reference Biazzi Leal, Altenburg de Assis and Hinnig14,Reference Movassagh, Baxter-Jones and Kontulainen15) . Variables with factor loadings ≥ 0·30 or ≤ −0·30 were considered important for factor interpretability. Since the patterns were similar throughout the study (see online Supplemental Table 2), for the analysis of prospective association, we calculated the factor scores for each dietary pattern at the individual level in the follow-up years (2015–2017), adding the consumption, in grams, by group of food, weighted according to the absolute factorial loads of the base year (2014), allowing the same metric to be seen over time(Reference Biazzi Leal, Altenburg de Assis and Hinnig14,Reference Movassagh, Baxter-Jones and Kontulainen15) . The factor scores were standardised, and the mean score of each factor was set to zero.
Outcome assessment
In order to assess the nutritional status each year, body weight, stature and waist circumference measurements were obtained, which were measured in triplicate by the same evaluator, following a standardisation(Reference Lohman, Roache and Martorell16), and the average was used for posterior calculations. A digital scale with a precision of 100 g was used to measure weight, height was measured in centimetres using a portable stadiometer and a tape measure was used to measure waist circumference. BMI (body mass (kg)/height (m2)) was determined based on the body mass and height values, while Z-score values ((individual value – mean)/sd) were obtained following the criteria suggested by the WHO(17). To classify waist circumference, the 90th percentile (P) of the sample was used as cut-off point, and adolescents below and above the P90 were classified as ‘normal’ and ‘altered’, respectively. Waist height ratio was obtained by dividing the waist circumference and height of the adolescent and was then classified as ‘normal’ and ‘altered’ when the indicator was below and above the population average in the year, respectively.
Covariate assessment
The socio-demographic variables used in this study were sex (male and female), age (difference between the date of data collection each year and date of birth), skin colour (brown, black, white, yellow and other indigenous categories proposed by the Brazilian Institute of Geography and Statistics), education level of parents (elementary, high school or higher) and socio-economic status (methodology of the Brazilian Market Research Association), which considers the presence of material goods and monthly employee in the residence, as well as parental schooling, grouping people in the following classes: ‘A/B’, ‘C’ and ‘D/E’, with the latter being the least privileged classes(18).
The level of physical activity was measured using the Physical Activity Questionnaire for Adolescents(Reference Farias Júnior, Lopes and Mota19,Reference Prazeres Filho, Barbosa and Mendonça20) . The adolescents reported if, in the week prior to data collection, they had practised at least 10 min or had not practised at all, performed 19 types of physical activities of moderate to vigorous intensity, plus active displacement, in addition to providing the frequency and duration of practice of each activity. Adolescents were classified as physically active when they practised 420 min of physical activity or more per week(21).
Sedentary behaviour was assessed through the measurement of the average time spent on screen activities, such as watching television, using the computer and tablet, and playing videogames, separately for weekdays and weekends. The arithmetical average was calculated by multiplying the average time in weekdays by five and weekends by two, and the results were divided by seven to obtain the mean time per day (h/d) of sedentary behaviour. A cut-off point for more than 2 h/d was used to define sedentary behaviour(22).
Statistical analysis
In order to prospectively verify the association between dietary patterns and nutritional status, generalised estimating equation models were used to estimate regression parameters, especially when data were correlated. All generalised estimating equations models were run by the gaussian family and identity link function. After testing, no interaction between the sexes was verified, and there was no need for analysis stratification. In the adjusted model, the variables were selected using the stepwise method. The final equations were adjusted for sex, age, skin colour, mother’s schooling, economic class, physical activity level, sedentary behaviour and total energy consumption. All analyses were performed using Stata 13.0 (StataCorp.LP).
Results
Three dietary patterns were identified, which remained similar throughout the study. The first pattern was positively associated with the consumption of basic food groups, beans and meat in all years of the study and negatively with soups. As this pattern characterises a typical Brazilian diet, it was categorised as ‘traditional’ pattern. The second dietary pattern was positively associated with the consumption of processed meats, butters and margarines, breads and breakfast cereals, cheeses, and coffee and teas in all years of the study; hence, it was categorised as ‘snacks’. The third pattern identified was positively associated with consumption of sweets, pastries, sweetened drinks and cheeses in all years of the study but negatively correlated with consumption of coffee and teas and categorised as ‘Western’ pattern (Table 1).
The average BMI Z-score was higher in female adolescents in 2016 (0·34; P = 0·011) and in 2017 (0·26; P = 0·001) than in male adolescents and in adolescents with sedentary behaviour in 2014 (0·46; P = 0·011), when compared with those without sedentary behaviour. There were no statistically significant differences in other variables over time (Table 2).
Table 2 BMI Z-scores of adolescents in public schools in accordance with their characteristics during the LONCAAFS study, from 2014 to 2017

LONCAAFS, Longitudinal Study on Sedentary Behavior, Physical Activity, Dietary Habits and Health of Adolescents.
Bold values are significant (P < 0·05).
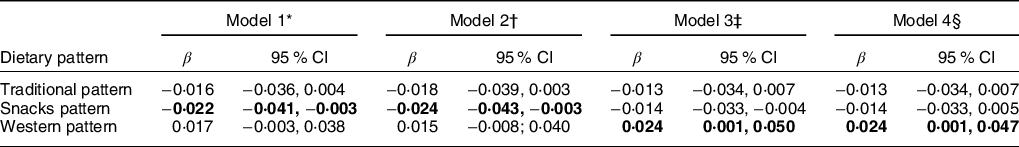
Table 3 shows the coefficients of the relationship between the BMI Z-score and, as an exposure, the adherence scores to each of the three patterns. The ‘Western’ dietary pattern was positively associated with the BMI Z-score (95 % CI 0·002, 0·048) over time, regardless of sex and level of physical activity. Thus, for each increment in the ‘Western’ pattern score, over time, there is an increase of 0·025 in the BMI Z-score (Table 3).
Table 3 Association between BMI Z-score and dietary patterns scores of adolescents throughout the LONCAAFS study from 2014 to 2017 (generalised estimating equations)
LONCAAFS, Longitudinal Study on Sedentary Behavior, Physical Activity, Dietary Habits and Health of Adolescents.
Bold values are significant (P < 0·05).
* Model 1: crude analysis model (Z-score of BMI and score of standards).
† Model 2: model adjusted for total energy.
‡ Model 3: adjusted by the previous variables plus the variables sex, age and economic class.
§ Model 4: adjusted by the previous variables plus the variable level of physical activity.
Discussion
The following three dietary patterns were identified at baseline, which remained similar throughout the study: ‘traditional’ pattern (basic foods, meat and beans), ‘snacks’ pattern (coffee and tea, butters and margarines, cheeses, and processed meats) and ‘Western’ pattern (sweetened drinks, sweets, pastries, cheeses, pastries and snacks). The ‘Western’ pattern correlated positively with the BMI Z-score over time in the adjusted model. These results suggest that such eating patterns are independently associated with BMI Z-score in Brazilian adolescents. This study, which included the participants of LONCAAFS study aged between 10 and 14 years, is the only study that prospectively examined the impact of dietary patterns on the BMI Z-score of adolescent students in Brazil.
The Northeast Brazilian has a very peculiar cuisine, and typical regional dishes are based on maize flour (couscous), roots and tubers (cassava, tapioca and yam); this is the reason why the study participant’s diet is composed of basic foods, along with rice. The patterns identified in this study are similar to those reported by Alves et al., who analysed the data from the Study of Cardiovascular Risk in Adolescents. The dietary patterns of adolescents living in the Northeast region were as follows: ‘bread and coffee’ (bread, coffee, oil and fat, processed meat, and maize), ‘unhealthy’ (sweetened drinks, snacks, pasta, cakes and biscuits, and sweets and desserts) and ‘traditional’ pattern (rice, beans, meat and roots/tubers)(Reference Alves, Souza and Barufaldi23).
In Brazil, only a few studies have assessed the association between nutritional status and dietary patterns in adolescents. Borges et al., analysing adolescents participating in the 2008–2009 Household Budget Survey, identified four dietary patterns – ‘traditional Brazilian’, ‘snacks’, ‘fast food’ and ‘breakfast with milk, fruits, and cereals’ – finding a positive association between the dietary pattern of ‘snacks’ and ‘fast food’ and excess weight(Reference Borges, Marchioni and Levy10). Cunha et al., who assessed the data from the National Human Food Survey in 2008–2009, identified three dietary patterns named ‘traditional’, ‘bread and butter’, and ‘Western standard’, indicating that the ‘Western’ eating pattern is associated with the BMI Z-score(Reference Cunha, Costa and De Oliveira11).
Adherence to the ‘Western’ dietary pattern was directly associated with BMI Z-scores over time. Some previous longitudinal studies reported that higher adherence to dietary patterns similar to the ‘Western’ pattern had no significant association with increase in the BMI Z-score(Reference Biazzi Leal, Altenburg de Assis and Hinnig14,Reference Oellingrath, Svendsen and Brantsaeter24,Reference Field, Austin and Gillman25) .
However, in Europe, the Dortmund Nutritional and Anthropometric Longitudinally Designed (DONALD) study, which was conducted among children and adolescents aged between 3 and 18 years, found a small, but positive association between the consumption of these high-energy Western foods and body weight in boys(Reference Alexy, Libuda and Mersmann26). The Avon Longitudinal Study of Parents and Children (ALSPAC) study found a positive relationship between Western diets at 5 and 7 years of age and overweight at 9 years of age(Reference Johnson, Mander and Jones27).
In this study, the foods that make up the ‘Western’ pattern have higher energy density, are rich in fats and sugars, and are low in fibre, and are associated with excess weight in adolescents(Reference Ambrosini, Huang and Mori28–Reference Romero-Polvo, Denova-Gutierrez and Rivera-Paredez30). In addition, foods classified as healthy and negatively associated with excess weight, such as fruits and vegetables, did not comprise any of the patterns identified in the present study, indicating that adolescents are replacing healthy eating habits with Western dietary patterns(Reference Nielsen and Popkin31–Reference Popkin33). These eating behaviours are often associated with unfavourable health outcomes(Reference Angelieri, Barros and Siqueira-Catania34,Reference Li, Hruby and Bernstein35) .
Although the mean BMI Z-score was reduced for both sexes, this reduction was less intense among female adolescents, especially in the two final years of the study (2016 and 2017). This result was similar to that found in another study performed in England(Reference Ambrosini, Emmett and Northstone36), which reported that with increased age, the Z-scores of BMI and body fat were higher in girls. A study performed using data from the National Health and Nutrition Examination Survey, which prospectively analysed the BMI of participants from childhood to adolescence, also found a stabilisation in the prevalence of high BMI in girls but not in boys(Reference Ogden, Carroll and Curtin37).
Weight gain among girls tends to occur more rapidly than in boys, with a peak in weight gain occurring between 10 and 14 years of age, thereafter continuing, but at a reduced rate(Reference Forbes38–Reference Siervogel, Roche and Guo41). Due to the presence of sex hormones during puberty, girls tend to accumulate more fat than boys, due to the development of the buttocks, breasts and hips(Reference Daniels, Arnett and Eckel42–Reference Rogol, Roemmich and Clark44). Furthermore, girls usually reach their peak height after 13 years of age, whereas boys initiate their growth spurt at this age(Reference Forbes38–Reference Siervogel, Roche and Guo41). Thus, at the age of 14 years, boys tend to grow taller, with less weight gain and less fat, than girls, which may explain, in part, the greater BMI Z-scores among female adolescents.
Throughout the study, the proportion of adolescents with sedentary behaviour and their mean BMI Z-score decreased. A Brazilian study that used the data from the Pelotas cohort found that an increase in BMI was also found among adolescents who had increased sedentary behaviour, indicating a positive association between sedentary behaviour and BMI during adolescence(Reference Dumith, Garcia and Silva45). In addition, a recent review showed that the majority of studies presented a risk association between sedentary behaviour and nutritional status in adolescents(Reference Guerra, Ribeiro and Leme46).
This study has some limitations. First, the adherence to a dietary pattern may be influenced by cultural, family, seasonal, geographic and socio-economic factors, which can produce different patterns, formed by different food groups, and complicate the interpretation and comparison among the studies(Reference Pollard, Landrigan and Ellies47–Reference Fernández-Alvira, Börnhorst and Bammann51). However, a recent systematic review showed that despite the differences in the studies analysed, they reported a similarity in the groups of foods that compose the dietary patterns of adolescents, which are considered unhealthy(Reference Cunha, Costa and De Oliveira11). Second, the statistical method used to define the dietary patterns has subjective components, including the consolidation of food items in the food groups, the number of factors to extract and the labelling of standard(Reference Martinez, Marshall and Sechrest52). Thus, it remains a challenge to interpret and compare studies involving dietary patterns.
Despite these limitations, the analysis of food consumption by food patterns was carried out simultaneously, with complex combinations of nutrients(Reference Hu53–Reference Moeller, Reedy and Millen56), which provided an approach to the effect of the combination of foods and nutrients on the nutritional status of adolescents(Reference Kristiansen, Lande and Sexton8,Reference Azevedo, Diniz and Monteiro9) .
Conclusions
This analysis of adolescents in Brazil indicates that adherence to a ‘Western’ dietary pattern, composed of foods with high energy density, high fat and sugars, and low fibre, influences the BMI Z-score of adolescents. In addition, this study suggests the need to implement strategies to prevent and manage excessive weight and to encourage and support the diet and healthy behaviours of adolescents, regardless of nutritional status.
Acknowledgements
Acknowledgements: The authors gratefully acknowledge all of the children, their parents, schools and members participated in the LONCAAFS study. Financial support: This research was funded by the São Paulo Research Foundation (FAPESP), which granted Adélia da Costa Pereira de Arruda Neta a doctoral scholarship (proc. 2016/16551-4). Conflict of interest: There are no conflicts of interest. Authorship: A.C.P.A.N.: formal analysis, methodology, validation, visualisation, writing – original draft, and writing – review and editing; J.C.F. Junior: data curation, methodology, validation, visualisation, and writing – review and editing; F.E.L.L.F.: data curation, methodology, validation, visualisation, and writing – review and editing; D.M.M.: formal analysis, methodology, validation, visualisation, writing – original draft, and writing – review and editing. Ethics of human subject participation: This study was conducted according to the guidelines laid down in the Declaration of Helsinki and all procedures involving research study participants were approved by the Committee for Ethics in Research with Human Beings at the Health Sciences Center of the Federal University of Paraíba (registration no. 15268213.0.0000.5188). Written informed consent was obtained from all subjects/patients.
Supplementary material
For supplementary material accompanying this paper visit https://doi.org/10.1017/S1368980021000252


