


The number of US adults aged 65 years and over is projected to nearly double from 50·9 million in 2017 to 94·7 million in 2060(1), highlighting an increased need to identify modifiable risk factors to protect against age-related health issues and consequent disability. Currently, Alzheimer’s disease is the 6th leading cause of death in the USA with projected costs of caring for people with Alzheimer’s or other dementias increasing from $290 billion in 2019 to more than $1·1 trillion in 2050(2). Identification of protective factors to reduce the rate of cognitive decline with advancing age is crucial as age is the primary risk factor for cognitive decline(Reference Niccoli and Partridge3). There has been much interest in nutritional interventions to help reduce cognitive decline and dementia given the lack of effective treatments available. Consumption of nuts has been associated with better cognitive outcomes in ageing populations(Reference O’Brien, Okereke and Devore4–Reference Li and Shi6), with walnuts being identified as a nut with the potential for unique cognitive benefits given that individual components in walnuts such as PUFA, carotenoids, vitamins C and E and polyphenols have been associated with reduced risk of cognitive decline and/or dementia(Reference Poulose, Miller and Shukitt-Hale7). Numerous studies suggest the nutrients found in walnuts promote brain health, although research on the cognitive benefits of whole walnut consumption is lacking.
Preliminary evidence of an association between whole walnut consumption and cognitive health has been demonstrated through both observational and experimental research designs. In a cross-sectional study from the 1988–1994 and 1999–2002 National Health and Nutrition Examination Survey, walnut intake was associated with better cognitive performance across multiple cognitive domains in US adults aged 20–90 years, irrespective of gender, age and ethnicity(Reference Arab and Ang8). In adults 60 years and older, those that regularly consumed walnuts scored 7·1 percentile points higher on a measure of delayed verbal memory and 7·3 percentile points higher on a measure of processing speed, attention, visual spatial skills and associative learning and memory compared with non-consumers(Reference Arab and Ang8). In a prospective cohort study of women 70 years of age or older, higher long-term total nut intake was associated with better cognitive performance in multiple cognitive domains but not with rates of cognitive decline(Reference O’Brien, Okereke and Devore4). Although coming from a study of Spanish older adults with substantially different dietary patterns than older adults in the USA, higher walnut intake was positively associated with working memory in a cross-sectional sample of elderly individuals living in Spain(Reference Valls-Pedret, Lamuela-Raventós and Medina-Remón5). In addition, total urinary polyphenol excretion, a biomarker of polyphenol-rich food consumption, was associated with memory function, further supporting that dietary antioxidants such as those found in walnuts may have a positive impact on age-related cognitive decline(Reference Valls-Pedret, Lamuela-Raventós and Medina-Remón5,Reference Gillette Guyonnet, Abellan Van Kan and Andrieu9) . Indeed, the results of multiple rodent studies suggest that walnuts have potent neuroprotective effects through upregulation of hippocampal neurogenesis and antioxidative, anti-inflammatory and antiapoptotic mechanisms(Reference Hicyilmaz, Vural and Delibas10–Reference Willis, Shukitt-Hale and Cheng15). In a randomised crossover design, 8 weeks of daily walnut intake increased inferential reasoning in healthy, young adults(Reference Pribis, Bailey and Russell16). These experimental studies support a causal link between walnut consumption and cognition but unfortunately cannot be generalised to ageing populations due to the use of animal models and physiological differences between healthy young adults and older adults experiencing age-related cognitive decline.
Existing research provides support for an association between walnut consumption and cognitive health but is limited by cross-sectional design and lack of generalisability to at-risk populations including older adults. Methods that examine within-person change in cognitive health are required to assess whether walnut consumption can protect against age-related cognitive decline. In addition, population-based studies that allow statistical estimates to be generalised to the US population of ageing adults are crucial in identifying whether walnut consumption can provide an effective and low-cost means of protecting the cognitive health of our ageing population. Our aim was to assess whether whole walnut consumption was associated with cognitive trajectories in a population-weighted sample of older US adults.
Methods
Observations were drawn from the Health and Retirement Study (HRS), a nationally representative panel study of older adults beginning in 1992 with biennial follow-up. Measures of cognitive function were drawn from the 2012, 2014 and 2016 waves of the HRS and all covariate measures were drawn from the 2012 HRS. Measures of walnut and nutrient intake were drawn from the cross-sectional 2013 Health Care and Nutrition Study (HCNS). The HCNS is a study measuring food consumption in a subsample of HRS respondents consisting of all living HRS respondents not included in the 2013 HRS Consumption and Activities Mail Survey(17). The HCNS included the Harvard FFQ by Willett and colleagues(Reference Willett, Sampson and Stampfer18) and uses nutrient tables developed by the Harvard School of Public Health(Reference Harvard19). The HRS and HCNS are funded by the National Institute on Aging (U01AG009740) and are conducted by the Survey Research Center at the Institute for Social Research at the University of Michigan(17). The University of Michigan’s institutional review board approved the HRS protocol, and participants were read a confidentiality statement and provided oral or implied consent when first contacted and were provided written informed consent at each interview(Reference Weir20).
In late 2013, questionnaires were mailed to the subsample of HRS respondents (n 12 418) with 8073 respondents completing the HCNS (simple response rate = 65 %). The final nutrient total data contained 8035 respondents, with 97 % of respondents answering 90 % or more of the food consumption questions. The HCNS contains responses to the 165-item FFQ. To calculate the 215 nutrient total variables in the HCNS, categorical measures were converted to numeric responses, then missing data in the nutrient variables was imputed using respondent characteristics from the HRS (age, race, gender, years of education and BMI) and six food items with the least missing data(17). Further description of the imputation process used in the HCNS can be found in the HCNS data description(17).
Of the 8035 HCNS respondents with complete food consumption data, 3829 were removed from the analytic sample due to being less than 65 years old and three were removed due to proxy response on the HCNS survey. We also excluded observations with missing information on the original walnut intake question (n 18) or that had daily energy intakes falling outside the commonly used range of 2092–14 644 kJ/d for women and 3347·2–16 736 kJ/d for men (n 231)(Reference Willett21). Respondents with missing baseline cognitive scores (n 277) or who reported a memory-related disease in 2012 (n 45) were also removed. The final number of respondents included in the analytic sample used to calculate the reported results was 3632. Figure 1 presents a sample selection diagram and the number of participants at each measurement wave.
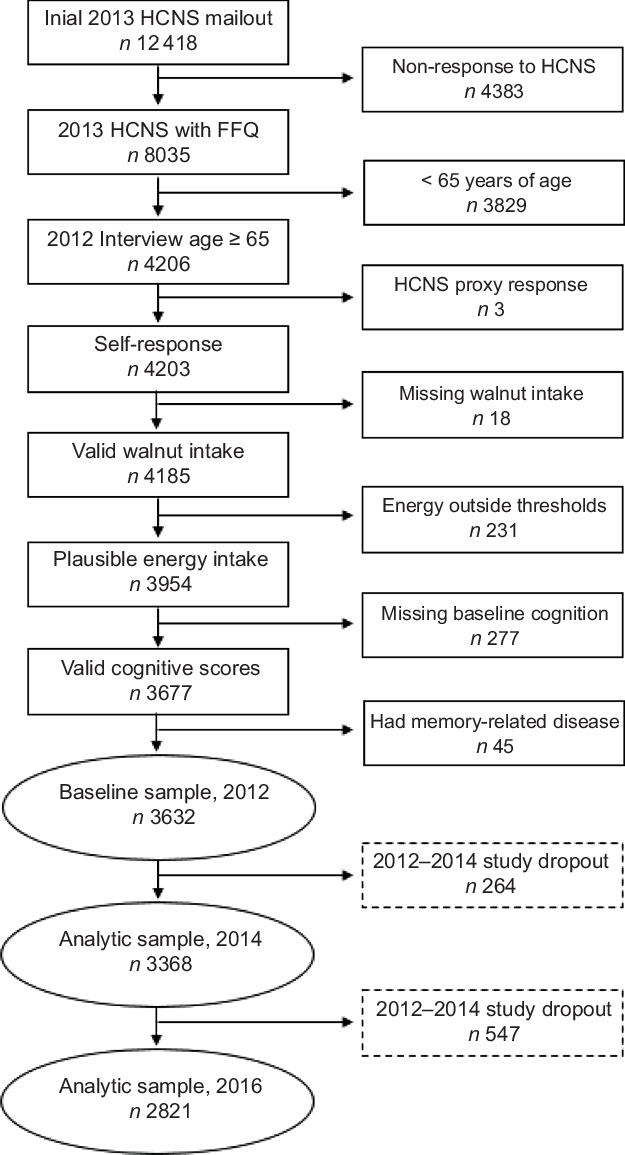
Fig. 1 Sample selection and study dropout diagram. HCNS, Health Care and Nutrition Study
Measures
Walnut consumption
On the HCNS survey, respondents were asked to ‘…mark a box indicating your average total use, during the past year, of [walnuts]’ (1 oz. serving size; response categories: never, <1 per month, 1–3 per month, 1 per week, 2–4 per week, 5–6 per week, 1 per day and ≥2 per day). Responses to the FFQ were converted to numerical values reflecting average servings per day. Due to the relatively infrequent walnut intake of all respondents resulting in a right-skewed distribution of the original walnut measure, and the need to include a meaningful number of participants in each walnut consumption category, we defined walnut consumption as a categorical indicator of average walnut intake (no consumption, low consumption (0·01 through 0·08 servings per day) and moderate consumption (greater than 0·08 servings per day)).
Cognitive status
To measure cognitive function, we examined scores on the Telephone Interview for Cognitive Status (TICS)(Reference Brandt, Spencer and Folstein22) drawn from the 2012, 2014 and 2016 waves of the HRS. The TICS provides a multidimensional measure of global cognitive function and is modelled after the Mini-Mental State Exam(Reference Folstein, Folstein and McHugh23). The TICS score used in the HRS is composed of twelve items including immediate word recall, delayed word recall, a backwards counting task, a serial 7 subtraction test and date, object naming and common knowledge tasks. The immediate and delayed word recall tests are free recall tasks measuring the construct of episodic verbal memory and have been shown to be sensitive to changes in fluid cognitive abilities(Reference Small, Stern and Tang24,Reference Lachman, Tun, Hofer and Alwin25) . Respondents were asked to recall words from a list of ten common nouns (e.g., lake, car and army) with the number of words correctly recalled providing the immediate word recall score. The delayed word recall score was calculated as the number of words correctly recalled after approximately 5 min of other survey questions being asked. Interviewers read from one of four randomly assigned word lists and subsequent administrations used a different word list for the three following waves(Reference Ofstedal, Fisher and Herzog26). The backward counting task asked respondents to quickly count backwards for 10 continuous numbers beginning with the number 20. The serial 7 test asked respondents to subtract 7 from 100 and continue subtracting 7 from each subsequent number for a total of five trials. For date, object naming and common knowledge tasks, respondents were asked to name the day, month, year and day of the week the interview was conducted, name common objects when prompted (e.g., ‘What do you usually use to cut paper?’ and ‘What do you call the kind of prickly plant that grows in the desert?’) and name the current president and vice-president of the USA. The TICS score ranges from 0 to 35 with greater scores indicating more correct responses to the TICS items and better cognitive function. In multivariate models, a count of previous word recall test exposures, beginning in the first HRS survey wave in 1992, was included as a time-varying covariate to control for potential learning effects.
Covariates
Demographic and socioeconomic characteristics, health behaviours and health status measures were included as covariates to reduce the likelihood of confounding in the parameter estimates of interest. Demographic measures included respondents’ age, gender (1 = female, 0 = male), race/ethnicity (White, Black, Hispanic and Other), marital status (1 = partnered or married, 0 = single, divorced or widowed) and retirement status (1 = retired, 0 = not retired). Education (<12 years of education, 12 years of education and >12 years of education), longest occupational tenure (white-collar, blue-collar, female homemaker and other occupational tenure) and log-transformed household income and assets were included as indicators of socioeconomic status. Health behaviours included BMI (underweight (BMI < 18·5 kg/m2), normal weight (18·5 kg/m2 ≤ BMI < 25 kg/m2), overweight (25 kg/m2 ≤ BMI < 30 kg/m2), obese (BMI ≥ 30 kg/m2)), vigorous physical activity (participation in activities such as sports, heavy housework or a job that involves physical labour; no vigorous physical activity, vigorous physical activity less than 1 time per week, vigorous physical activity more than one time per week; self-reported through in-home or phone interview), current smoking status (1 = current smoker, 0 = not current smoker) and alcohol consumption (non-drinkers, moderate drinkers (men drinking between one and fourteen drinks per week and females drinking between one and seven drinks per week) and heavy drinkers (men drinking more than fourteen drinks per week and females drinking more than seven drinks per week)). Health status was measured as the number of doctor-diagnosed chronic conditions (high blood pressure, cancer, diabetes, lung disease, heart problems, stroke, psychiatric problems and arthritis). Early physical disability was assessed with a sum of eleven indicators of limitation in physical mobility.
Nutrient intake
To examine the association between walnut consumption and general measures of overall dietary intake, we examined the association between walnut consumption, energy intake and macronutrient density. Estimated energy intake was measured as average daily total kilocalorie (kcal) intake. Macronutrient density for daily intake of carbohydrate, protein, fat and saturated fat was calculated as the estimated percent of daily energy content coming from each macronutrient source (% kcal). Macronutrients and micronutrients found in walnuts were examined to provide evidence that intake of these specific nutrients was associated with variation in walnut intake. Macronutrient and micronutrients selected for this purpose were total fat (g), saturated fat (g), monounsaturated fat (g), polyunsaturated fat (g), n-3 (ω3-FA; g), α-linoleic acid (g), n-6 (ω6-FA; g) and vitamin E (α-tocopherols; mg).
Statistical methods
Latent growth models (LGM) were estimated in a structural equation modelling framework to identify the association between walnut consumption, global cognitive status at baseline and change in global cognitive status 4 four years. Latent growth modelling allows the estimation of change over time using latent variables(Reference Bollen and Curran27). The x-axes of the LGM were specified using individually varying time scores based on age. Individual time scores were defined as participants’ age at each interview centred on the grand mean age at baseline measurement in 2012. This specification of time allows the mean intercept to be interpreted as the average TICS score at the mean age of the sample in 2012 and the mean linear latent slope to represent change in TICS over 1 year of change in age.
The LGM were completed using maximum likelihood estimation with robust se, providing treatment of missing data on control variables with full-information maximum likelihood, estimation of se robust to non-normality and adjustment for correlations between independent variables. All statistical models account for population weighting, post-stratification and household nesting, producing estimates generalisable to community-dwelling US adults aged 65 years and over in 2013 that met our sample selection criteria.
Mplus version 8.1(Reference Muthén and Muthén28) was used to estimate LGM and follow-up analyses adjusting for non-random missing data. SAS version 9.4(29) was used to assess differences in continuous measures across walnut consumption groups using ANOVA with bivariate follow-up through least squares mean differences. Differences in categorical measures across groups were tested using contingency tables with the Rao–Scott χ 2 test. Significant overall χ 2 tests were partitioned into 2 × 2 contingency tables with Rao–Scott χ 2 tests used to test statistical significance, and OR were used to identify the direction the observed cell frequency departed from the expected cell frequency. To reduce the likelihood of Type I error due to multiple comparisons, the significance level for each follow-up test was adjusted using the Bonferroni correction. All statistical tests adjusted for complex survey design.
Sensitivity analyses
When observing developmental change in health outcomes among older adults, mortality selection may bias parameter estimates when dropout is associated with the outcome of interest(Reference Enders30,Reference Muthén, Asparouhov and Hunter31) . To examine the potential that mortality selection influenced our primary findings, we conducted sensitivity analyses with various missing data treatments to assess whether non-random dropout was associated with statistical estimates(Reference Jackson, Engelman and Bandeen-Roche32). In addition to the full-information maximum likelihood approach to handling missing data used in the primary analyses, two additional missing data scenarios were examined. First, we estimated a complete case model including only those cases with complete information on TICS scores across all observational periods (n 2765). Second, a pattern mixture model was used to decompose the average latent trajectory for each pattern of missing data using a mixture-modelling approach, resulting in an average-weighted trajectory based on the proportion of cases found in each missing data pattern(Reference Muthén, Asparouhov and Hunter31). This approach regresses the latent intercept and slope on dummy variables indicating whether the respondent dropped out during the 2-year window between each observation wave (dropout between 2012–2014 and 2014–2016; 1 = dropped out, 0 = retained). The full-information maximum likelihood approach has been shown to underestimate decline in health status among those who die during the follow-up period(Reference Jackson, Engelman and Bandeen-Roche32), and the chosen follow-up analyses provide conservative estimates of the association between walnut consumption and cognitive change.
Monte Carlo power analysis
To estimate attained power and identify the sample size necessary to establish a statistically significant association between walnut intake and cognitive function in the HRS and HCNS data, we used parameter estimates derived from our primary LGM as starting values to estimate Monte Carlo simulation models. Monte Carlo power analysis allows researchers to estimate required sample size and power for complex statistical models(Reference Muthén and Muthén33). Two approaches to Monte Carlo analysis were taken. First, we used the sample size of 3632 to estimate the attained power to correctly reject the null hypothesis in our primary models (using P < 0·05 as the threshold for statistical significance). Second, we varied the sample size in the simulation models to identify the sample required to correctly reject the null hypothesis when testing associations between walnut intake, baseline cognitive performance, and cognitive change at the significance level P < 0·05 and the commonly accepted probability of correctly rejecting the null hypothesis, or power (1 – β = 0·80)(Reference Cohen and Wolman34). Monte Carlo simulation models were replicated for sample sizes from 1000 to 50 000 and were averaged over 100 replications for each sample size. Supplemental tables and figures reporting these results are available online.
Results
Descriptive statistics
Table 1 reports the distribution of daily walnut consumption, TICS scores at each observation wave and relevant dietary intake for the complete analytic sample and separated by walnut consumption group. The mean reported walnut consumption for the sample was 0·08 servings per day (sd = 0·36), representing around one to three 1 oz. servings of walnuts per month. No walnut consumption was reported by 1161 older adults, and 1993 older adults were identified in the low walnut consumption group and reported consuming 0·04 servings of walnuts per day (sd = 0·34), representing around one serving per month. The moderate walnut consumption group of 478 older adults consumed almost one-half serving of walnuts per day (mean = 0·49, sd = 0·34) or 2–4 servings per week. At baseline measurement in 2012, mean TICS score was 22·11 (sd = 4·73), which slightly declined over the observational period. Of the 3632 adults aged 65 years and older at baseline measurement, around 22 % (n 811) were not observed at the final measurement in 2016. Cognitive status varied significantly across walnut consumption groups, with baseline TICS scores being positively associated with increased walnut consumption. In both the 2014 and 2016 follow-up measurements, those reporting no walnut consumption had significantly lower TICS scores than those reporting either low or moderate walnut consumption (P < 0·001 for both comparisons), but TICS scores did not differ for those reporting low or moderate walnut consumption.
Table 1 Descriptive statistics for walnut consumption, Telephone Interview for Cognitive Status (TICS) scores, energy intake, macronutrient density and macronutrient/micronutrient intake for analytic sample and walnut consumption group
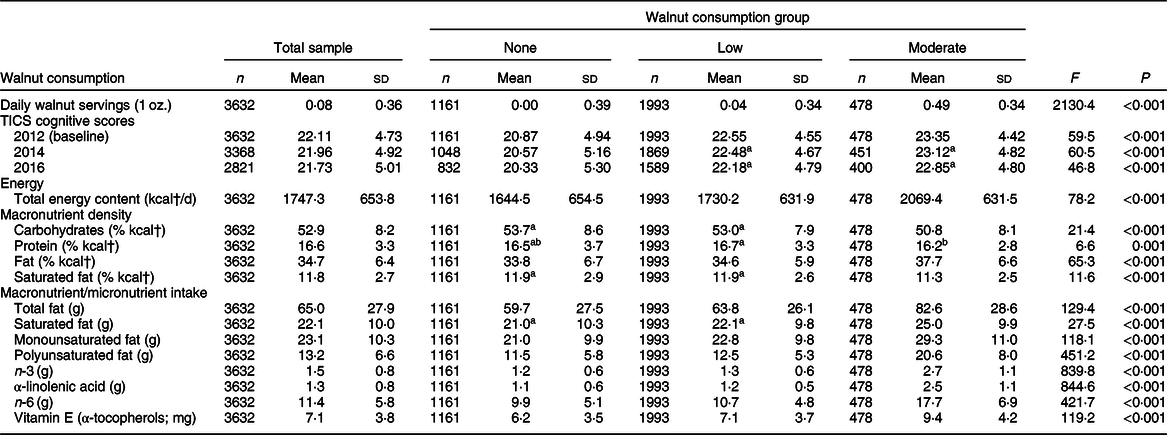
† To convert energy values from kcal to kJ, multiply it by 4·184.
a–bMean values within row with matching superscript letters were not significantly different. α level for statistical significance identified with Bonferroni correction.
All estimates and statistical tests excluding s d account for complex survey design.
Regarding dietary intake related to walnut consumption, daily energetic intake was positively associated with walnut consumption, with the no walnut consumption group consuming an average of 425 fewer kcal (1778·2 kJ) each day than the moderate walnut consumers. Macronutrient energy density varied across walnut consumption group, with moderate walnut consumers having significantly lower carbohydrate energy density, greater overall dietary fat density, yet lower saturated fat energy density, than either no or low walnut consumers. Total fat intake was greatest among moderate walnut consumers, as was saturated fat, monounsaturated fat and polyunsaturated fat intake. Moderate walnut consumers had the greatest intake of n-3 and nearly twice the intake of α-linolenic acid and n-6 as those reporting no walnut consumption. Moderate walnut consumers had α-tocopherol intake around 50 % higher than the no walnut consumption group and around 33 % higher than the low walnut consumption group.
Table 2 presents descriptive statistics for participant characteristics measured at baseline. The mean age of the sample was 74·3 years (sd = 6·8), which did not vary by walnut consumption group. Older adults reporting no walnut consumption had fewer monetary resources than those reporting either low or moderate walnut consumption. The moderate walnut consumption group reported fewer comorbid chronic conditions than either the no or low walnut consumers, and fewer mobility limitations were reported with greater walnut consumption.
Table 2 Descriptive statistics for baseline participant characteristics by analytic sample and walnut consumption group
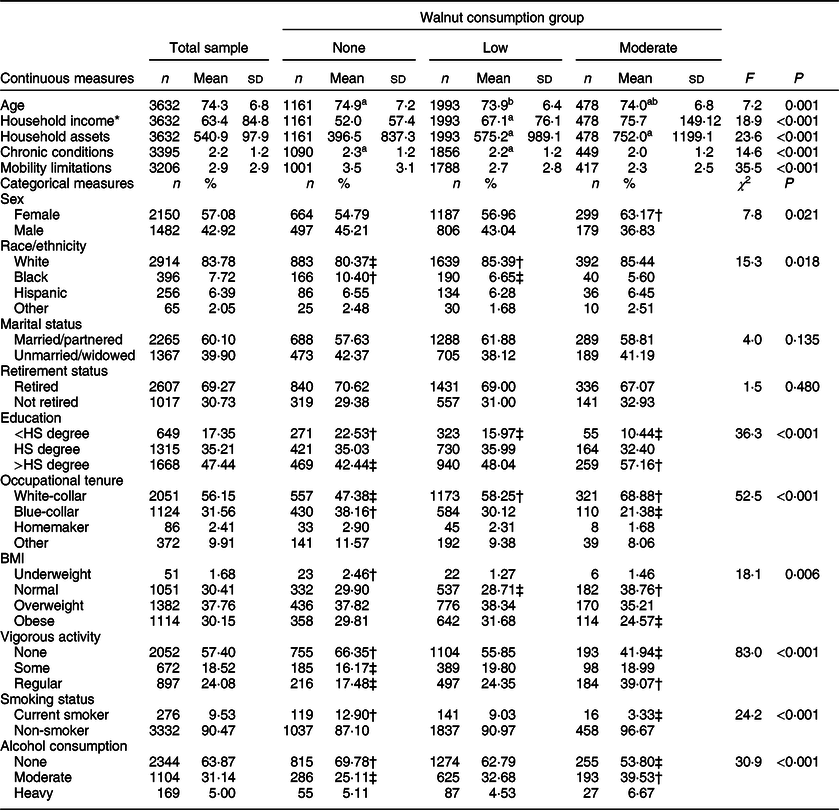
* Mean and sd reported for non-log-transformed household income and assets, statistical tests based on log-transformed household income and assets. Mean and sd for household income and assets reported in $1000s.
† Observed cell frequency significantly greater than expected.
‡ Observed cell frequency significantly less than expected.
a–bMean values within row with unlike superscript letters were significantly different. α level for statistical significance identified with Bonferroni correction.
All estimates and statistical tests excluding sd account for complex survey design.
For categorical covariates, around 57 % (n 2150) of the sample was female, with a significantly greater proportion of females reporting moderate walnut consumption than expected by chance. The racial/ethnic distribution of the sample was 83·8 % White, 7·7 % Black, 6·4 % Hispanic and 2·1 % other race/ethnicity, with significantly fewer Whites and significantly more Blacks, reporting no walnut consumption than expected. Older adults reporting less than a high school education were over-represented in the no walnut consumption group and under-represented in the moderate walnut consumption group. Alternatively, older adults reporting greater than a high school degree were less likely to report no walnut consumption and more likely to report moderate walnut consumption. Older adults reporting white-collar occupational tenure were more likely to report low or moderate walnut consumption, with those reporting blue-collar occupations being more likely to report no walnut consumption. For health-related behaviours, the majority of the sample had a BMI classified as either overweight or obese, with moderate walnut consumers being more likely to have a normal BMI and less likely to be obese. Similarly, older adults reporting moderate walnut consumption were less likely to report no vigorous physical activity and more likely to report regular vigorous physical activity.
Walnut consumption and cognitive trajectories
Associations between walnut consumption group, baseline TICS score and change in TICS scores over the 4-year observational window are presented in Table 3. The unconditional growth model identified TICS scores at the baseline mean age of 74 years (b = 21·98, se = 0·09, P < 0·001), and change in TICS scores over the 4 years of observation (b = –0·26, se = 0·01, P = 0·01), to be significantly different from 0. Model 1 included only binary indicators of low and moderate walnut consumption using no walnut consumption as the reference category. For TICS scores at mean age at baseline, low walnut consumers had baseline TICS scores 1·53 units greater (se = 0·21, P < 0·001), and moderate walnut consumers had baseline TICS scores 2·22 units greater (se = 0·27, P < 0·001), than those consuming no walnuts, respectively. Walnut consumption was not significantly associated with change in TICS over the observational period.
Table 3 Estimates of association between walnut consumption groups and trajectories of Telephone Interview for Cognitive Status scores from latent growth models
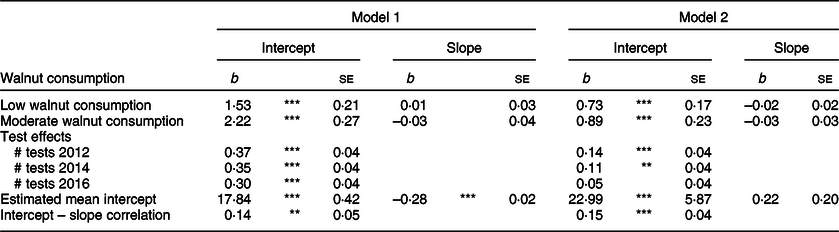
Unconditional mean intercept b = 21·98, se = 0·09, P < 0·001; unconditional mean slope b = –0·26, se = 0·01, P = 0·01; unconditional correlation between intercept and slope r = 0·14, se = 0·06, P = 0·016.
Model 2 adjusted for the following covariates: gender, age, race/ethnicity, marital status, retirement status, education, longest occupational tenure, log-transformed household income, log-transformed household assets, BMI, vigorous physical activity, smoking status, alcohol consumption, number of doctor-diagnosed chronic conditions and number of mobility limitations.
***P < 0·001, **P < 0·01, *P < 0·05, †P < 0·10.
Model 2 presents results from the LGM adjusting for covariates. When adjusting for possible confounders, the positive associations between walnut consumption and baseline TICS scores were somewhat attenuated but remained significant. Compared with those reporting no walnut consumption, baseline TICS scores in the low and moderate walnut consumption groups were 0·73 units greater (se = 0·17, P < 0·001) and 0·89 units greater (se = 0·23, P < 0·001), respectively. Again, there were no identified associations between walnut consumption category and change in TICS scores. To identify whether there were differences in adjusted baseline TICS scores for low and moderate walnut consumers, we conducted nested model fit tests to detect if constraining the estimated regression parameters between baseline TICS score and the low and moderate walnut consumption group to be equal would result in significantly worse model fit. The Wald test of parameter constraints did not indicate significantly worse model fit (Wald χ 2 = 0·71, df = 1, P = 0·398), suggesting there were not statistical differences in the association between walnut consumption and baseline TICS scores for low and moderate walnut consumers.
Numerous covariates were associated with TICS scores at baseline, although few of these covariates were associated with cognitive change. Covariate estimates were excluded from tables for parsimony but are available upon request. In reference to their respective comparison groups, baseline TICS scores were greater for females, Whites, those with greater than a high school degree, those reporting white-collar occupational tenure, those with a BMI identified as overweight or obese, non-smokers and those reporting moderate or heavy alcohol intake. Both household income and household assets were positively associated with baseline TICS scores and increasing mobility limitations were associated with lower initial TICS scores. Age was the only measure associated with change in TICS score, with each increasing year of age being associated with slightly more rapid decline in TICS scores (b = –0·01, se = 0·002, P < 0·001).
Sensitivity analyses
Table 4 provides results from sensitivity analyses estimating the association between walnut consumption groups and trajectories of TICS scores under three different treatments of missing data. Compared with the primary results estimated using full-information maximum likelihood, the finding that walnut consumption was positively associated with baseline TICS scores but not associated with change in TICS scores remained unchanged. In the complete cases analysis, which hypothetically would contain only the healthiest older adults who did not experience mortality over the observational period, the magnitude of the regression estimate comparing moderate walnut consumers to non-consumers was slightly greater than the other two models, as was the se for the estimate. In the pattern mixture model, the estimates produced by regressing the latent intercept and latent slope of cognitive function on indicators of dropout provided evidence of non-random dropout as these parameters were all statistically significant (P < 0·05). Compared with those who remained in the study over the three waves of measurement, the baseline TICS scores for those who dropped out between 2012 and 2014 were on average 1·82 units lower (se = 0·45), and for those who dropped out of the study between 2014 and 2016, baseline TICS scores were on average 0·91 units lower (se = 0·24). Dropout was not associated with change in TICS scores.
Table 4 Estimates of association between walnut consumption groups and Telephone Interview for Cognitive Status trajectories from latent growth models with various adjustments for non-random missing data
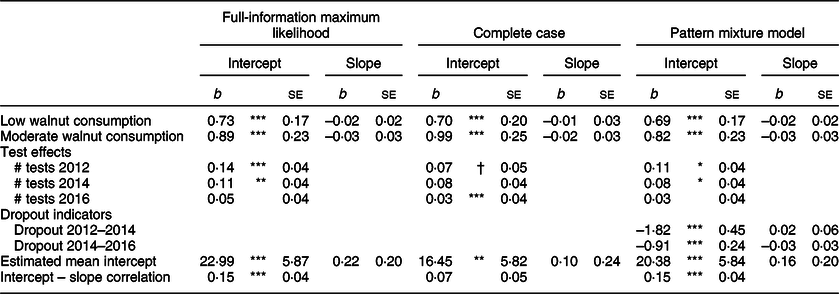
All models adjusted for the following covariates: gender, age, race/ethnicity, marital status, retirement status, education, longest occupational tenure, log-transformed household income, log-transformed household assets, BMI, vigorous physical activity, smoking status, alcohol consumption, number of doctor-diagnosed chronic conditions and number of mobility limitations.
***P < 0·001, **P < 0·01, *P < 0·05, †P < 0·10.
Power analysis
Online supplementary material, Supplemental Table S1 presents estimates from the primary growth models and estimates derived from the Monte Carlo simulation using the observed sample size of 3632. Estimates from the simulated data were similar to those from observed data. When regressing baseline TICS scores on low and moderate walnut consumption, the power to identify a significant effect at the observed sample size was very high (1 – β > 0·999). When regressing the slope of TICS on low walnut consumption, the attained power was low (1 – β = 0·16), which was also true of the estimate for moderate walnut consumption (1 – β = 0·13). Online supplementary material, Supplemental Fig. S1 displays the estimated power to identify a significant association between the slope of TICS, low walnut consumption and moderate walnut consumption as a function of sample size. When compared with those consuming no walnuts, the sample size required to correctly identify a significant association between change in TICS scores and both low and moderate walnut consumption would be around 44 000 or greater.
Discussion
We examined the association between walnut consumption and trajectories of cognitive function in US adults aged 65 years and older, finding evidence of a cross-sectional association between walnut consumption and cognitive function. Walnut consumption was not associated with cognitive change, limiting the ability to make causal interpretations of the observed association. Greater walnut consumption was associated with participant characteristics known to be correlated with better cognitive health, as well as consumption of key nutrients that have been identified to have neuroprotective benefits. These results appeared to be robust to statistical assumptions about missing data. Walnut consumption was correlated with an array of factors that predispose older adults for better cognitive outcomes, and further studies are needed to deconstruct the potentially endogenous relationship between walnut consumption and cognitive function in ageing populations.
In models adjusting for relevant covariates, walnut consumption was associated with greater TICS scores at baseline but not with subsequent change in TICS scores. The association between walnut consumption and TICS scores at baseline was not significantly different between those reporting low or moderate consumption, indicating that older adults reporting any walnut consumption had better cognitive function at baseline than those reporting no walnut consumption. These results support other research identifying that those reporting any walnut consumption had better cognitive health than those reporting no consumption(Reference Arab and Ang8). A growing body of literature suggests that walnut consumption is associated with a host of positive health outcomes(Reference Guasch-Ferré, Li and Hu35), and our findings re-affirm studies identifying that walnut consumption is specifically associated with cognitive health in older populations(Reference Valls-Pedret, Lamuela-Raventós and Medina-Remón5,Reference Arab and Ang8) .
It is important to reiterate that our study did not identify an association between walnut consumption and change in cognitive health, adding support to existing prospective studies finding nut intake to be associated with initial cognition but not rate of cognitive change(Reference O’Brien, Okereke and Devore4,Reference Nooyens, Bas Bueno-De-Mesquita and Van Boxtel36) . The results of the Monte Carlo power analysis suggest that the primary models were underpowered to identify an association between cognitive change and walnut consumption. The weak association between change in TICS scores and walnut consumption would require an unreasonably large sample size to have a greater than 80 % chance of identifying a meaningful association between walnut intake and cognitive change, if one were to exist. Given that the issue of identification in our models was related to the strength of association, and not sample size, examining the possible reasons why a weak association exists between walnut intake and cognitive change is necessary. First, it may be that whole walnut consumption has relatively little impact on cognitive decline when accounting for the numerous confounders related to trajectories of health among ageing adults. It is possible that given the advanced age of the sample analysed, many older adults experienced cognitive decline before inclusion in our study, thus reducing the variability in cognitive change that could be attributed to walnut consumption. Finally, longer observational periods may be required to identify an effect of walnut consumption on change in cognitive function as we observed change over a relatively short 4-year window.
Interpretation of our results is aided by contextualising the observed association between walnut consumption and cognitive health. Compared with older adults reporting no walnut consumption, moderate walnut consumers were more likely to have greater education and report longest occupational tenure in a white-collar position, tended to have a BMI classified as normal and not obese, were more likely to report regular vigorous physical activity and were more likely to be non-smokers and moderate consumers of alcohol. Taken together, moderate walnut consumption appears to be a marker of healthy lifestyle choices supported by advantageous socioeconomic position. The sociological concept of the health lifestyle describes how socioeconomic status and health behaviours are deeply intertwined, with health behaviours emerging as the result of individual choices enabled or constrained by differential access to socioeconomic resources(Reference Cockerham37). Markers of socioeconomic status including education and occupational prestige are consistently associated with cognitive outcomes among older adults(Reference Alley, Suthers and Crimmins38–Reference Whalley, Deary and Appleton40), as are health behaviours including fitness training(Reference Colcombe and Kramer41,Reference Jonasson, Nyberg and Kramer42) . In addition, numerous studies examining walnut or tree-nut intake have found positive associations between walnut intake and more general nut consumption, and various markers of socioeconomic status(Reference O’Brien, Okereke and Devore4,Reference Arab and Ang8,Reference Guasch-Ferré, Bulló and Martínez-González43,Reference O’Neil, Nicklas and Fulgoni44) . Our primary analyses suggest that walnut consumption is associated with baseline cognitive function net of socioeconomic and behavioural factors, yet our findings also point to a complex relationship between health lifestyle, walnut consumption and cognition. Walnut consumption may be a means of supporting cognitive health, although future research must consider the social context that shapes both walnut consumption and cognitive ageing.
The greater cognitive performance observed in walnut consumers may also be due to increased exposure to neuroprotective nutrients and phytochemicals from walnut consumption. Although moderate walnut consumers had higher total fat intakes, this was primarily due to higher consumption of MUFA and PUFA which have been demonstrated to reduce the risk of cognitive decline(Reference Solfrizzi, Frisardi and Capurso45). Walnuts are a rich source of α-linolenic acid (18 : 3 n-3)(Reference Hayes, Angove and Tucci46), and α-linolenic acid in moderate walnut consumers was over twice that of no or low consumers. α-Linolenic acid is a neuroprotective PUFA that serves as a precursor for DHA, the predominant n-3 in the brain. PUFA, including both n-3 and n-6, are concentrated on the neuronal membranes and play a crucial role in enzymatic activity and the stability and signalling of neurons in the brain(Reference Poulose, Miller and Shukitt-Hale7,Reference Willis, Shukitt-Hale and Cheng15) . Total PUFA intake was also significantly greater in the moderate consumers than no or low consumers. The concentration of neuronal PUFA declines with age, contributing to the impaired neuronal function observed with ageing(Reference Poulose, Miller and Shukitt-Hale7). Increased dietary intake of PUFA may prevent PUFA reduction in neuronal membranes and has previously been associated with a reduced risk of age-related cognitive decline(Reference Waitzberg and Garla47). Vitamin E is a potent antioxidant, and several studies suggest vitamin E may protect against cognitive decline and reduce the risk of cognitive impairment(Reference Tucker48). Most adults do not meet the recommended dietary allowance of 15 mg α-tocopherol(49). Tree nuts, including walnuts, have the highest amount of α-tocopherol per serving among food groups in the US food supply and could serve as good dietary sources of this neuroprotective nutrient. Indeed, in our sample, moderate walnut consumers had 50 % greater α-tocopherol intake than those consuming no walnuts. Although not included in the dietary analysis, walnuts are also a source of neuroprotective polyphenols that may increase neurogenesis and have antioxidant and anti-inflammatory activities(Reference Poulose, Miller and Shukitt-Hale7,Reference Sánchez-González, Ciudad and Noé50) . Oxidative and inflammatory damage may contribute to the development of neurological disorders such as Alzheimer’s disease and age-related cognitive decline(Reference Johnson51). Therefore, the neuroprotective, anti-inflammatory and antioxidant properties of nutrients present in walnuts may provide cognitive benefits to the ageing population.
Strengths and limitations
Our study not only benefits from numerous strengths but also contains inherent limitations. Drawing from a recently collected representative sample of older adults, we provide further support for an association between whole walnut consumption and cognitive health among older Americans. The statistical methods chosen represent methodological improvements to existing research in this area, including the use of LGM to test the association between walnut intake and change in cognitive function, as well as the use of sensitivity analyses comparing estimates from models with varying assumptions about the role of non-random missing data in longitudinal studies of ageing and health. Considering these strengths, our results also contain methodological limitations. First, the measurement of walnut consumption through the FFQ relies on respondents to accurately recall average walnut consumption over the past year, likely introducing measurement error through incorrect recall or various interpretations of the FFQ questions. Socially desirable response bias may be an additional source of measurement error in responses to the FFQ and subsequent estimates of walnut and nutrient intake, as well as relevant covariates including physical activity. There are also methodological issues to consider when interpreting the observed association between walnut consumption and trajectories of cognitive function, including potential residual confounding related to unobserved measures and reverse causality between cognitive function and walnut consumption. We included several carefully selected covariates to adjust our statistical models, meaning the observed associations between walnut consumption and baseline cognition are net of all covariates, yet the potential for unobservable variables to contribute to residual confounding remains. Relatedly, our models address but do not eliminate the potential for reverse causality. Older adults with greater cognitive reserves may be better equipped to make healthful decisions and select foods that have been advertised as having neuroprotective benefits, so it may be that greater cognition leads to greater walnut consumption. By regressing cognitive change on walnut consumption, our LGM did test whether prior reports of walnut consumption were associated with subsequent cognitive change, with results leading to confirmation of the null hypothesis. Rather than aim to increase sample size in future observational studies of cognition and walnut intake, researchers should investigate the utility of quasi-experimental methods to create balanced comparison groups, as well as focus on alternative means of measuring walnut intake.
Our work is a contribution to the existing literature and points to issues that future studies should work to address. Although some of the nutrients in walnuts have been studied in relation to cognitive function, there has been relatively little research on the association between whole walnut consumption and cognitive decline. To our knowledge, this study is the first to evaluate whole walnut consumption and cognitive decline in a representative sample of ageing Americans. As we found evidence of a cross-sectional association between walnut consumption and cognitive function, walnut consumption should be further studied as a potentially modifiable factor in the cognitive health of ageing populations, especially given the low overall walnut intake observed among older adults.
Acknowledgements
Acknowledgements: None. Financial support: This research was funded by the California Walnut Commission. Conflict of interest: The California Walnut Commission had no role in the design, analysis or writing of this article. Authorship: N.J.B. contributed to conceptualisation, methodological design, formal analysis, and manuscript preparation and submission. K.E.Z. contributed to conceptualisation, methodological design and manuscript preparation. Ethics of human subject participation: This study was conducted according to the guidelines laid down in the Declaration of Helsinki and all procedures involving human subjects/patients were approved by the University of Michigan’s institutional review board. Verbal informed consent was obtained from all subjects/patients and was witnessed and formally recorded.
Supplementary material
For supplementary material accompanying this paper visit https://doi.org/10.1017/S1368980020001287


