


Each day, children are exposed to large quantities of marketing for unhealthy food on digital media including websites, social media and online games(Reference Rideout, Foehr and Roberts1). This high level of marketing exposure shapes children’s dietary preferences for unhealthy foods and brands(Reference Montgomery, Chester and Grier2,Reference Kelly, Vandevijvere and Freeman3) . This is concerning as dietary patterns tend to track from childhood to adolescence and through to adulthood, which may increase children’s risk of CVD, diabetes, obesity and poor mental health over the long term(Reference Ali, Blades and Oates4–7).
To mitigate the long-term consequences of exposing children to unhealthy food marketing, academics, practitioners and public and non-profit organisations have been advocating for regulations to restrict unhealthy food marketing to children(Reference Taillie, Busey and Stoltze8). However, developing regulations to restrict food marketing to children is challenging because it is unclear what constitutes ‘marketing to children’(Reference Mulligan, Potvin Kent and Christoforou9). Various policy documents refer to ‘child targeted’ or ‘child appealing’ food marketing. The former is typically indicated by the use of specific marketing strategies targeting children, such as childish font, cartoons or pictures of children, and is therefore relatively simple to operationalise(Reference Jenkin, Madhvani and Signal10). The latter has a broader definition and can refer to marketing that may not target children directly, but nevertheless attracts their attention and may persuade them to consume a product(Reference Mulligan, Potvin Kent and Christoforou9). For instance, Mulligan et al.(Reference Mulligan, Potvin Kent and Vergeer11) previously found that children were attracted to health claims on food packaging, a marketing strategy that typically targets adults.
In an attempt to measure the power of food marketing techniques, Elliot and Truman(Reference Elliott and Truman12), after reviewing eighty studies in the field, found that the use of spokes characters (e.g. cartoons, licenced characters or famous athletes) was a persuasive marketing technique. The authors also reported that the most frequently attractive messages for children were related to health/nutrition(Reference Mayhew, Lock and Kelishadi13), taste(Reference Allemandi, Castronuovo and Tiscornia14) and fun(Reference Harris, LoDolce and Dembek15). Spokes characters and messages can be found in the text, labels, objects and logos contained in food marketing instances, thus making food marketing techniques an important determinant of whether marketing appeals to children.
Additional factors can also shape whether marketing appeals to children. For instance, Elliot(Reference Elliott16) found that children aged 8–9 years did not like food marketing instances that they perceived to be too childish. Similarly, previous studies have reported that food companies have been using food marketing techniques that may appeal to African American and Hispanic children, such as ethnic symbols, linguistic styles and music(Reference Montgomery, Chester and Grier2,Reference Chang17) .
Other factors like household income, exposure to screens and nutritional literacy can shape the impact of food marketing on children. Indeed, lower-income children are likely to make more advertising-induced purchases than their higher-income peers(Reference Young18). Similarly, children’s food choice is affected by exposure to screens(Reference Smith, Kelly and Yeatman19), such as television(Reference Boyland, Kavanagh-Safran and Halford20), advergames(Reference Esmaeilpour, Heidarzadeh Hanzaee and Mansourian21), internet(Reference Pettigrew, Tarabashkina and Roberts22) and social media(Reference Baldwin, Freeman and Kelly23). Children’s nutritional knowledge has also been shown to be inversely related to the consumption of unhealthy foods(Reference Tarabashkina, Quester and Crouch24).
However, to date, quantitative studies have not examined the relative importance of marketing features and children’s socio-demographic and other characteristics in shaping which marketing appeals to them. This is challenging to perform using traditional statistical methods, due to limitations associated with handling interactions between multiple predictors simultaneously(Reference Bauer25). Machine learning, by contrast, can handle multiple predictors by using mathematical models that extract patterns from data to map such input predictors to a specific outcome(Reference Bzdok, Altman and Krzywinski26,Reference Rajula, Verlato and Manchia27) . Hence, this approach opens up opportunities to conduct more comprehensive and complex syntheses of multiple factors that shape the extent to which food marketing appeals to children.
In the current study, in order to assess the most important predictors of child appeal in digital food marketing, we used machine learning to examine how marketing techniques and children’s socio-demographic characteristics, weight, height, BMI, frequency of screen use and dietary intake influence whether marketing instances appeal to children.
Methods
Participants and recruitment
We conducted a pilot study with thirty-nine children residing in Calgary, Alberta, Canada, aged 6–12 years, who could speak, read and understand English(Reference Valderrama, Olstad and Lee28). We recruited the children through social service agencies, online community groups on Facebook (a social media platform) and via an e-mail distributed to primary caregivers with whom the researchers were acquainted. Our goal was to recruit a diverse range of participants with varying socio-economic backgrounds (e.g. household income), ethnicity, body weight status, age, sex and immigrant status.
Data collection
Before starting a session, caregivers provided written, informed consent for their child to participate, and children also provided assent. Sessions were conducted on a secure online platform (Zoom, with a password required to access the session), guided by an interviewer.
At the beginning of each interview, caregivers and their child answered a questionnaire based on the Canadian Community Health Survey(29) to report the child’s age, sex at birth, ethnicity, immigration status, parental education, height and weight. We also assessed weekly consumption of vegetables, fruits, soda (including regular/diet soda, fruit drinks, 100 % fruit juice, energy drinks, sports drinks) and snack foods (e.g. chips, candy, chocolate, baked goods, desserts)(Reference Hutchinson, Williams and Kirkpatrick30), perceived income adequacy(Reference Hagenaars and de Vos31,Reference Litwin and Sapir32) and screen time (hours spent watching television and using the internet, tablets, and smartphones in the past week) using items from previous surveys(33,Reference Byrne, Terranova and Trost34) .
Following the questionnaire, caregiver presence was optional for the food marketing labelling session. Caregivers present at the session with their child were asked to refrain from answering for their child. During the session, each child evaluated approximately 104 food marketing ads in two separate sessions of 15 min each (∼52 marketing ads per session). For each marketing instance, children answered a binary question. The question for the first eighteen interviewed children was: ‘Is this ad for kids your age?’. For the remaining twenty-one children, the question was: ‘Is this ad for kids like you?’. The question was changed as some children found it easier to respond to the second question (i.e. they could not determine the intended age demographic for the ads).
Food marketing ads
All the food marketing instances were obtained between September and October 2020 using Oracle Moat(35), a marketing analytics suite in which users can search for ads for specific companies, brands or food categories (e.g. snacks, sodas, breakfast cereal). For each food category listed in Appendix 1, we included ads in English from well-known brands and companies in North America. Figure 1 shows examples of the food marketing instances used in this study, whereas Table 1 shows the ten most common brands featured in the food marketing instances.
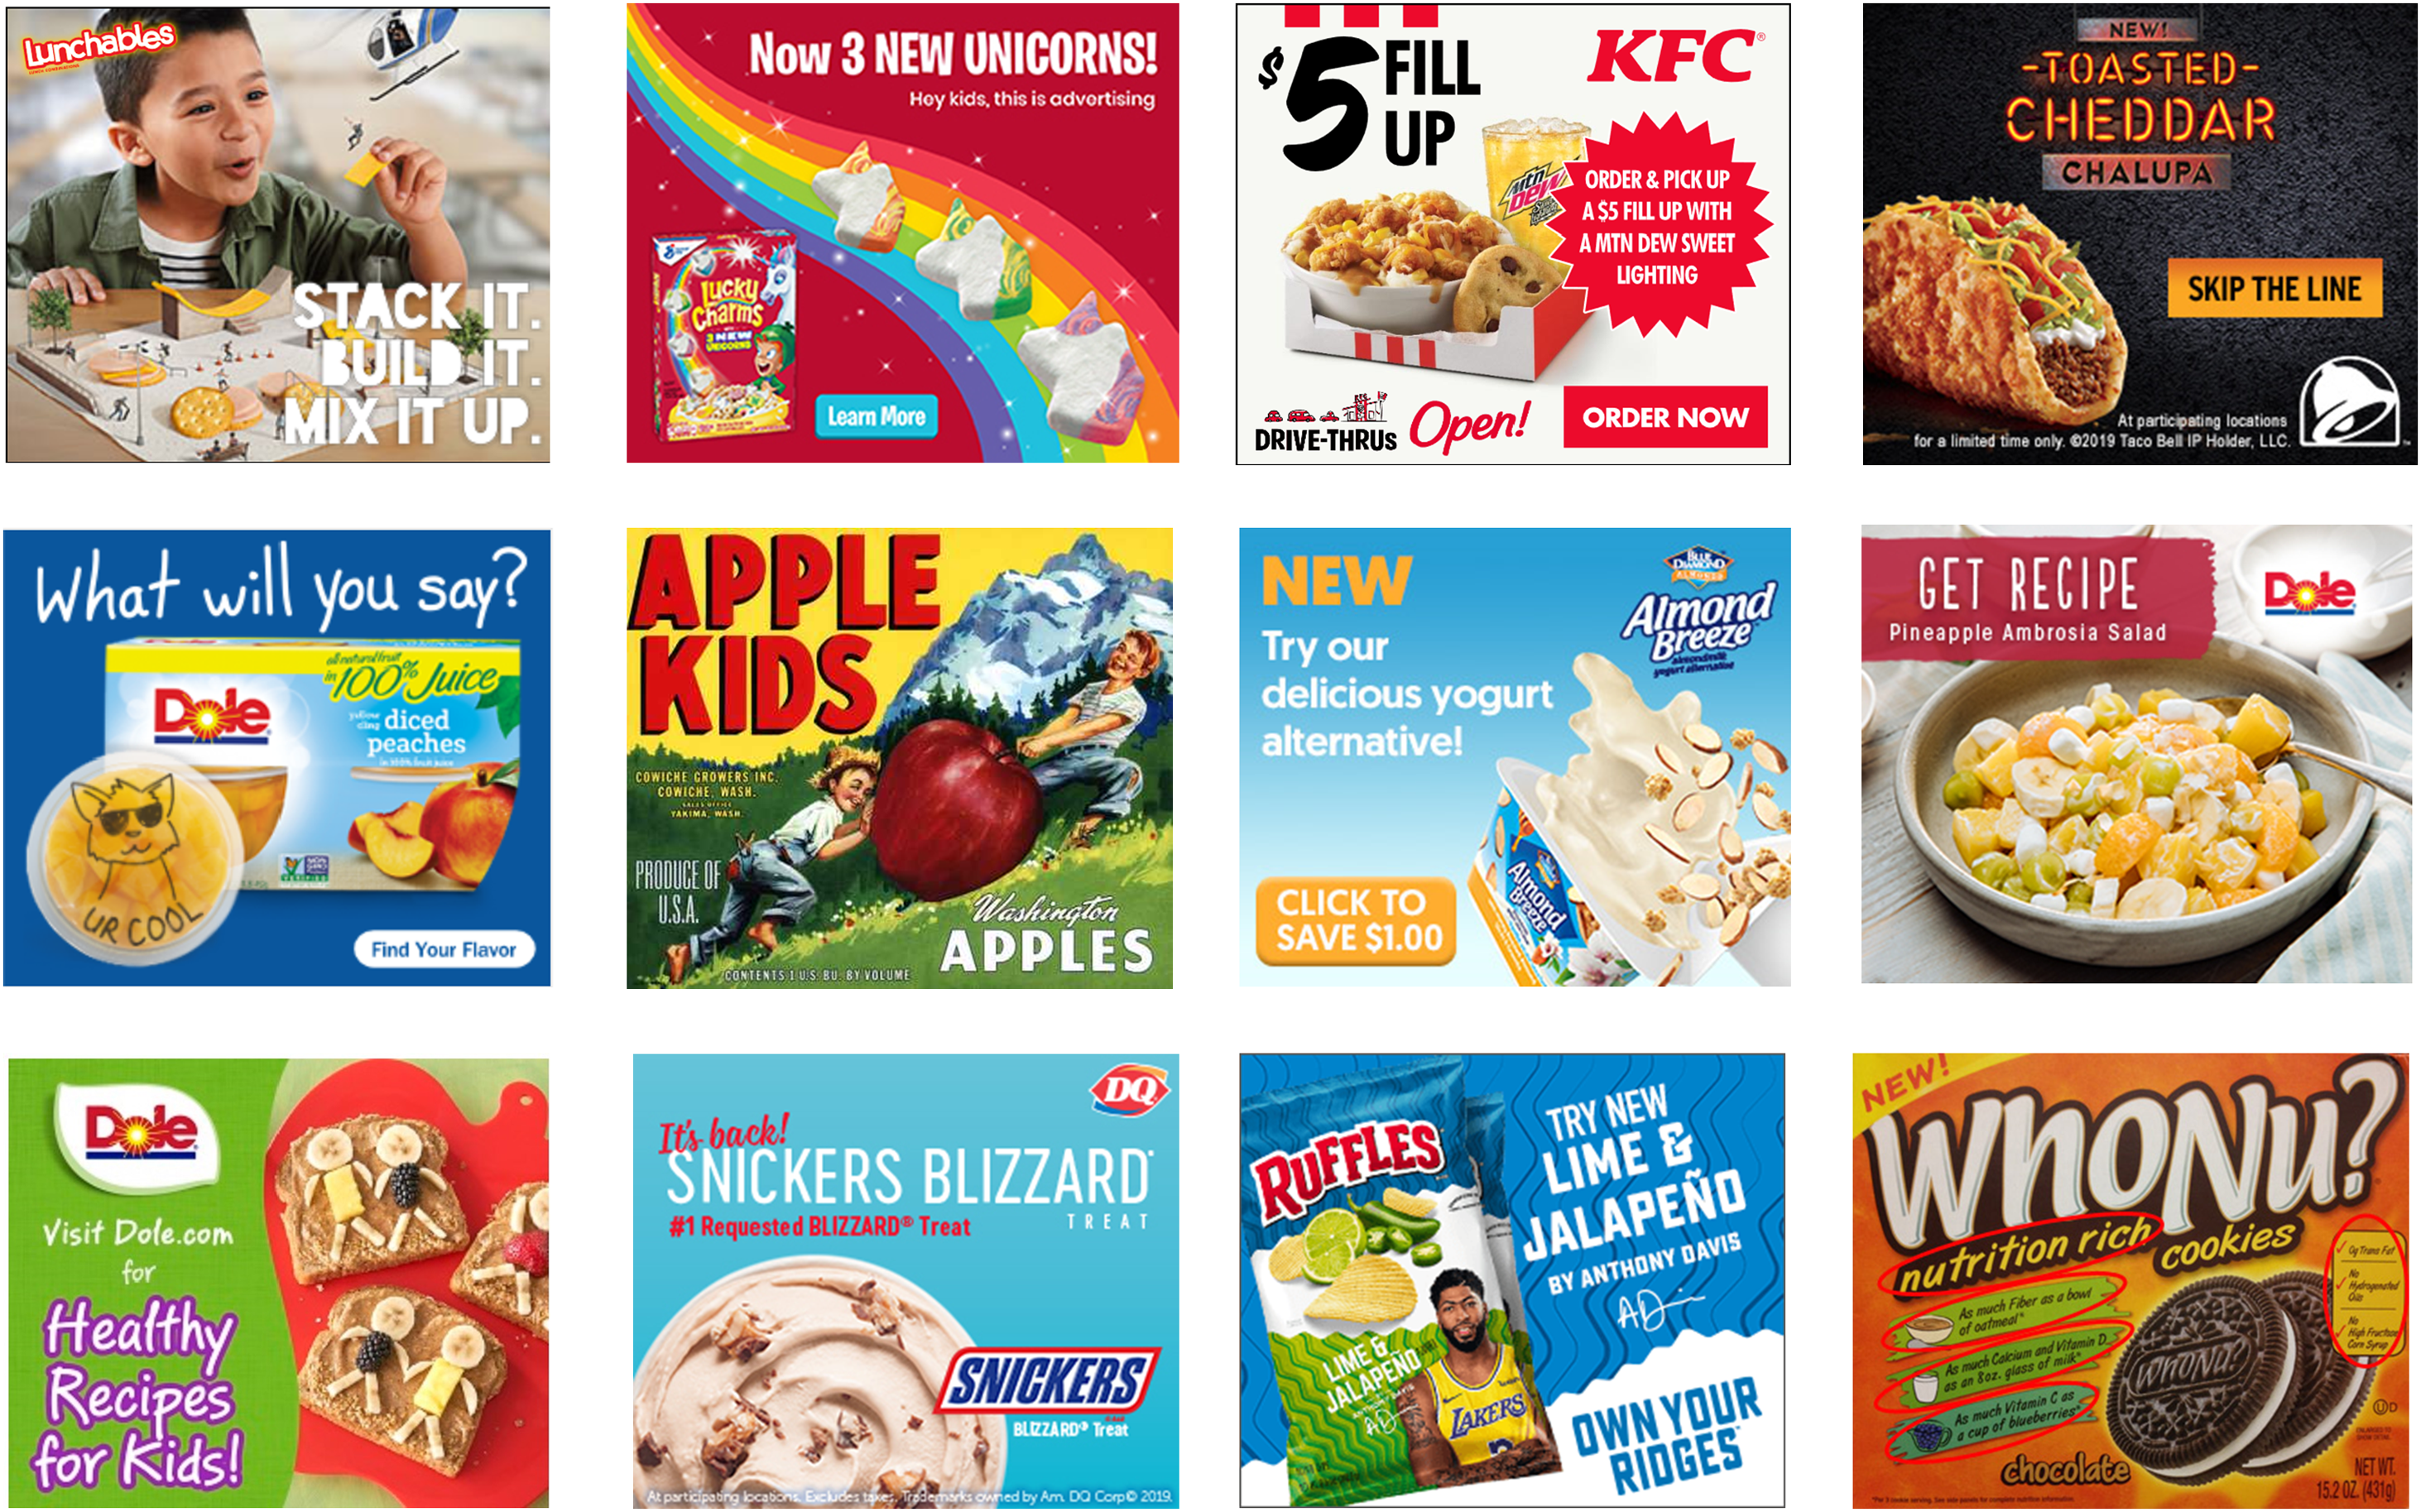
Fig. 1 Examples of the food marketing instances used in the study
Table 1 Top ten brands featured in the food marketing instances

In total 1366 food ads were extracted from Moat. One of these food ads was discarded because it contained an alcoholic product. The remaining 1365 ads were assigned to twenty-six sets, ensuring that each set had a similar proportion of ads containing child-targeting elements (e.g. cartoons, bold colours, fun themes).
The thirty-nine children were randomly divided into thirteen groups of three children each. Each group was assigned to two food ad sets. Each child in the group individually reviewed the two sets of food ads, answering for each ad whether the ad appealed to them (yes or no answer). Therefore, the two sets were labelled by the same three children, and each food ad received three responses (answers). The sets evaluated by the same three children were combined, thus resulting in a total of thirteen shared sets.
Agreement between children
The sets evaluated by the same three children were combined, resulting in a total of thirteen shared sets. The agreement between children in each shared set was analysed using Fleiss’ kappa statistic(Reference Landis and Koch36), and the S score developed by Bennett et al.(Reference Bennett, Alpert and Goldstein37) These two metrics calculate the degree of agreement as:
 $${{{P_o} - {P_e}} \over {1 - {P_e}}},$$
where P o is the observed agreement and P e is the expected agreement by chance. The difference between the two metrics is that the Fleiss’ kappa calculates P e as the expected value of the class distribution, whereas the S score calculates P e as the inverse of the number of classes. The S score is more robust when there is an imbalance between the two possible responses (yes or no). The values of these two metrics were interpreted using the reference ranges presented in Table 2. Additionally, for each of the thirteen shared sets, we calculated the percentage of marketing instances in which all three children agreed.
Table 2 Fleiss’ Kappa and S score interpretations
Data pre-processing
For the variables collected with the questionnaire, we treated household education, household income, perceived income adequacy, frequency of screen use and dietary intake data (i.e. frequency of consuming specific types of food) as ordinal variables. Sex and ethnicity were treated as nominal categorical variables. Age, years lived in Canada, weight and height were used as continuous variables. Weight and height were used to calculate BMI z-scores using WHO guidelines(38) which was also included as a continuous variable.
Extracting elements contained in the food marketing instances
Elements contained in the food marketing instances were extracted using Google Vision API(39), a commercial machine learning-based service for image processing. For each of the 1365 food ads, we used Google Vision API to extract the following four elements:
-
1. Text: Letters and words embedded in the image using optical character recognition methods.
-
2. Labels: General themes or topics associated with the image, such as locations, activities, animal species and products.
-
3. Objects: Persons, animals or items included in the image.
-
4. Logos: Popular product or brand logos within the image.
Figure 2 illustrates the identification of text, labels, objects and logos for one of the food marketing instances that were shown to participants. For each element, Google Vision API detected none, one or multiple items. For instance, panel (b) in Fig. 2 shows that Google Vision API identified happy, smile, natural foods, grass and font as labels for that food ad.

Fig. 2 Food ad elements extracted using Google Vision API. The four extracted elements were: (a) text, (b) labels, (c) objects, and (d) logos
This procedure resulted in a dataset composed of 1365 rows (one per food ad) and four columns (one per element). Each cell of this dataset corresponds to the text, labels, objects or logos of the food ad.
Constructing the final dataset
Because three children evaluated each food ad, each food ad received three responses. Consequently, a total of 4095 responses from thirty-nine children were collected in this work. We used the 4095 responses, the food ad elements and the children’s variables collected with the questionnaire to build a final dataset. Figure 3 shows the format of the final dataset. Each row in the final data set contains food ad elements, children’s variables and their response to that food instance. The dataset contains 1365 unique food ads, thirty-nine different children and a total of 4095 responses.

Fig. 3 Format of the final dataset. Each row contains information related to the food ad elements, children’s variables, and their response for that food marketing instance
Machine learning approach
We used a machine learning approach to predict whether the food marketing instances appealed to children. To train and test our machine learning models, we split the final dataset (see Fig. 3) by randomly assigning twelve out of thirteen shared sets to the training set and the remaining one to the test set. Since each set was evaluated by three independent children, the training set in total had thirty-six children, and the test set only had three. The training set was used to build the prediction models, whereas the test set was used to calculate the performance of the trained models. As we split the data based on the shared sets, none of the food ads were included in both the training and test sets. This helped to ensure that the features of the food ads did not bias model performance.
Machine learning models relate a set of predictors to an outcome or response variable. For our study, the response variable was the answer (yes or no) given by each child when they viewed the food marketing instances. The predictors were of two types. The first type of predictor was children’s socio-demographic characteristics, weight, height, BMI z-score, frequency of screen use and dietary intake variables. The second type of predictors were the text, logos, objects and labels extracted from the food marketing instances using Google Vision API.
Figure 4 shows the machine learning approach, which was composed of two stages to predict whether the food marketing instances appealed to children. The first stage dealt with processing the predictors extracted from the food marketing instances, whereas the second stage combined the output from the first stage with children’s socio-demographic characteristics, weight, height, standardised BMI, frequency of screen use and dietary intake variables to predict whether the food marketing instances were child appealing using logistic regression, random forest, gradient boosting trees and conditional inference tree models.

Fig. 4 Machine learning approach for predicting child appealing food marketing instances. The approach comprised two stages. In the first stage, text, logos, labels, and objects contained in the food marketing instances were used to calculate the probability of the instance being child appealing given the text, logos, labels, and objects. In the second stage, the output from the first stage was combined with children's sociodemographic characteristics, weight, height, standardized BMI, frequency of screen use, and dietary intake variables to predict whether the food marketing instances appealed to children using logistic regression, random forest, gradient boosting trees, and conditional inference tree models
Stage 1: Processing features from the food marketing instances
The goal of the first stage was to estimate the probability that a given food marketing instance appealed to children, given the elements (text, labels, objects and logos) contained in it. This stage only considered food ad elements and not children’s variables.
Because each food marketing instance was evaluated by three children, the information related to each marketing instance was summarised in three rows of the training dataset, each one corresponding to the response of one child. To increase confidence that a given ad did or did not appeal to children, we aggregated the three children’s responses for each ad by taking the mode. The mode ensured that the most frequent response was kept. For instance, if two children responded ‘yes’ when asked whether the food ad was appealing to them, and one child answered ‘no’, the aggregate response for the food ad was yes (child appealing).
Calculating the probability that a marketing instance appealed to children, given its elements
After aggregating children’s responses, the number of rows in the training set was reduced by a factor of three. This new aggregated training set was used to build four models to calculate the probability that a marketing instance appealed to children. Specifically, the four models corresponded to the probability that an ad appealed to children based on text, labels, objects and logos, respectively.
To build each of these four models, we used a natural language processing technique called bag of words. A bag of words represents a set of documents as a set (‘bag’) of its words. In our case, the food ads were the documents, and the different elements were the corresponding words (text, labels, objects or logos). The first step in a bag of word approach is to identify the unique words across all the documents. Therefore, we identified the unique words provided by Google Vision API across the food ads. Once the unique words are identified, the second step is to generate a matrix by placing each unique word as columns and each document as rows. The intersection of each document and word is the count of how many times the word is mentioned in that document. Thus, in our case, the cells of this matrix showed how many times each word (text, label, object or logo) was mentioned in a food marketing instance.
The last step was to use the bag of words matrix with the aggregated children’s responses to build the model. To this aim, we used a multinomial Naïve Bayes model. Naïve Bayes is a model that uses the Bayes theorem to calculate for each sample in the dataset the likelihood of belonging to each class. In our case, the Naïve Bayes calculated for each food ad its likelihood of being child appealing or not based on the text, labels, objects and logos encoded in the bag of words matrix.
Stage 2: Training machine learning models to predict whether food marketing appealed to children
The text, labels, objects and logos Naïve Bayes models trained in Stage 1 were used to calculate the probability that a marketing instance appealed to children. Each Naïve Bayes model produced a probability value, having in total four probabilities for each food marketing instance. These four probabilities were combined with children’s socio-demographic characteristics, weight, height, standardised BMI, frequency of screen use and dietary intake variables to predict whether the food marketing instance appealed to children using four different machine learning models: logistic regression, random forest, gradient boosting trees and conditional inference tree. The logistic regression, random forest and gradient boosting tree were implemented using the statsmodels (Reference Seabold and Perktold40) and sklearn (Reference Pedregosa, Varoquaux and Gramfort41) libraries in Python. The conditional inference tree was implemented using the party (Reference Strobl, Hothorn and Zeileis42) package in R.
Logistic regression is a statistical model that calculates the probability of an event occurring based on a set of independent predictors(Reference Hosmer and Lemeshow43). In our case, the event was whether a food marketing instance appealed to children, whereas the independent predictors were the four probabilities for the text, logos, objects and labels calculated during Stage 1 and children’s socio-demographic characteristics, weight, height, standardised BMI, frequency of screen use and dietary intake variables. Logistic regression performs multiple iterations to estimate coefficients for the independent predictors that best fit with the event occurrence. These coefficients can be transformed to estimate odds ratios. The OR represent the odds that the event would occur based on the independent predictors’ values.
Random forest and gradient-boosting trees are machine-learning predictive models composed of multiple decision trees(Reference Hastie, Tibshirani and Friedman44). A decision tree is a tree-like model composed of nodes, branches and leaves. Each node uses one of the independent predictors to ask a question, the branches represent the possible answers to that question and the leaves represent the predicted class(Reference Quinlan45). Building a decision tree requires selecting the best independent predictors for each node to split the data in a manner that best differentiates between the two classes of interest (i.e. child appealing v. not child appealing). Random forest and gradient-boosting trees use the Gini index to measure class impurity after each split, selecting the predictor that minimises class impurity. The difference between random forest and gradient-boosting trees is how the multiple decision trees are created and aggregated. Random forest uses a technique called bagging in which each decision tree is built independently, whereas, in gradient-boosting trees, the decision trees are added iteratively, aiming to improve deficiencies in previous trees(Reference Sutton46). This iterative process is controlled by a learning rate, which defines the contribution of each tree to the prediction of the outcome.
The conditional inference tree is composed of only one decision tree. The difference is that this decision tree is constructed by using a hypothesis significance test to select the best independent predictor at each node(Reference Hothorn, Hornik and Zeileis47). Thus, at each node, the algorithm tests, for each possible predictor, the null hypothesis between that predictor and the response variable (i.e. child appealing v. not child appealing). Then, the algorithm selects the predictor with the lowest P-value to split the node into two new nodes. The algorithm repeats this process until no further splits can be made while respecting the minimum number of observations in terminal nodes.
To reduce overfitting, the logistic regression model was trained using ridge regularisation (L2-norm). Similarly, the random forest, gradient-boosting tree and conditional inference trees were limited to a maximum depth of five levels to avoid complex models leading to overfitting. The model’s parameters were tuned using Bayesian optimisation on the training set using the search space presented in Table 3.
Table 3 Bayesian optimisation search space for the machine learning model parameters

Performance of the models
The best parameters were used to retrain each model using all training data, and the performance of the model was calculated on the held-out test set using the area under the receiver operating characteristic curve (ROC-AUC), the true-positive rate and the true negative rate. The true positive rate was calculated as the number of child-appealing food marketing instances correctly classified divided by the total number of child-appealing food marketing instances. Likewise, the true negative rate was calculated as the number of non-child appealing food marketing instances correctly classified divided by the total number of non-child appealing food marketing instances.
Relevant predictors
For the logistic regression, OR, 95 % CI and P-values were calculated for each predictor variable. Statistical significance was set at P < 0·05. For the ensemble models (random forest and gradient-boosting trees), feature importance was determined using permutation importance. Permutation importance was determined by comparing the score calculated using the original dataset with the score obtained by permuting the elements of each column. The features were ranked based on the increase in error due to the permutation. Finally, the conditional decision tree enabled us to visualise the features that were most important in determining whether marketing instances appealed to children or not.
Assessing the impact of changing the question
Since eighteen children answered the question ‘Is this ad for kids your age?’ and twenty-one children answered, ‘Is this ad for kids like you?’, we repeated the machine learning approach for logistic regression with the question represented as a binary predictor variable. Our rationale was to investigate if the impact of changing the question was significant.
Results
Descriptive statistics
Table 4 provides descriptive statistics for the numerical and categorical variables of the thirty-nine children. The average age was 9·1 years, and the number of males was similar to the number of females. Almost half of the children were White and came from households where a parent had received a bachelor’s degree or higher and had an annual household income > CAD $ 100 000. Most children reported spending at most 9 hours per week watching television, using the internet, and consumed unhealthy snack foods (e.g. sodas, chips and candy) four times per week or less. Most children consumed vegetables and fruits at least once per day.
Table 4 Descriptive statistics for the thirty-nine participants

*Corresponds to highest level attained by any parent in the household.
† Corresponds to how difficult or easy it is for the household to make ends meet.
Child agreement
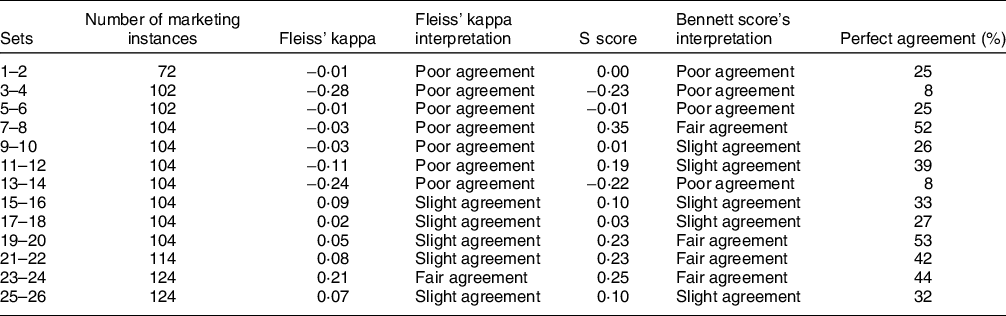
Table 5 shows agreement between children on whether the food marketing instances appealed to them. Using Fleiss’ kappa statistic, only one out of thirteen shared sets achieved fair agreement. Based on the S score, four shared sets had a fair agreement. The percentage of sets in which all three children agreed ranged between 8 and 53 %.
Table 5 Child agreement using the Fleiss’ kappa, the S score and the total percentage of cases in which all three children provided the same answer for food marketing instances
Model performance
The logistic regression, random forest, gradient boosting tree and conditional inference tree models achieved ROC-AUC of 0·61, 0·65, 0·60, and 0·60, respectively (Table 6). True positive rates tended to be slightly higher than true negative rates. The random forest was the model with the best performance, yielding a ROC-AUC of 0·65.
Table 6 Performance of the machine learning models for predicting whether food marketing instances appealed to children

ROC-AUC: The receiver-operating characteristic curve and AUC.
Logistic regression model
Table 7 shows the odds ratios from the logistic regression model. The logistic regression yielded five significant variables. The probabilities of the food marketing instance being child appealing, given its text and logos were significant. An increment of 1 % on text and logo probabilities increased the odds of a child finding a food marketing instance appealing by 2 % and 1 %, respectively. Vegetable consumption was also significant; children consuming vegetables more frequently found the food marketing instances less appealing. Males had 21 % lower odds of finding the food marketing instances appealing than females, and Asian children had significantly higher odds of finding instances appealing than White children.
Table 7 OR, 95 % CI and P-values for the logistic regression model to predict whether food marketing instances appealed to children

*Indicates that the variable is statistically significant with an alpha set at 0·05.
Assessing the impact of changing the question
The question variable was NS, indicating that changing the question did not have any significant effect on predicting whether the food marketing instances appealed to children. Moreover, OR for all predictors were similar to those obtained when question id was not included as a predictor (see Appendix 2).
Ensemble models
Figures 5 and 6 show the feature importance provided by the random forest and gradient-boosting trees. Marketing features in the text, logos and objects contained in the food marketing instances were the most important predictors of whether food marketing instances appealed to children. In both models, weekly consumption of vegetables and soda was also important. The models also underscored the importance of height and BMI z-score. For the frequency of screen use variables, the gradient-boosting model selected weekly hours spent on television as an important predictor.

Fig. 5 Variable importance to predict whether food marketing instances appealed to children in the random forest model

Fig. 6 Variable importance to predict whether food marketing instances appealed to children in the gradient boosting tree model
Conditional inference tree
Figure 7 shows the conditional inference tree when its maximum height is constrained to five levels. The text was again the most important factor in predicting whether marketing appealed to children. The node with the highest proportion of child-appealing food marketing instances (97 %; Node 18; n 236) was for Latin American, South Asian and White children, who watched television more than 4 hours per week and consumed vegetables less than times per week. The node with the lowest proportion of positive responses (14 %; Node 4; n 185) was for children who used tablets less than 4 hours per week and consumed chips at most once weekly. Notably, the two branches suggest that children with higher consumption of chips or lower consumption of vegetables found more food marketing instances appealing.

Fig. 7 Conditional inference tree for predicting whether food marketing instances appealed to children
Discussion
The most important predictors of child appeal were the elements contained in the food marketing instances, particularly the embedded text and logos. Other important predictors of the appeal of marketing included children’s consumption of vegetables and soda, children’s sex and weekly television hours.
Children’s weekly consumption of vegetables was an important determinant of whether they found food marketing to be appealing. This predictor was deemed important by all models, whereby children with low consumption of vegetables found more food marketing instances to be appealing. The random forest and gradient boosting tree also indicated the relevance of soda consumption, thus again showing that dietary intake predicts the appeal of food marketing. The conditional inference tree indicated that children who watched television more often found more food marketing instances to be appealing. Importantly, however, the random forest and gradient-boosting tree showed that the probability of a food marketing instance being child appealing given its text and logos was a much stronger predictor of child appeal than any of the children’s variables (i.e. socio-demographic characteristics, weight, height, BMI, frequency of screen use, dietary intake).
Children’s sex and ethnicity were also crucial in predicting whether food marketing appealed to them. Female children found more food marketing instances to be appealing than their male peers, suggesting that females were more receptive to food marketing strategies. Asian children had higher odds of identifying instances as appealing than White children based on the logistic regression model. There were no significant differences for children of other ethnicities. However, we note that most of the children (32 out of 39) were White or Asian, thereby it is challenging to make any firm conclusions in this respect.
We also found substantial disagreement among children as to which digital food marketing appealed to them. The low agreement between the children, based on Kappa’s Fleiss and S scores, shows that a marketing strategy can appeal to one child but not to another despite the fact that they may have similar characteristics (e.g. age, sex, household income). This disagreement shows the ambiguity of determining whether a food ad appeals to children. It also highlights how challenging it is to regulate digital food marketing as it is unclear which marketing techniques should be prohibited.
Because the text and logos contained in the food ads are related to promotional messages and well-known food brand characters (e.g. Ronald McDonald, Tony the Tiger), the relevance of these predictors given by the machine learning models shows their capacity to persuade children. This finding is consistent with previous studies which have reported that spokes characters or messages related to taste, fun or nutrition are among the most persuasive marketing strategies for children(Reference Elliott and Truman12).
Our finding that television time was an important predictor of whether children found food marketing to be appealing is consistent with previous studies that have reported that children’s food choice is affected by exposure to television(Reference Young18,Reference Boyland, Kavanagh-Safran and Halford20) . Thus, this supports the necessity of regulations to restrict the marketing of unhealthy food to children on television.
Previous research has underscored the challenges of operationalising what constitutes ‘child appealing’ food marketing(Reference Mulligan, Potvin Kent and Christoforou9). Our study did not overcome that challenge, but it can provide some insights in that direction. Specifically, given the high relevance of text and logos embedded in food ads as predictors of child appeal, it will be crucial to focus on these marketing elements when designing regulations to limit food marketing to children due to their persuasive effect on children.
Our work also supports the call for understanding how children’s backgrounds influence their attraction to food ads since marketing techniques do not have the same effect on all children(Reference Elliott and Truman12). Although we did not use qualitative techniques to understand the reason behind children’s answers, our quantitative approach showed how several characteristics of children predict whether digital food marketing appeals to them. For instance, we found that low consumption of vegetables can increase the likelihood that children find food ads to be appealing.
Strengths and limitations
To the best of our knowledge, this is the first study to use machine learning to quantify how marketing instance features and children’s socio-demographic characteristics, weight, height, BMI, frequency of screen use and dietary intake are associated with whether digital food marketing appeals to children. Our findings provide key data to understand which factors shape the appeal of digital food marketing to children.
Although the fitted models were able to identify important determinants of child appeal, model performance was poor (around 60 % in all metrics). One reason that can explain the limited performance of the models was the low agreement between children as to which marketing instances appealed to them. Low inter-rater agreement (children in our case) negatively impacts the performance of machine learning models in their attempt to generalise from training data(Reference Artstein and Poesio48,Reference Reidsma and Carletta49) . Thus, the low inter-rate agreement may have affected the capacity of our models to identify patterns explaining whether food marketing appealed to children. Another reason might be that additional predictor variables from the children need to be included to strengthen the predictive capacity of the models.
We did not use filtering techniques to remove food ads with low agreement because, due to the nature of this work, there is no objective truth (i.e. actual class: child appealing v. not child appealing) for each food ad. As such, we were unable to detect which children were systematically providing inconsistent answers. Moreover, filtering is often discouraged for subjective classification tasks, such as those in our work, because they can yield unrealistically high-performance scores for tasks in which genuine differences in interpretation are valid(Reference Jamison and Gurevych50,Reference Leonardelli, Menini and Palmero Aprosio51) .
Most of the children who participated in this study came from relatively advantaged households in terms of income and level of education, and most children were White or Asian. Our sample size was also small, although children labelled a relatively large number of marketing instances. Our results may therefore have limited generalisability. However, it is notable that despite the similarity of children in our sample, there was a substantial lack of agreement as to which food marketing instances appealed to them, suggesting that disagreement may have been even greater had our sample been more diverse.
In this study, we did not consider sex or age when assigning children to sets. This may have contributed to the low agreement among children, as children of similar age and sex might be attracted by similar marketing instances. Future studies should analyse whether grouping children by these characteristics and showing them food marketing instances that specifically target these groups (e.g. males 6–9 years v. females 6–9 years) improves agreement. We also note that we did not control for prior exposure to food marketing. As awareness and familiarity with food products and brands can influence preferences, prior exposure may have contributed to differences in children’s responses and should be considered in future studies. Finally, children in the current study were shown ads for both healthy and unhealthy products. Future studies should explore whether predictors of child appeal differ for healthy and unhealthy food ads.
Conclusion
This study examined associations between marketing instance features and children’s socio-demographic characteristics, weight, height, BMI, frequency of screen use and dietary intake to investigate the most important predictors of whether digital food marketing appeals to children. There was low agreement among children as to which food marketing instances appealed to them. Text and logos embedded in the food marketing instances were the most important predictors of child appeal. Children’s consumption of vegetables and soda, sex and weekly hours of television were also important predictors of the appeal of food marketing.
Acknowledgements
Acknowledgements: Not Applicable. Financial support: Canadian Institutes of Health Research (FRN 165925) and New Frontiers in Research Fund (NFRFE-2018-00793). Authorship: D.L.O. and Y.Y.L. designed the protocol to interview the children. Y.Y.L. conducted the interviews. C.E.V. and J.L. developed the machine-learning models. C.E.V. analysed the data. C.E.V., D.L.O. and J.L. interpreted the data. C.E.V. and D.L.O. drafted the manuscript. All authors read, edited and approved the final manuscript. Ethics of human subject participation: This study was conducted according to the guidelines laid down in the Declaration of Helsinki, and all procedures involving research study participants were approved by the Conjoint Health Research Ethics Board of the University of Calgary (Ref: REB21-0235). Verbal informed consent was obtained from all subjects/patients.
Conflict of interest:
Not Applicable.
Appendix 1 Companies and brands featured in food marketing ads

Appendix 2 OR, 95 % CI and P-values for the logistic regression model to predict whether food marketing instances appealed to children when the question is included as a predictor

*Means that the coefficient is statistically significant with an alpha set at 0·05.


 Open access