International interest in the traditional Japanese diet has grown, especially after the registration of UNESCO Intangible Cultural Heritage in 2013(1). The Japanese diet is also believed to have an impact on longevity among the Japanese population. In Japan, several policies and recommendations relating to nutrition have been established. The main dietary policies or recommendations in Japan include the Dietary Reference Intakes (DRI) for Japan(2), the Japanese Food Guide Spinning Top(Reference Yoshiike, Hayashi and Takemi3), the second term of the National Health Promotion Movement in the 21st century (Health Japan 21, 2013–2023)(4), and A Basic Act for Shokuiku (food and nutrition education/promotion)(5). Adherence to the Japanese Food Guide Spinning Top has already been demonstrated to reduce mortality and metabolic risk factors(Reference Kurotani, Akter and Kashino6,Reference Nishimura, Murakami and Livingstone7) .
The main strategies of these policies and recommendations differ. The relationships between these policies/recommendations and the concepts of nutrient-based, foodstuff-based and dish-based recommendations are shown in Fig. 1(Reference Adachi8,Reference Harigai and Adachi9) . DRI for Japan shows the recommended nutrient intake and is usually used in various situations of dietary education and meal planning by dietitians and other health professionals. Nutrient-based recommendations, such as the DRI for Japan, are difficult to apply in daily life by non-professionals because calculating the nutrient contents of meals is complicated. The Japanese Food Guide Spinning Top (2005) presents the recommended intake from three dish groups (grains, vegetables and fish and meat) and two additional food groups (fruit and dairy) per day to facilitate the selection of adequate foods in daily life(Reference Yoshiike, Hayashi and Takemi3). In addition, Health Japan 21 (2013–23) has set the dietary goal (DG) to increase the number of people who consume meals that include staple, main and side dishes (an SMS meal that includes SMS dishes in one meal) more than twice a day, every day, from 68·1 % in 2011 to 80 % in 2022(4). Moreover, A Basic Act for Shokuiku (food and nutrition education/promotion) set a similar goal to increase the proportion of individuals who consume SMS meals more than twice a day among all Japanese people, especially those aged 20–39 years(5).
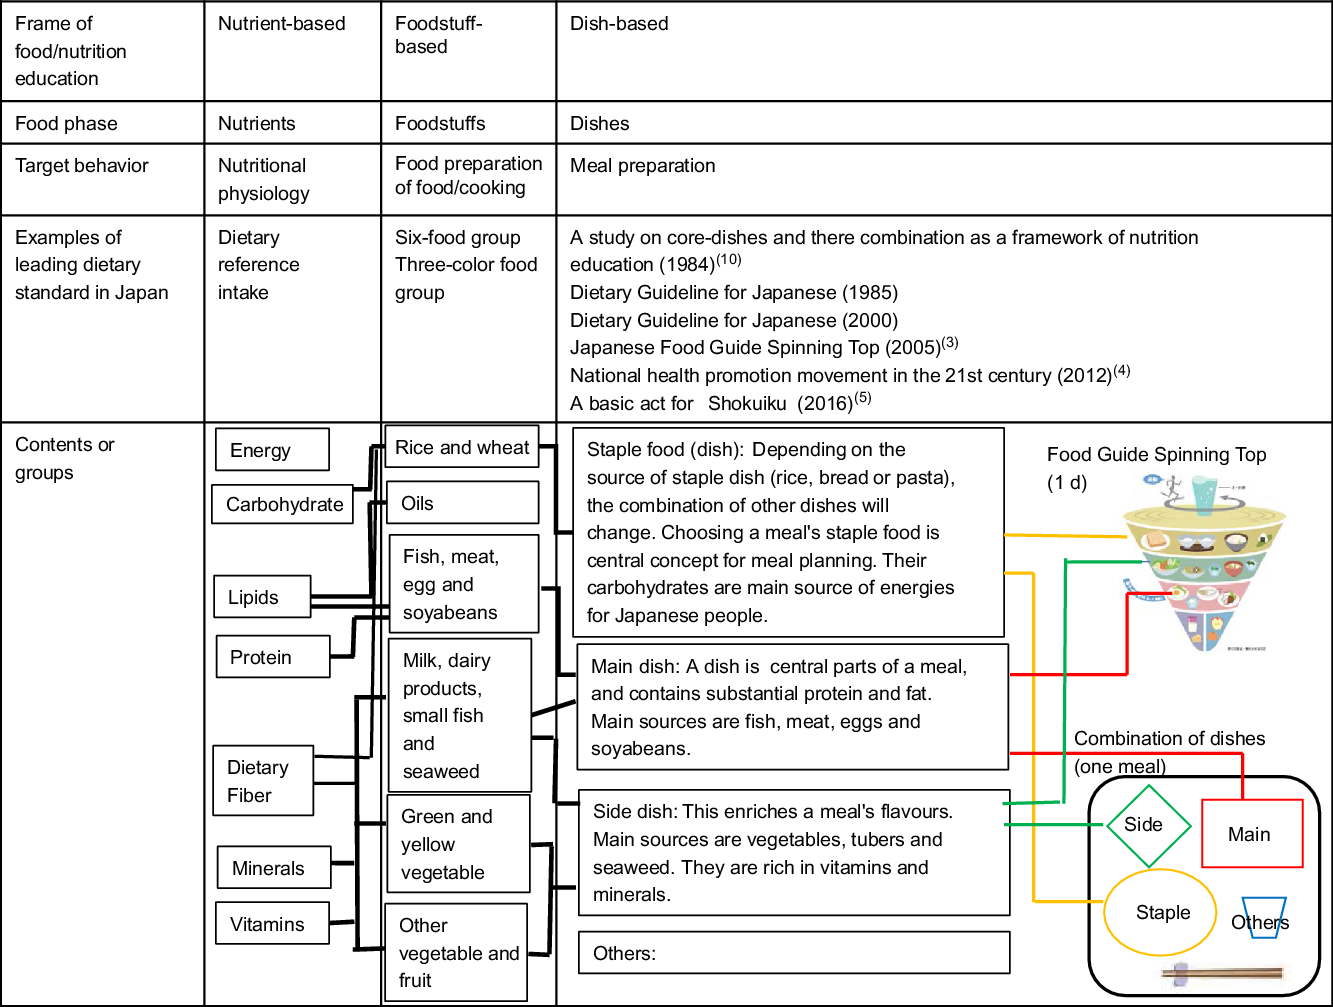
Fig. 1 A framework of food/nutrition education. The stratified framework of level of food intake, target behaviour, examples of leading dietary standards, and their contents (nutrients, food groups and dishes) were categorised according to the level of food/nutrition education
A complete SMS meal includes SMS dishes and is the traditional and cultural concept of a single meal in Japan. Adachi first mentioned this concept as a tool for nutrition education with a dish-based recommendation(Reference Adachi10). Adachi suggested that a practical recommendation for a daily diet, rather than a nutrients-based recommendation alone, was needed to achieve a healthy diet. In this concept, SMS dishes are defined based on their size and main ingredients. Following this work, the usefulness of this dish-based recommendation has been carefully studied(Reference Adachi10,Reference Harigai and Adachi11) .
However, more than 30 years have passed since the concept of SMS meal as a dish-based recommendation was first established. During this time, dietary intakes, lifestyle and health status in Japan have changed dramatically(Reference Saito, Imai and Htun12). Thus, the concept of SMS meal in relation to nutrient intake needs to be explored again, especially given that this dish-based concept is still used in many recent nutritional policies.
In this study, we aimed to clarify the relationship between (i) consuming an SMS meal and the intake of each nutrient, and (ii) consuming an SMS meal and agreement of DRI for Japan, using data from the Japan National Health and Nutrition Survey (JNHNS)(13). Using JNHNS data enabled us to examine these relationships across broad age groups representing the Japanese population.
Methods
Study design
De-identified records from the 2012 JNHNS were cross-sectionally analysed. Secondary use of the data was permitted by the Japanese Ministry of Health, Labour and Welfare.
Study population
The original JNHNS survey included 32 228 subjects aged 1–103 years. In that survey, targeted households were selected by a stratified single-stage cluster design across all forty-seven prefectures in Japan. The household response rate was 67 %. The individual response rate was not officially reported, but has been estimated to be around 60 %(Reference Nishi, Nakade and Sarukura14). The following subjects were excluded from the current analysis: 1370 subjects aged ≤5 years, 368 subjects who were pregnant or lactating, and 221 subjects with an energy intake ±3 sd for each sex and age group. Children aged ≤5 years were excluded because the Japanese Food Guide Spinning Top used to define SMS dishes can only be applied to subjects aged ≥6 years(Reference Yoshiike, Hayashi and Takemi3).
Dietary assessment
Dietary data were collected using semi-weighed dietary records that were completed on one weekday between October and November 2012, as described elsewhere(Reference Katanoda and Matsumura15–Reference Iwaoka, Yoshiike and Date17). Briefly, dietary intake was recorded by a representative household member who was responsible for preparing meals and beverages consumed by all household members. This representative person was asked to weigh each food before and/or after preparation, and to record the weight of food that was uneaten. When the household members shared foods or dishes, the representative household member was asked to record the approximate proportions of foods consumed by each household member. If the weighing of food was difficult, she/he was asked to record the portion size. When the household members ate out, he/she was asked to record their food intake and portion size. In addition, the staff dietitians collected information about the menus of child participants’ school lunches. The staff dietitian confirmed what food had been eaten at outside the home with each household member. However, if this was not possible, the staff dietitian asked the representative person to confirm the dietary record when it was not completely recorded. Then, the staff dietitians converted these portion sizes into an estimated weight, and explained these procedures to the representative person. The participants distinguished meals into breakfast, lunch and dinner, and reported these on separate sheets. All drinks and foods consumed that were not meals were categorised as snacks. Macro- and micronutrients were calculated using the Shokuji Shirabe(18), which is an exclusive software developed for the JNHNS according to the 2010 Standard Tables of Food Composition(19). Foods were grouped according to the food classifications used in the JNHNS (cereals, potatoes, sugar, beans, seeds, vegetables, fruits, mushrooms, seaweed, fish, meat, eggs, dairy products, oils, sweets, drinks and seasonings)(Reference Katanoda and Matsumura15).
Other assessments
Body height and body mass of approximately 90 % of the participants were measured by trained fieldworkers using standardised procedures. For the remaining participants, height and mass were measured either by other household members at home or were self-reported. BMI was calculated as body mass divided by height-squared.
In addition, the first page of the dietary assessment sheet asked participants about their occupation status and exercise habits. If participants exercised >2 d/week for >30 min at a time, and had done so for >1 year, they were classified as having an exercise habit, and answered questions about the frequency, duration and intensity of their exercise.
Calculation of staple, main and side meal frequency
To assess the consumption of an SMS meal from the JNHNS data, we used the definitions of SMS dishes of the Japanese Food Guide Spinning Top(Reference Yoshiike, Hayashi and Takemi3), because it was difficult to apply the basic concept of each dish developed by Adachi(Reference Adachi10) to dietary data from the JNHNS. One serving of each dish was defined as follows: staple dish: 40 g of carbohydrate from grain (including rice, bread and noodles); main dish: 6 g of protein from meat, fish, eggs or beans; side dish: 70 g of vegetables (including mushrooms, potatoes and seaweed)(Reference Yoshiike, Hayashi and Takemi3). As with previous studies(Reference Koyama, Yoshita and Arai20,Reference Koyama, Yoshita and Arai21) , if a subject consumed at least half a serving of any of these dishes, they were considered to have consumed that dish. A complete SMS meal was defined as a meal that included SMS dishes in a single meal. The number of servings was calculated using two methods. In the first method, the number of servings of each dish on the same plate was calculated, then the number of servings of each dish at one meal was summed. This is the usual method to calculate the number of servings when using the Japanese Food Guide Spinning Top in nutritional education. In the second method, all foods in a single meal were added together, and the number of servings of each dish was calculated. We found that the second method was easy to apply when calculating the number of servings of each dish from the dietary data, and used this method in the study. There were a total of 30 269 meals recorded by all participants; 91·4 % of these meals were similarly distinguished as an SMS meal or not, according to these two methods.
The frequency of consuming SMS meals was classified into ≤1, 2, ≥3 times per day. Meals were distinguished into breakfast, lunch and dinner. In addition, drinks and foods consumed at times outside of these meals were categorised as snacks. A small proportion of participants (0·8 %) ate an SMS meal as a snack; as a result, 0·1 % of participants consumed SMS meals four times a day.
Statistical analyses
Data of subjects’ characteristics are expressed as mean and sd for numerical data, and as numbers and percentages for categorical data. Other numerical data, including energy, nutrient intake and intake for each food group, are expressed as adjusted mean and 95 % CI. Data were analysed using a linear mixed model, including nine regions in Japan (Hokkaido, Tohoku, Kanto, Hokuriku, Tokai, Kinki, Chugoku, Shikoku and Kyushu) and age as random effect variables. We divided participants into five age groups, as follows: 6–11 (elementary school), 12–17 (junior and senior high school), 18–40 (early adults), 41–64 (late adults) and ≥65 (elderly) years.
To assess the relationship between the frequency of SMS meals and healthy nutrient intake, nutrient intakes were compared with the upper and lower limits of a tentative DG for preventing lifestyle-related diseases. In DRI for Japan, DG was set as a percentage of energy intake (%E) from protein, fat, carbohydrate, SFA and grams per day of dietary fibre and salt. If the nutrient did not have a DG, nutrient intake was compared with the estimated average requirement (EAR) and the tolerable upper intake level (UL) of the DRI for Japan 2015(2). The DRI for Japan 2015 presents DG or EAR for a total of thirty-four nutrients. Iodine, Se and Mo were excluded because of insufficient information on these in food composition tables. We applied 0·45 and 0·50 mg and 4·8 mg niacin equivalent per 4184 kJ energy intake for the EAR of vitamin B1, vitamin B2 and niacin according to EAR. The tolerable UL for vitamin A, folate, Ca, Fe, Zn and Cu was used to assess excess intake. Age groups in the DRI for Japan 2015 were 6–7, 8–9, 10–11, 12–14, 15–17, 18–29, 30–49, 50–69, and >70 years. DG, EAR and UL for the age groups used in the present study were calculated by the weighted mean of each sex and age group. In this study, EAR of Fe for menstruating women was used as EAR of Fe for all women aged 10–69 years.
Energy adjustment was conducted for vitamin A, vitamin B6, vitamin B12, folate, vitamin C, minerals, dietary fibre, salt and intake from each food group to avoid the effect of underestimation caused by the dietary survey(Reference Willett, Howe and Kushi22). Energy adjustment was calculated as follows: energy-adjusted nutrient or food intake was calculated as amount per day = (reported intake of nutrient or food) × (estimated energy requirement)/(reported energy intake)(Reference Asakura and Sasaki23). The estimated energy requirement for each subject was calculated as the standard RMR shown in DRI for Japan 2015(2) multiplied by the subject’s body mass and physical activity level. Physical activity level was determined according to the subjects’ occupations and exercise habits based on the DRI for Japan(2).
Linear trends in energy-adjusted intakes, %E intake, and per 4184 kJ intake of nutrient- and energy-adjusted food intakes across the frequency of SMS meals were compared using a generalised linear model after adjusting for age and the nine regions in Japan, because these could be potential confounding factors on the relationship between the frequency of SMS meals and nutrient or food intake.
To calculate the proportion of subjects who consumed less than the DG (lower limit) or EAR and more than the DG or UL, the distribution of usual intake in these subjects was estimated using the best power method(Reference Nusser, Carriquiry and Dodd24,Reference Yokoyama25) because the JNHNS only included a 1-d dietary survey. To use the best power method, power transformations and ratios of within- to between-individual variance were quoted from a previous study that reported dietary intake among the normal Japanese population(Reference Yokoyama25). Distribution estimation was conducted using an exclusive software (HabitDist)(Reference Yokoyama26). The proportion of subjects who consumed less than the DG (lower limit) or EAR and more than the DG or UL by the frequency of SMS meals was compared using the χ 2 test. All other analyses were conducted using IBM SPSS (version 22·0) for Windows (IBM). Two-sided P < 0·05 was considered statistically significant.
Results
The proportion of subjects who ate an SMS meal ≥3 times per day was highest among subjects aged ≥65 years, for both male and female participants (Table 1), while the proportion of subjects who ate ≤1 SMS meal per day was highest among male and female participants aged 18–40 years. Approximately 90 % of subjects of both sex and all age groups except for the 18–40 and 41–64 years groups ate home-cooked breakfast and dinner, including meals eaten at home and taken in a lunch box. Over 90 % of boys and girls aged 6–11 years ate school lunches. Almost equivalent numbers of 12- to 17-year-old boys and girls ate school lunches and home-cooked meals, either eaten at home or taken to school in a lunch box.
Table 1 Age, physical characteristics, frequency of SMS meals and type of each meal by age and sex group
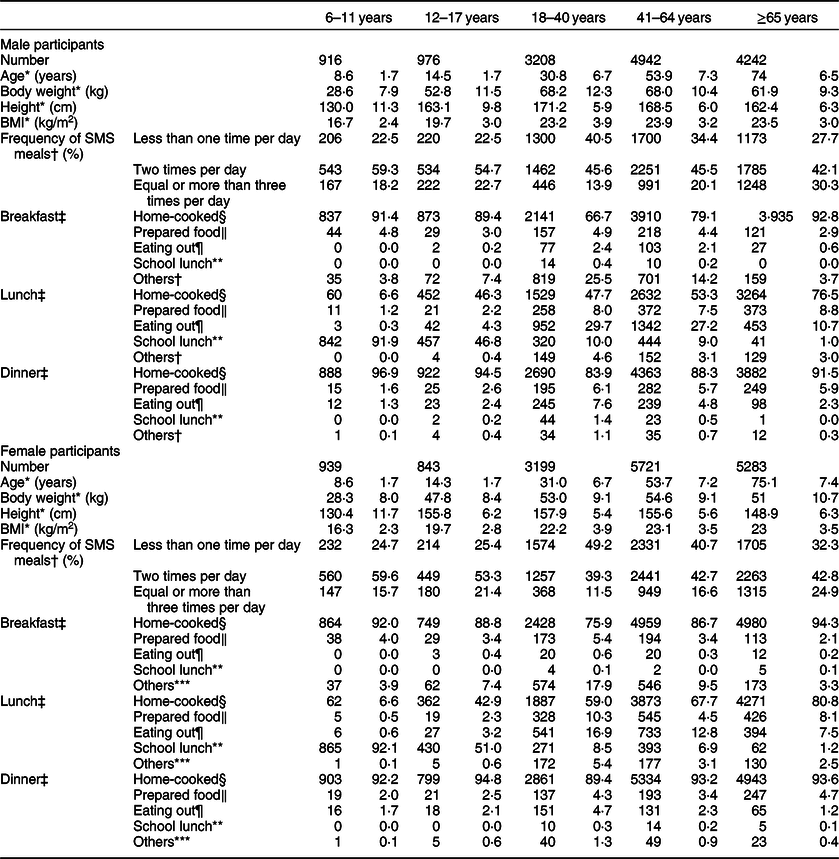
* Mean values and sd.
† An SMS meal is a meal that includes staple, main, and side dishes together in one meal.
‡ Numbers and percentages.
§ Home-cooked: Food cooked at home and either eaten at home or taken out in a lunch box.
∥ Prepared food: Take-away or home-delivered food eaten at home.
¶ Eating out: Food eaten outside the home either at a restaurant or as a take-away.
** School lunch: A school-prepared lunch or food bought at a company cafeteria.
*** Others: Skipped meal, a supplement, or drink only, or unknown.
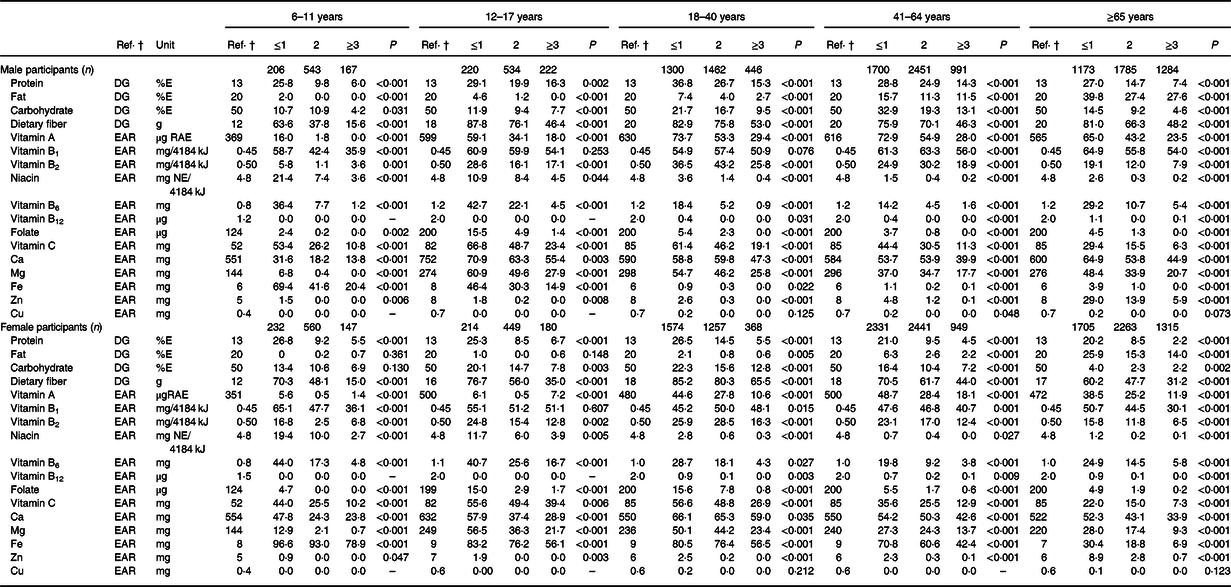
A trend analysis examined the relationship between the frequency of SMS meals and nutrient intake (see online supplementary material, Supplementary Table 1a and 1b). Energy intake was significantly higher with a higher frequency of SMS meals, and this was true for all sex and age groups (P < 0·01). Among the male participants, protein, dietary fibre, vitamin A, vitamin B6, folate, vitamin C, Mg, Fe, Zn, Cu and salt intake were higher with a higher frequency of SMS meals in all age groups. However, vitamin B1, vitamin B2 and vitamin B12 intake was not related to the frequency of SMS meals in all age groups. Among the female participants, the intakes of protein, dietary fibre, folate, vitamin C, Ca, Mg, Fe, Zn and Cu were higher with a higher frequency of SMS meals in all age groups. However, vitamin B2 intake was not related to the frequency of SMS meals in all age groups.
In male participants aged 6–11 years, the intakes of potatoes, beans, vegetables, fish and meat were higher with a higher frequency of SMS meals (see online supplementary material, Supplementary Table 2a). In addition to intakes from these food groups, male participants aged 12–17 consumed more mushrooms and seaweeds, but not fish and meat, as the frequency of SMS meals increased. In subjects aged 6–11, 12–17, 18–40, and 41–64 years, sweet intake was lower with an increasing frequency of SMS meals. Among men aged 18–40, 41–64 and ≥65 years, intake from almost all food groups was higher as the frequency of SMS meals increased, except for cereals, sugar, seeds, dairy products and oils in those aged 18–40 years; sugar, seeds, fruits, dairy products and oils in those aged 41–64 years; and cereals, sugar, dairy products and oils in those aged ≥65 years. In all female participants, sweet intake was lower as the frequency of SMS meals increased (see online supplementary material, Supplementary Table 2b). Among 6- to 11-year-old girls, the intake of cereals, sugar, fruits, meat, eggs and oils were not related to the frequency of SMS meals. However, in 18- to 64-year-old women only, the intake of sugar, seeds and oils was not related to the frequency of SMS meals, while in women aged ≥65 years, sugar, fruits, seaweeds and seasonings intakes were not related to the frequency of SMS meals consumed.
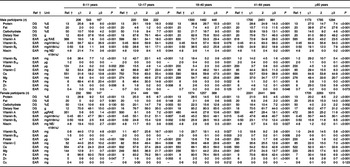
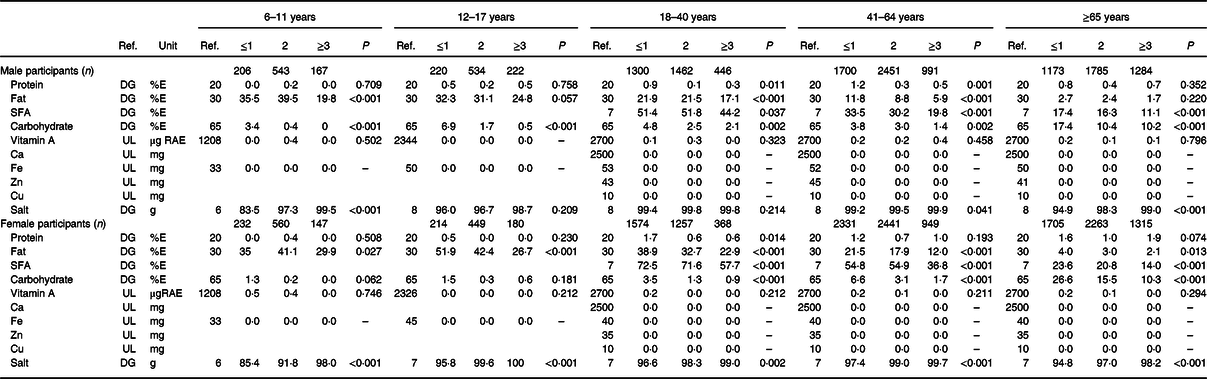
The proportion of subjects with a nutrient intake less than the DG (lower) or EAR was compared according to the frequency of SMS meals consumed (Table 2a). For almost all nutrients, the proportion of subjects who had an intake that was less than the DG (lower) or EAR was lower with an increase in the frequency of SMS meals. Almost none of the participants consumed protein, carbohydrate, vitamin B12 or Cu less than the lower limit of DG or EAR. However, ≥50 % of participants who consumed SMS meals more than twice a day still had an inadequate intake of some nutrients, and this differed between sexes and age groups. This included an inadequate intake of vitamin A in men aged 18–40 and 41–64 years; vitamin B1 in men aged 12–17, 18–40, 41–64 and ≥65 years and women aged 12–17 and 18–40 years; Ca in men aged 12–17, 18–40, 41–64 and ≥65 years and women aged 18–40 and 41–64 years; and Fe in female participants <65 years.
Table 2a Proportion of subjects who consumed less than the lower reference values by the frequency of meals including staple, main and side dishes by age group*
DG, dietary goal; EAR, estimated average requirement; %E, proportion of energy from each nutrient; RAE, retinol equivalent; NE, niacin equivalent.
* The proportion of subjects who consumed less than the DG or EAR was estimated using the best power method.
† Reference values (Ref.) were calculated as the weighted mean values of subjects, including each sex and age group. The P-value was estimated using the χ 2 test. ≤1, 2 and ≥3 indicate the frequency of SMS meals per day. An SMS meal was defined as a combination of staple, main and side dishes.
Table 2b shows the proportion of subjects with a nutrient intake that was more than the DG or UL. Only a small number of subjects consumed excessive nutrients than the reference values, and this included all nutrients except for SFA and salt. In addition, only the proportion of subjects with an excessive salt intake increased by an increase in the frequency of SMS meals.
Table 2b Proportion of subjects who consumed more than the upper reference values by the frequency of meals including staple, main and side dishes by age group*
RAE, retinol equivalent; NE, niacin equivalent; DG, dietary goal; RDA, reference dietary intake; %E, proportion of energy from each nutrient.
* The proportion of subjects who consumed more than the UL (upper limit of DG) was estimated using the best power method. Reference values (Ref.) were calculated as weighted mean values of subjects, including each sex and age group. ≤1, 2 and ≥3 represent the frequency of SMS meals per day. An SMS meal was defined as a combination of staple, main and side dishes.
Discussion
In this study, we found that as the frequency of SMS meals increased, the intake of most nutrients and food groups also increased. In addition, with an increase in the frequency of SMS meals, there was an increase in subjects who met the DG or EAR for most nutrients. However, even in subjects who consumed more than two SMS meals a day, it seemed difficult to meet the DG or EAR for SFA, vitamin A, vitamin B1, Ca, Fe and salt. In addition, excessive salt intake increased as the frequency of SMS meals increased.
In this study, the proportion of both male and female subjects who consumed ≥2 SMS meals a day was lowest among subjects aged 18–40 years. It is difficult to compare this finding with previous ones because other studies had primarily assessed the number of days per week in which two or more SMS meals were consumed. In addition, the definitions of SMS dishes were not comparable with other studies. The Consciousness Survey for Shokuiku 2018 was conducted among adult men and women, and the results suggested that the proportion of subjects who ate ≥2 SMS meals almost every day increased with age(27). We also found that the proportion of subjects who ate ≥2 SMS meals a day was higher among subjects aged ≥65 years than in subjects aged 18–40 and 41–64 years. Similarly, Kakutani et al.(Reference Kakutani, Kamiya and Omi28) reported that only about half of men and women aged 18–24 years ate more than two SMS meals a day for >3 d a week. While there is a lack of published data in children, we assume that the high proportion of children who consumed SMS meals is partly a result of the school lunch system in Japan; our results suggest that >90 % of subjects aged 6–11 years and nearly half of subjects aged 12–17 years ate school lunches. A study comparing nutrient intake between school days and non-school days among elementary and junior high school students concluded that school lunches improved nutritional intakes(Reference Asakura and Sasaki23).
Intakes of most nutrients were higher with a higher frequency of SMS meals. In addition, a lower proportion of participants consumed less than the lower limit of DG or EAR in most nutrients for subjects who ate SMS meals at least twice a day, compared with subjects who less frequently ate SMS meals. Eating ≥2 SMS meals a day may represent a way to increase nutrient intake in the population. However, our results also suggest that it is quite difficult to consume sufficient vitamin A, vitamin B1, Ca and Fe simply by eating SMS meals. Koyama et al.’s(Reference Koyama, Yoshita and Sakurai29) study suggested that subjects with a higher frequency of SMS meals increased their intake of energy, Na, K, Ca, Fe, vitamin B1, vitamin B2 and vitamin C. In addition, subjects who consumed SMS meals <1·5 times per day were less likely to meet the DRI for Ca, vitamin A, vitamin B1, vitamin B2 and vitamin C. Okubo et al.(Reference Okubo, Sasaki and Murakami30) examined optimal food intake patterns using a linear programming model. The authors suggested that Fe, vitamin B1, retinol activity equivalent and Mg made it difficult to analyse the optimal food intake pattern. In addition, the ideal food intake pattern predicted by the model was not that different to the actual intake, except for the intake of fruits and vegetables for younger age groups, and whole grains for all age groups. One possible reason for the difficulty in achieving an adequate intake of some nutrients is that only some foods are rich in vitamin A, vitamin B1, Ca and Fe. In addition, an SMS meal as defined here does not include an intake of milk and dairy products. Thus, it would be difficult to consume sufficient milk and dairy products by only consuming SMS meals. We therefore propose that more information relating to foodstuff choice in main and side dishes is needed to meet the DRI for these nutrients when dish-based recommendations are used. In addition, the use of refined or whole grains in a staple dish is also recommended.
We also found that high proportions of participants consumed excessive salt, fat and SFA compared with those recommended in the DG. The proportion of participants who consumed excessive fat and SFA decreased with the frequency of SMS meals, but was still high among participants aged 18–40 years who consumed SMS meals ≥3 times a day. On the other hand, the proportion of excessive salt intake increased with the frequency of SMS meals. This excessive salt intake is partly caused by an increased use of seasoning with an increase in the frequency of SMS meals. Takimoto et al.(Reference Takimoto, Saito and Htun31) showed that the main salt source in Japanese food is salt-containing seasoning and Chinese noodles. Okubo et al.(Reference Okubo, Sasaki and Murakami30) also suggested that salt and SFA intake were the limiting factors to make an optimal food intake pattern. Their model suggested that the intake of reduced-fat dairy products should be increased, and that of full-fat dairy products and salt-containing seasoning should be reduced from the current food intake pattern to meet the DRI for Japan.
Dish-based recommendations could have a positive impact on dietary intake. However, the relationship between nutrient- and dish-based recommendations depends on the dietary pattern of the time. Thus, the evaluation of these educational tools should be ongoing. A similar simple tool for recommending a combination of food intake patterns is MyPlate, which was developed in 2011 in the USA. MyPlate is a foodstuffs-based concept rather than dish-based one, and includes a recommended daily intake of grain, protein, vegetables and fruits on one plate, in addition to dairy products. While one review evaluating the use of MyPlate over 8 years found a lack of evidence to support its efficacy(Reference Chrisman and Diaz Rios32), another study that examined its efficacy in enforcing healthy eating habits suggested that the awareness of MyPlate increased the Healthy Eating Index(Reference Jahns, Conrad and Johnson33). Although MyPlate includes five food groups, it only recommends checking whether each food group is represented in one meal, without showing its quantity. One intervention study used MyPlate, but they only reported an improvement of the knowledge of DG rather than any actual changes in nutrient intake or health(Reference Brown, O’Connor and Savaiano34).
A most serious limitation of the present study is that the dietary survey in JNHNS was only completed on one day, from which we calculated the frequency of SMS meal intake. Thus, we could not assess the habitual frequency of SMS meal consumption and the associated nutrient intake. Nonetheless, our study provides an indication of such an association. In addition, to calculate the proportion of subjects who did not meet the DG, EAR or UL, we used the best power method to estimate the habitual distribution of nutrient intakes. Second, dietary surveys are known to underestimate food intakes(Reference Willett, Howe and Kushi22). In this study, we applied energy adjustment for nutrients intake and intakes of each food group based on the estimated energy requirement. To calculate the estimated energy requirement, physical activity level was categorised according to the subjects’ occupations and exercise habits; however, this may still result in some errors in the estimation of subjects who did not meet the DG, EAR or UL. It is also possible that the use of energy adjustment resulted in an over-adjustment, especially for subjects who did not eat an SMS meal often. However, although the subjects with a higher frequency of SMS meals consumed more energy, the energy-adjusted intake of nutrients and food was still higher among those subjects compared with subjects who consumed an SMS meal less often. Third, the distribution of Fe requirement is known to be skewed, especially for menstruating women(35). However, we could not estimate the population distribution of intake from a one-day dietary survey and skewed requirement distribution simultaneously. We used the same statistical method to estimate the proportion of subjects who did not meet the DG with other nutrients, which could have caused errors in estimating the subjects who did not meet Fe requirements. Fourth, the definition of an SMS meal did not follow the basic concept of SMS dishes proposed by Adachi(Reference Adachi10). In the present study, we used foodstuff- and nutrient-based definitions of the Japanese Food Guide Spinning Top to analyse the dietary survey data from JNHNS(Reference Yoshiike, Hayashi and Takemi3). Fifth, we only used age and region as covariates. Given the limited data in JNHNS, we could not examine other variables that may have affected the relationship between the frequency of SMS meals and nutrient intake. Sixth, this study obtained data from the JNHNS database, and so we could not control the dietary assessment method. In this survey, the staff dietitian met the representative person in each household, and verified information about foods eaten outside the home with each individual household member. However, if this was not possible, the representative person asked their household members about details of foods eaten outside the home and confirmed these with the dietitian. To increase the accuracy of dietary survey outside of the home, the staff dietitian collected the school lunch menus of all child participants.
In conclusion, the consumption of SMS meals at least twice a day is associated with a higher nutrient intake and a higher proportion of participants meeting the DRI across all age groups. Thus, the consumption of SMS meals at least twice a day could be a useful and straightforward nutrition goal in daily life. However, more information on foodstuff choice in main and side dishes is needed to meet the DRI for vitamin A, vitamin B1, vitamin B2, Ca and Fe, and to avoid an excessive intake of SFA and salt.
Acknowledgements
Acknowledgements: We thank Marion Barnett, BSc, from Edanz Group (www.edanzediting.com/ac) for editing a draft of this manuscript. Financial support: This work was supported by the Health and Labour Sciences Research Grants (Special Research Project H26-tokubetsu-shitei-033) from the Ministry of Health, Labour and Welfare of Japan, and Health Japan 21 (the second term), analysis and assessment project. Conflict of interest: There are no conflicts of interest. Authorship: K.K.I.-T. analysed the data and drafted and critically revised the manuscript. K.K and H.T. drafted and critically revised the manuscript. M.A. joined the discussion to revise the manuscript. All authors contributed to the interpretation of the results and read and approved the final manuscript. Ethics of human subject participation: This study was conducted in accordance with the Ethical Guidelines of Epidemiological Research. This study was exempt from the application of these guidelines because anonymised data was only used in this study. The protocol of the present study was approved by the Ethics Committee of the National Institutes of Biomedical Innovation, Health and Nutrition (20141225-01, 25 December 2014).
Supplementary material
For supplementary material accompanying this paper visit https://doi.org/10.1017/S1368980020001202