


Breakfast has traditionally been recommended as being one of the most important meals of the day. Inverse associations exist between consumption of breakfast and many health outcomes such as improvements in weight, risk of diabetes and cardiovascular health to name a few(Reference Ruddick-Collins, Johnston and Morgan1–Reference Williams4). However, some of these relationships have been questioned, with findings suggesting important study design, age, sex and meal composition effects(Reference Ardeshirlarijani, Namazi and Jabbari5–Reference Sievert, Hussain and Page8).
Dietary recommendations in the UK suggest that breakfast should contribute approximately 20–25 % of total energy intake, with breakfast foods being taken from the five main food groups of fruits and vegetables, milk and dairy, protein sources, low fat spreads and oils, and starchy foods (including cereals, pasta and bread). The fortification of cereals provides an important source of micronutrients for many individuals in the UK. However, the most recent National Diet and Nutrition Survey(9) data suggest cereals and cereal products were the main source of free sugar in children aged 1·5–3 and 4–10 years, and in adolescents and adults were the second main source. Subsequently, Public Health England included breakfast cereals (BC) as a food which manufacturers should reduce sugar content by 20 % by 2020 in their Sugar Reduction Report(10).
BC can be categorised into ‘hot’ and ‘ready-to-eat’(11). Hot BC, such as porridge, require further cooking. Ready-to-eat BC can be immediately consumed without added processing and are categorised by their processing method, rather than the grain used(11). Different types of BC from varying manufacturing methods include flaked, gun puffed (GP), extruded gun puffed (EGP), oven puffed (OP), shredded wholegrain (SW) or biscuit formation (online supplementary material, Supplemental Table 1). Therefore, it is possible to create products that vary in shape, size, colour, density and volume of air.
There has been an indisputable increase of portion size in processed, energy-dense foods with little nutritional value(Reference Nielsen and Popkin12,Reference Piernas and Popkin13) . There is global concern that supersizing of food portions has altered the perception of what is healthy to consume(Reference Benton14). Distorted portion perception has led to passive obesity where generations are successively heavier, resulting in normalisation of obesity(Reference Butland, Jebb and Kopelman15). Further evidence has demonstrated this same trend of increasing portion sizes over time in the UK(Reference Benson16–Reference Rippin, Hutchinson and Jewell18) and in Europe(Reference Steenhuis, Leeuwis and Vermeer19). The British Heart Foundation released a report in 2013(20) suggesting that the discrepancy in recommended serving size (RSS) across products since 1993 has led to a distorted portion perception leading to consumer confusion. Indeed, when participants were asked to serve flaked BC (cornflakes) into a bowl, 88 % portioned more than the RSS(20). RSS of a product is determined by manufacturers and differs to portion size which is the amount of food chosen to eat(Reference Rippin, Hutchinson and Jewell18). Evidence suggests that RSS can be exploited as a marketing strategy, with some products appearing more nutritious than a realistic portion(Reference Kliemann, Kraemer and Scapin21). Nevertheless, the European Breakfast Cereal Association(22) provides guidance for British BC brands on the RSS depending on product density, as well as considering the history of RSS for the BC and actual consumption data.
Research studying the typical portion sizes of flaked BC selected by young adults showed that the average portion exceeded recommendations by over 25 %(Reference Schwartz and Byrd-Bredbenner23). Additionally, rising obesity levels justify the importance of improved understanding of how physical food properties can affect portion size and energy intake. Literature has demonstrated the role of visual cues influencing portion size, including the image shown on packaging of BC, to the bowl size used(Reference Tal, Niemann and Wansink24), in addition to important properties such as density, volume and colour(Reference McClain, van den Bos and Matheson25–Reference Osterholt, Roe and Rolls27). Rolls et al. (Reference Rolls, Meengs and Roe28) used the same type of flaked BC which was modified to decrease volume to 40 %. As flake size reduced, volume of the serving decreased, and there was a significant increase in the weight of the flakes poured and the energy content of the portion. Therefore, the denser the BC, the more energy was consumed. However, a limitation of these types of study is the cereals used are relatively homogenous and fail to consider how different types of BC with varying appearances and properties may influence portion size. The purpose of the present study was to determine whether different types of BC influence portion size and as a result, energy and macronutrient content per serving.
Methods
Recruitment
Participants were recruited through randomised convenience and snowball sampling. A total of eight recruitment sessions were conducted from 20 November 2019 to 26 February 2020 around Chester city centre. Subjects were told the purpose of the study was to investigate the portion size awareness of BC.
Participants were excluded if they met any of the exclusion criteria or did not meet the inclusion criteria. All eligible participants signed an informed consent form before taking part in the study.
Eligibility and screening
Participants were eligible to complete the study if they were older than 18 years and regularly consumed BC. Participants were not eligible if they had completed a Nutrition or Dietetics degree, were taking any medication known to have appetite-suppressing effects, were pregnant or lactating, were intentionally trying to lose weight, had any severe allergies or had a previously diagnosed eating disorder. These factors were likely to influence an individuals’ perception of portion size.
Anthropometric measurements
All participant’s height and weight were measured in light clothing, without shoes. Upright height (m) was measured using a portable stadiometer (SECA, Leicester Height Measure) and recorded in m to the nearest 0·01 m. Weight (kg) was measured using a portable electronic scale (SECA, 877) and recorded to the nearest 0·1 kg. BMI was calculated as weight divided by height squared (kg/m2).
Procedure
Participants were asked by the researchers to pour a serving of each BC as if they were to consume it at home. This was reported as the freepour measure. A white, porcelain 650 ml bowl (15 cm × 7 cm (diameter and depth, respectively)) was used through the testing and each participant used the same bowl for each measurement. The researchers identified ten different types of BC (Table 1). The nutritional information for each product was obtained from the back of pack labelling and is displayed in Table 2. The BC were presented in the same order for each participant and stored in a transparent 3-l Tupperware® container. All bowls of BC were discretely weighed on an electronic kitchen scale (HoMedics Groups Ltd, Salter) and recorded to the nearest 1 g. Neutral phrases were used throughout the process including words such as ‘thank you’ or ‘next’ to avoid the participant detecting verbal cues, which may have influenced portion size.
Table 1 BC products with corresponding brand, manufacturing method and RSS*

RSS, recommended serving size; BC, breakfast cereal; F1 flaked 1; F2, flaked 2; GP, gun puffed; EGP, extruded gun puffed; SW, shredded wholegrain; OPC, oven-puffed coloured; OP, oven puffed; BF, biscuit formation.
* Weight shown in g.
Table 2 Nutritional information for the BC*

BC, breakfast cereal; CHO, carbohydrates; F1, flaked 1; F2, flaked 2; GP, gun puffed; EGP, extruded gun puffed; SW, shredded wholegrain; OPC, oven-puffed coloured; OP, oven puffed; BF, biscuit formation.
* Data shown in kJ and g/100 g.
Statistical analysis
Analysis was carried out using GraphPad Prism (version 8.0.1). The difference between the freepour measure and the RSS was calculated. RSS was taken from the cereal packaging. The difference between the RSS and freepour value is referred to as the DFR. The DFR value was used to assess the impact the participants freepour measure would have on differences in energy, macronutrient, salt and fibre intake. Data were assessed for normality using the D’Agostino–Pearson omnibus K2 test. All data violated the assumption of normal distribution; therefore, a non-parametric approach was adopted. All measured parameters in the study (freepour, DFR, energy, macronutrients, salt, fibre) were compared across cereal categories using the Friedman test followed by Dunn’s multiple comparison to test for significance.
Results
Participant characteristics
Participant characteristics are shown in Table 3. A total of 222 participants were screened, of which 169 were eligible and completed the study (Fig. 1). This was similar to previous research in this area(Reference Schwartz and Byrd-Bredbenner23).

* Data shown as mean ± sd for age, weight, height and BMI.
† Highest qualification achieved, occupation and ethnicity shown as number (n) and %.
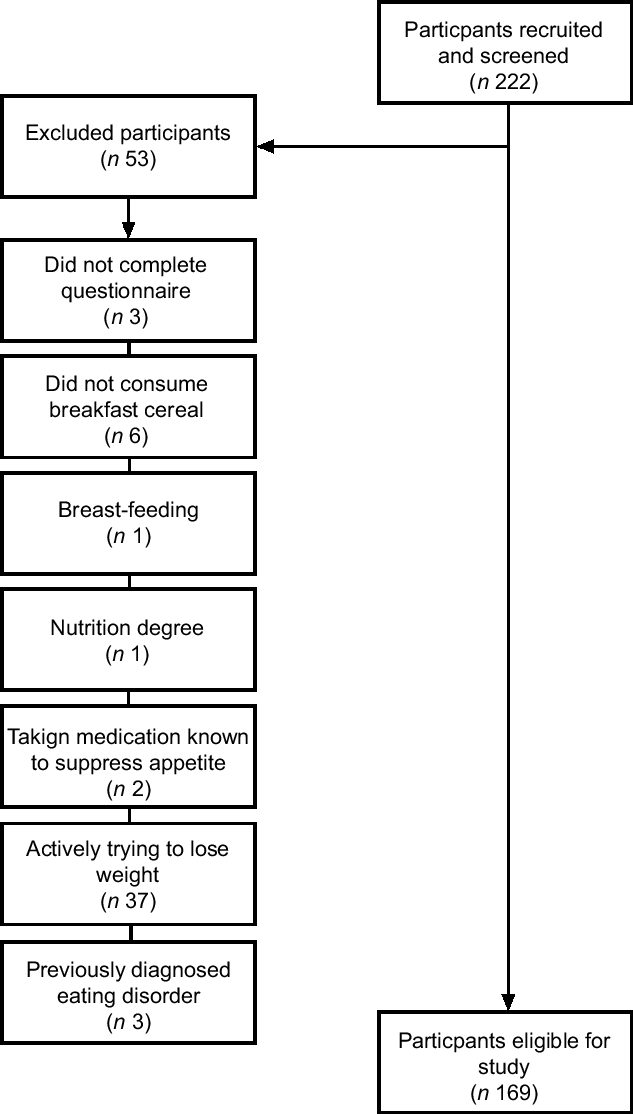
Fig. 1 Paricipant flow through study
Overall, 110 (65 %) participants were female. The mean age (sd) of participants was 32 (sd 18) years old. The mean BMI was 24·4 (sd 4·4) kg/m2. The majority of participants were of White European Ethnicity (89 %). Fifty-three participants were excluded (Fig. 1).
Portion sizes of the freepour serving
Data for freepour values are shown in Fig. 2(a). The striking finding of our analysis is the substantial variation in freepour measures based on BC type. All categories measured were above the median RSS value of 30 g. Median (and range of) freepour values for BC categories were 37·0 g (10·0–93·0), 48·0 g (9·0–102·0), 36·0 g (4·0–99·0), 36·0 g (4·0–86·0), 64·0 g (9·0–140·0), 41·0 g (5·0–108·0), 35·0 g (3·0–83·0), 95·0 g (21·0–312·0), 63·0 g (20·0–214·00) and 37·6 g (9·4–94·0) for F1, F2, GP, EGP, SW, OPC, OP, granola, oats and BF, respectively. Median values for SW, granola and oats were significantly greater than all other categories with granola having the highest median freepour value of 95 g (Fig. 2(a)).

Fig. 2 Freepour and difference between freepour and RSS. Freepour (a) and difference between freepour and RSS (b). Data shown as median ± range. n 169 for 10 BC. The dashed line in Fig. 1a represents median portion size of 30 g (based on our cereal sample). Categories with unlike letters were significantly different (P < 0·001). F1, flaked 1; F2, flaked 2; GP, gun puffed; EGP, extruded gun puffed; SW, shredded wholegrain; OPC, oven-puffed coloured; OP, oven puffed; BF, biscuit formation
Difference between the recommended serving size and freepour value for differing breakfast cereal categories
Due to differences in freepour values between cereal types, we calculated the difference (DFR) between the freepour weight and the RSS (Fig. 2(b)). A similar pattern in DFR weight was observed to that of the freepour measures. Median (and range of) values for DFR weight were 7·0 g (−20·0 to 63·0), 18·0 g (−21·0 to 72·0), 6·0 g (−26·0 to 69·0), 6·0 g (−26·0 to 56·0), 24·0 g (−31·0 to 100·0), 11·0 g (−25·0 to 83·0), 5·0 g (−27·0 to 53·0), 50·0 g (−24·0 to 267·0), 23·0 g (−20·0 to 174·0) and 0·0 g (−28·2 to 56·4) for F1, F2, GP, EGP, SW, OPC, OP, granola, oats and BF, respectively. The DFR for granola was significantly greater than all other categories (Fig. (2b)). This indicates that the granola cereal category was overserved to a greater extent when compared with all other categories. Median values for SW and oats were significantly higher than other cereal categories (Fig. 2(b)). Similar to Fig. 2(a), differences were observed between F1 and F2 categories. Collectively, these data indicate that all types of BC analysed (apart from BF) were overserved by our participants.
Consequences on energy and macronutrient intake
Due to the significant differences seen between different cereals in freepour and DFR measures, we sought to determine the impact this theoretically would have on the difference in energy and macronutrient content per serving. Figure 3 shows the difference in energy or specific macronutrients as a consequence of DFR. Positive values indicate higher amounts than what would be consumed if using the RSS.

Fig. 3 Differences in potential nutritional intake based on participants freepour. Data shown as median ± range. n 169 for 10 BC. Energy (a), total carbohydrate (b), sugar (c), fat (d), saturated fat (e), protein (f), fibre (g), and salt (h). F1, flaked 1; F2, flaked 2; GP, gun puffed; EGP, extruded gun puffed; SW, shredded Wholegrain; OPC, oven-puffed coloured; OP, oven puffed; BF, biscuit formation. Categories with unlike letters were significantly different (P < 0·001)
For total energy intake (Fig. 3(a)), the pattern between cereals was similar to that observed in Fig 2 with all cereal categories showing a positive median DFR in energy, apart from BF (Fig. 3(a)). Importantly, total energy content of the cereals is dependent on their nutrient content (shown in Table 2). Median (and range of) DFR values for energy were 110·9 kJ (−313·8 to 966·9), 282·4 kJ (−329·7 to 1129·7), 89·5 kJ (−388·3 to 1030·5), 95·8 kJ (−415·5 to 895·0), 365·7 kJ (−472·0 to 1326·8), 175·7 kJ (−399·6 to 1326·7), 81·2 kJ (−437·2 to 858·1), 1077·4 kJ (−517·1 to 5753·0), 349·4 kJ (−303·8 to 2642·6) and 0·0 (−427·2 to 854·4) for F1, F2, GP, EGP, SW, OPC, OP, granola, oats and BF, respectively. The difference in energy for granola was significantly greater than all other cereal categories in the study (Fig. 3(a)). As the majority of cereals’ types were overserved, this led to higher than recommended servings of energy.
Different patterns were observed when considering the DFR in total carbohydrate (Fig. 3(b)). Median (and range of) DFR values for total carbohydrate were 5·9 g (−16·8 to 52·9), 15·7 g (−18·3 to 62·8), 4·4 g (−19·2 to 51·1), 4·3 g (−18·5 to 39·8), 16·8 g (−21·7 to 70·0), 9·2 g (−21·0 to 69·7), 4·3 g (−23·2 to 45·6), 22·5 g (−10·8 to 120·2), 13·9 g (−12·1 to 105·3) and 0·0 g (−19·5 to 38·9) for F1, F2, GP, EGP, SW, OPC, OP, granola, oats and BF, respectively. There was no significant difference between F1, GP, EGP, OPC, OP and BF categories. F2, SW and oats were significantly different to other categories. Granola had the highest median difference in total carbohydrate (22·5 (−10·8 to 120·2)) and was significantly greater than all other cereal categories (Fig. (3b)).
Cereals have been identified by Public Health England as a food group to reduce the sugar content of(10). Considering the sugar content of the DFR is important, especially if wanting to achieve the 5 % target for free sugar intake. Median (and range of) DFR values for sugar were 0·6 g (−1·6 to 5·0), 6·7 g (−7·8 to 26·4), 1·3 g (−5·7 to 15·2), 1·1 g (−4·7 to 10·1), 3·1 g (−4·0 to 13·0), 1·9 g (−4·3 to 14·1), 0·4 g (−2·1 to 4·2), 7·2 g (−3·4 to 38·2), 0·3 g (−0·2 to 1·9) and 0·0 g (−1·2 to 2·4) for F1, F2, GP, EGP, SW, OPC, OP, granola, oats and BF, respectively. Median DFR values for sugar in F2 and granola were significantly greater than other categories of cereal (Fig. 3(c)). F2 and OPC values for sugar were significantly higher than their counterparts F1 and OP, respectively.
Median DFR values for fat were broadly consistent across all cereal categories, apart from granola (Fig. 3(d)). Total fat DFR did not differ significantly between F1, F2, OP and BF groups (Fig. 3(d)). Median (and range of) values were 0·1 g (−0·2 to 0·6), 0·1 g (−0·1 to 0·4), 0·1 g (−0·5 to 1·2), 0·3 g (−1·2 to 2·6), 0·4 g (0·6 to 1·8), 0·2 g (−0·5 to 1·6), 0·1 g (−0·3 to 0·6), 15·2 g (−7·2 to 80·9), 1·6 g (−1·4 to 12·18) and 0·0 g (−0·6 to 1·1) for F1, F2, GP, EGP, SW, OPC, OP, granola, oats and BF, respectively. Granola showed the largest range of values for DFR for total fat, with the median value being significantly higher than all other categories (Fig. 3(d)).
Saturated fat DFR did not differ significantly between F1, F2, GP, OP and BF groups (Fig. 3(e)). Median (and range of) DFR values for saturated fat were 0·0 g (0·0 to 0·1), 0·0 g (0·0 to 0·1), 0·0 g (−0·1 to 0·2), 0·1 g (−0·2 to 0·5), 0·1 g (−0·1 to 0·3), 0·1 g (−0·2 to 0·8), 0·0 g (−0·1 to 0·2), 0·2 g (−0·1 to 0·8), 0·2 g (−0·2 to 1·7) and 0·0 g (−1·2 to 0·3) for F1, F2, GP, EGP, SW, OPC, OP, granola, oats and BF, respectively. Oats and granola had the highest median DFR values for saturated fat, and while there was no significant difference between these groups, both were significantly higher than the other cereal categories (Fig. 3(e)).
Similar to other categories, granola had the highest DFR for protein with a median (and range of values) of 6·2 g (−0·2 to 17·92) (Fig. 3(f)). Values for other categories were 0·5 g (−1·4 to 4·4), 0·8 g (−1·0 to 3·2), 0·4 g (−1·9 to 4·9), 0·6 g (−2·4 to 5·3), 2·6 g (−3·4 to 11·0), 0·7 g (−1·6 to 5·3), 0·4 g (−1·9 to 3·7), 2·4 g (−2·1 to 17·9) and 0·0 g (−3·4 to 6·8) for F1, F2, GP, EGP, SW, OPC, OP, oats and BF, respectively. SW and oats displayed similar values and both differed significantly to other cereal groups (Fig. 3(f)).
National Diet and Nutrition Survey highlights cereals as being an important source of fibre for all age groups(9) and hence consuming more than the RSS may have some advantages, especially if this leads to increased consumption of nutrients such as fibre. There was no significant difference in the DFR for fibre between F1, F2, GP, EGP and OP (Fig. 3(g)). Median (and range of) values were 0·2 g (−0·6 to 1·9), 0·4 g (−0·4 to 1·4), 0·5 g (−2·2 to 5·8), 0·5 g (−2·3 to 5·0), 3·1 g (−4·0 to 13·0), 0·3 g (−0·8 to 2·5), 0·1 g (−0·5 to 1·1), 3·5 g (−1·7 to 14·4) and 0·0 g (−0·3 to 0·84) for F1, F2, GP, EGP, SW, OPC, OP, granola, oats, and BF, respectively. Median values for SW and oats did not differ significantly. The DFR for fibre was significantly higher in the granola group compared with all other categories (Fig. 3(g)).
Salt content of cereals is an important but often overlooked aspect of their nutritional profile. Indeed in 2019 Action on Salt revealed that out of seventy-seven cereals analysed, one had salt content > 1·5 g/100 g, and sixty-five contained a salt content between 0·3 and 1·5 g/100 g(29). An increased portion size (v. the RSS) would lead to greater consumption of salt. In our analysis, median (and range of) values for salt DFR were 0·1 g (−0·2 to 0·7), 0·2 g (−0·2 to 0·6), 0·0 g (0·0 to 0·0), 0·1 g (−0·2 to 0·5), 0·2 g (−0·2 to 0·7), 0·1 g (−0·2 to 0·5), 0·1 g (−0·3 to 0·5), 0·0 g (0·0 to 0·0), 0·0 g (0·0 to 0·0) and 0·0 g (0·0 to 0·0) for F1, F2, GP, EGP, SW, OPC, OP, granola, oats and BF, respectively. Categories F1, EGP, OPC, OP and granola did not differ significantly from each other (Fig. 3(h)). In comparison with other nutrients, granola and oats had the lowest DFR for salt. SW and F2 had the highest DFR values for salt. Collectively, our data show that regular consumers of cereal overserve, with more dense cereals such as SW, granola and oats being the most difficult to portion accurately. As a result of increased portion sizes, the impact on energy and nutrition content is also substantial and varies depending on the type of BC consumed.
Discussion
The present study aimed to establish if different types of BC were associated with differing portion sizes. Our study has demonstrated that our study population overserved the majority of BC types tested, with denser BC being overserved to a greater degree than less dense varieties.
Previous studies had shown that individuals had a tendency to pour larger portions than the RSS(20,Reference Schwartz and Byrd-Bredbenner23) . However, limitations to these studies were that they had only compared portions of flaked BC and therefore the findings could not be applied to other types of BC. SACN(30) published that there was a tendency for high-fibre BC to be overconsumed; however, only two categories were compared. In our analysis, the majority of BC appeared to be overserved regardless of the type of BC. The exception to this was the pre-portioned BF category, indicating that they were easier to portion. However, the degree of over-portioning tended to be associated with the physical characteristics of the BC, consistent with previous literature showing the influence of physical properties of food on portion size(Reference Osterholt, Roe and Rolls27,Reference Rolls, Meengs and Roe28) . To improve portion size awareness, the size of a portion should become more prominent on packaging and there should be standardisation across types of BC. Alternatively, CEEREAL should consider updating the suggested RSS to reflect a realistic portion size, which would subsequently change the traffic light nutritional information often found on the front of the pack. Unrealistic portion sizes may mislead the consumer to perceive a product as nutritious, leading to larger portion sizes(Reference Labbe, Rytz and Godinot31) and although Public Health England (10) included BC in their sugar reduction programme, government policy should place more pressure on manufacturers of high-energy dense BC, such as granola, to reformulate products to improve their nutritional value.
Differing densities of BC may explain some of the findings in our study. CEEREAL(22) considers product densities when proposing the RSS. Figure 3 showed that the smallest median DFR in weight after BF originated from BC including OP, OPC, GP and EGP, as well as F1, all of which were the less dense types of BC. It appeared that the participants’ tendency to overserve had less of an impact on serving weight with these types of cereal. In contrast, denser cereals such as granola, SW and oats had a significantly larger DFR indicating a greater degree of overserving and larger portion sizes. Incorporation of air into products and hence a reduction in density produces a decrease in energy consumed(Reference Osterholt, Roe and Rolls27). Two other studies also demonstrated how differing volumes of isoenergetic preloads influenced satiety in men as a result of overestimating energy content(Reference Rolls, Bell and Waugh32,Reference Rolls, Castellanos and Halford33) . These studies showed that there was a dissociation between volume, weight and energy content, therefore altering the individual’s perception of portion size. The BC with a RSS of 30 g and a greater volume of air (GP, EGP, OPC and OP) had a significantly smaller median DFR suggesting a smaller difference between the manufacturers RSS and what the participants served themselves. Collectively, this may suggest that reducing the density of cereal may be an effective way to decrease energy intake.
Portion size is an important determinant of energy intake and given that all but one types of BC tested lead to a degree of overserving, we examined the impact this had on energy and macronutrient intake. Previous literature has demonstrated that when portion size increases, energy intake increases significantly and is sustained over subsequent days, that is, no compensation(Reference Rolls, Roe and Meengs34). In our analysis, granola had the largest freepour measure and was also the most energy dense. Consequently, this led to a large DFR of energy, supporting previous research showing that high-energy dense foods have the largest effect on energy intake(Reference Rolls, Roe and Meengs34). SW and oats are less energy dense and had a significantly smaller DFR for energy than granola. The significance of these observations can be seen when comparing our findings to the government recommendations from the One You campaign, specifically the advice that breakfast should provide approximately 400 kcal(35). Our analysis suggests that individuals regularly consuming the median portion size for granola would be consuming approximately 490 kcal at breakfast per day, exceeding these recommendations. This does not include other food items consumed at breakfast, such as milk on the cereal, which would increase the energy intake further and contribute to weight gain if this was not compensated for at other mealtimes. Therefore, government policy should encourage companies manufacturing high-energy dense BC to reformulate products to reduce energy density, as a result of lack of portion size awareness. Research has shown that energy density is not strongly associated with food choice; therefore, reformulation may not influence market sales, but increase health benefits(Reference Brunstrom, Drake and Forde36).
In our study, the types of cereal F1, OP and BF were low in fat, saturated fat and total sugar, but contained modest amounts of protein and fibre. However, this same cannot be said about categories such as F2, GP, EGP and OPC, especially considering sugar. As a single meal, breakfast contributes more to the daily intake of carbohydrate, total sugars and less to total daily intake of protein, total fat, saturated fat and fibre(Reference Gaal, Kerr and Ward37). Breakfast remains an important source of micronutrients, especially in young children and less so in adolescents(Reference Coulthard, Palla and Pot38). However, our finding that freepour measures were larger than the RSS is significant, and the importance of breakfast combined with the potential for a significant source of sugar suggests that BC reformulation should be taken seriously. For context, the median serving for granola in our study would see an individual consumes almost 14 g of sugar, with a similar observation seen in the F2 group (approximately 18 g/serving). If the median portion size of granola was routinely consumed, it would likely have negative implications on nutritional health as it may contribute to excess energy and sugar intake(Reference Livingstone and McNaughton39). There needs to be substantial drive to reformulate breakfast products to improve their nutritional composition and contribution to overall nutrient intake.
Similar to sugar, salt content of cereal is also a cause for concern and has been recently reported as such(29). Salt intake remains an important public health nutrition target, and as a nutrient has strong links to cardiovascular health, specifically blood pressure(Reference Huang, Trieu and Yoshimura40). Indeed, the gradual reduction of salt intake in the UK diet is speculated to be one of the contributing factors to lower stroke and CHD mortality(Reference He, Pombo-Rodrigues and MacGregor41), with salt content of BC decreasing as part of the governments incremental targets(Reference Pombo-Rodrigues, Hashem and He42). The salt reduction targets published in 2020(43) continue to include BC as a category, with new targets that are lower than the previous recommendations published in 2017. Thus, it is essential that cereal products be reformulated to meet these new goals. In our study, the cereals used had a wide range of salt contents, ranging from <0·01 to 1·12 g/100 g. For children, reducing salt intake can be a challenge, especially as previous studies have suggested that while a low-salt BC can be consumed for up to 8 weeks, there is still no significant change in salt preference(Reference Bobowski and Mennella44). In contrast, low-salt interventions in adults of 5 and 12 months duration do lead to changes in salt preference when trialled using various foodstuffs(Reference Blais, Pangborn and Borhani45,Reference Bertino, Beauchamp and Engelman46) . For salt reductions to be effective in children, it would seem that improving educational awareness of the consequences of excessive salt is more effective than simply reducing the salt content of a product(Reference He, Wu and Feng47), and a combination of the two would have the greatest impact on health. Combined with result from Action on Salt(29), our finding that all cereal categories were overserved suggests there is considerable potential for consumers to be unknowingly consuming more salt at breakfast than they are perhaps aware of.
Despite the negative consequences of overserving highlighted above, there is genuine potential for the overserving finding in our study to be exploited for public health benefit. Overserving BC may contribute positively to an individual’s health by increasing the consumption of carbohydrates, fibre and protein, in addition to vitamins and minerals that the cereal product was fortified with. For example, the larger portions seen in SW, granola and oat categories – while leading to higher amounts of energy and sugar in the present study – could be used to increase intake of fibre, protein and micronutrients if such products were reformulated correctly. Considering fibre as an example, current UK intakes are woefully inadequate with the majority of every age group not meeting the revised target of 30 g/d(9). Indeed, recent analyses have shown the importance of higher cereal fibre intake on markers of cardiovascular health such as lower waist-hip ratio(Reference Barrett, Amoutzopoulos and Batterham48), in addition to being inversely associated with the prevalence of diverticular disease(Reference Aune, Sen and Norat49) and inflammation(Reference Sang, Idehen and Zhao50). Thus, there is scope to utilise the overserving effect seen in our study to improve the population’s intake of nutrients such as fibre; however, this requires input from manufacturers to reformulate products accordingly, reducing energy density of BC and simultaneously lowering salt and sugar.
There are important limitations to our study that warrant discussion. Our study population was well-educated with 30 % of participants having achieved an undergraduate degree or equivalent. A previous study has demonstrated that educational level influences nutritional knowledge(Reference Hendrie, Coveney and Cox51), with additional work suggesting increased nutritional knowledge positively influences dietary intake, usually of fruits and vegetables(Reference Spronk, Kullen and Burdon52), and is associated with a higher frequency of breakfast consumption(Reference Matsumoto, Ishige and Sakamoto53). Thus, further studies should be performed in more diverse socio-economic groups. Moreover, 68 % of participants were classified as students. Studies have acknowledged that some students have a less healthful lifestyle than the general population(Reference Sprake, Russell and Cecil54). The time of day that participants completed the study was not controlled, due to the project’s time constraints. This meant that the researchers could not control the satiety and hunger of the participants, which may have influenced portion size. Future studies are required to determine how the portion size awareness of BC differs in a fasted state, which is likely when individuals would serve BC. It is also important to note that while our participants were familiar with all cereals used in the study, they were not required to habitually consume each type of cereal. Stipulating this as a requirement for the study would have negatively impacted on recruitment and also introduced more variation by removing the repeated measures aspect of the study design. Lastly, it must be recognised that the cereals analysed in our study do not fully represent the variety seen within each type of BC category.
In conclusion, the present study contributes to existing literature that consumers have a tendency to overconsume BC. However, we show that this is not uniform across different cereal types and the degree of overserving varies with the type of BC used. Granola, the most energy dense BC, was associated with the least portion size awareness and hence greatest degree of overserving. This lack of portion size awareness may impact on nutritional health if routinely overserved, due to the high energy, fat and sugar content. The present study supports previous work showing that denser foods are associated with reduced portion size awareness as a result of the dissociation between volume, weight and energy content. Government policy should encourage manufacturers to update the RSS and standardise portion size across cereals, as well as acknowledge differences for adults and children. Product reformulation should be encouraged to positively exploit the overserving seen in our study.
Acknowledgements
Acknowledgements: The authors thank all study participants for supporting the research and engaging with the study. Financial support: This research received no specific grant from any funding agency, commercial or not-for-profit sectors. Conflict of interest: There are no conflicts of interest. Authorship: T.B., I.M.L. and L.B. formulated the research question and study design. I.M.L. and L.B. collected data. I.M.L., L.B. and T.B. analysed data and prepared the manuscript. All authors agree with the final manuscript submitted. Ethics of human subject participation: The current study was conducted according to the guidelines laid down in the Declaration of Helsinki and all procedures involving research study participants were approved by the University of Chester Department of Clinical Sciences and Nutrition research ethics panel. Written informed consent was obtained from all subjects/patients
Supplementary material
For supplementary material accompanying this paper visit https://doi.org/10.1017/S1368980021000744


