


Accurate dietary assessment is essential to understand the relationship between diet and various health outcomes and to evaluate the effectiveness of public health policies and interventions(Reference Hooson (Jzh), Hutchinson (Jyh) and Warthon-Medina1). Widely used dietary assessment methods, such as dietary records, 24-h dietary recalls and FFQ, estimate nutrient intakes based on the self-reported information on foods and beverages consumed(Reference Rutishauser2). Hence, respondents are required to report the name, amount or frequency of food items, including single food ingredients in mixed dishes. However, as many foods are usually consumed after preparation or cooking(Reference Bognár and Piekarski3,Reference Date, Yamaguchi and Tanaka4) , people are not always able to remember all specific ingredients consumed, for instance, condiments in sandwiches(Reference Hedrick, Dietrich and Estabrooks5). In particular, people who are not involved in cooking seem to have difficulty in accurately reporting information on single food ingredients in cooked dishes(Reference Date, Yamaguchi and Tanaka4,Reference Cade, Thompson and Burley6) . Consequently, these food-based dietary assessment methods may cause respondent fatigue and low quality of reported information(Reference Date, Yamaguchi and Tanaka4,Reference Cade, Thompson and Burley6,Reference Lin, Bromage and Mostofa7) . Moreover, given that dining out has become increasingly popular in many countries(Reference Smith, Ng and Popkin8–Reference Jabs and Devine10), reporting single food ingredients would be more difficult in the future.
Recently, a new dietary assessment method, which assesses intakes of mixed dishes rather than raw single foods, has been developed in several countries(Reference Lin, Bromage and Mostofa7,Reference Yum and Lee11–Reference Matsuzaki, Michie and Kawabata14) . For example, a dish-based FFQ developed in South Korea comprises 112 dish items such as fried vegetable with potato noodles, in which participants answer consumption frequency and portion size of each dish(Reference Park, Kim and Kim12). Also, a web version of dish-based dietary record, which employs an input method based on dish items, has been recently developed in Japan(Reference Matsuzaki, Michie and Kawabata14). These dish-based dietary assessment methods do not ask detailed information on single foods, and hence, they have potential advantages of low participant burden(Reference Lin, Bromage and Mostofa7,Reference Keshteli, Ahmad and Somayeh13,Reference Lee, Lee and Ladenla15) , ease of data analysis or administration(Reference Lin, Bromage and Mostofa7,Reference Matsuzaki, Michie and Kawabata14,Reference Lee, Lee and Ladenla15) and more accurate estimation of intakes of specific foods and nutrients(Reference Yum and Lee11,Reference Keshteli, Ahmad and Somayeh13,Reference Kim, Kim and Lee16) . Because mixed dishes represent the combination and amount of foods and cooking method, examination of nutrient sources based on dishes rather than food ingredients may be useful in characterising dietary patterns of populations(Reference Ogawa, Tsubono and Nishino17).
Given the diversity of dietary habits, dish-based dietary assessment tools vary. As food culture varies among countries and areas, each of the dish-based dietary assessment tools may have many differences in target population, survey items and its design. The comparison and description of dish-based dietary assessment tools may be useful for improving their quality and for developing new survey tools in the future. In addition, given that existing food-based dietary assessment tools such as FFQ already have dish items(Reference Block, Hartman and Dresser18,Reference Shahar, Shai and Vardi19) , clarifying the advantages and disadvantages of using dish-based dietary assessment tools may help understand the nature of dish-based approach. However, to our knowledge, no study has systematically investigated and summarised the dish-based dietary assessment tools.
We conducted a scoping review(Reference Munn, Peters and Stern20–Reference Arksey and O’Malley22) to summarise the existing evidence on dish-based dietary assessment tools. We described the characteristics, development process, methods and results of validation and the status of utilisation of these tools.
Methods
This scoping review was conducted in accordance with the Preferred Reporting Items for Systematic Reviews and Meta-Analyses statement for reporting systematic reviews(Reference Moher, Liberati and Tetzlaff23) and was registered in the International Prospective Register of Systematic Reviews (CRD42019120609).
Search strategy
The definition of dish-based dietary assessment tools has not been well established. In this review, we defined a dish-based dietary assessment tool as a tool that was named as ‘dish-based’ or ‘recipe-based’ during its development or validation or if the tool was developed for the purpose of evaluating dietary intake based on mixed dishes, rather than single food ingredients. Among those tools, tools that can assess daily energy or nutrient intake from the whole diet using self-reported information were explored for this review.
The search was conducted on 8 October 2018, using the PubMed and Web of Science Core Collection databases. The search string was as follows: (dish OR dishes OR recipe OR recipes OR ‘composite food’ OR ‘composite foods’ OR ‘prepared food’ OR ‘prepared foods’ OR cuisine OR cuisines) AND (questionnaire OR 24-HR OR ‘24 h recall’ OR history OR record OR records OR diary OR diaries OR tool OR tools OR instrument OR instruments OR FFQ OR measurement OR assessment OR evaluation) AND (diet OR dietary OR nutrition OR nutritional OR nutrient OR nutrients OR food OR foods OR energy OR intake OR intakes OR consumption OR consumptions). The search was limited to English language papers, but the year of publication was not limited.
Study selection
To be included in this review, articles were required to meet the following criteria: (i) full-text articles published in English in peer-reviewed journals, (ii) studies on humans in free-living settings and (iii) studies that developed or validated dish-based dietary assessment tools and studies that estimated dietary intake by using the tool or its modified version. The following articles were excluded from this review: (i) review articles, proceedings, letters to editor or abstracts, (ii) technical reports regarding recipe calculation or image analysis of dishes, (iii) developed or used tools that assessed intakes of specific foods or nutrients only (e.g., Na) or intake from a specific meal occasion only (e.g., restaurant meals), (iv) developed or used dish-based tools that assess dietary intake not based on self-reported information, (v) tools that did not use dish-based dietary assessment tools but used other tools (viz., tools not labelled as ‘dish-based’ or ‘recipe-based’ when developed or validated or tools with the absence of the following statement: that they were developed for the purpose of evaluating dietary intake based on mixed dishes instead of single food ingredients) or (vi) studies that did not elucidate which tool was used for dietary assessment. Restriction was not made based on the participants’ characteristics.
Duplicate articles were identified and removed using key terms such as first author, publication year, journal title, volume and number of the first page and article title. The title and abstract of the relevant articles were screened by one reviewer (N.S.), and the full texts of the screened articles were retrieved. The references of the articles identified were also assessed (by N.S.) to further identify potentially relevant articles. Full-text articles were then evaluated independently by two reviewers (N.S. and X.Y.). Any disagreements were discussed and resolved by consensus or by another reviewer if necessary (K.M.). The searches were rerun just before the final analyses and further studies retrieved for inclusion (date: 25 March 2019).
After this process, we further conducted a citation search(Reference Higgins and Green24) to identify additional relevant papers. First, we identified papers that have cited each of the eligible articles on validation or development study of dish-based dietary assessment tools using citation tracking features in PubMed and Web of Science. We then removed citation overlapping between the two databases and those already screened during the original search. The remaining records were then considered for inclusion in this review through the same procedure as described above.
Data extraction
For this review, the following information was extracted: first author’s surname, publication year, study design, study purpose, survey name, tool description (target population, dietary variables assessed, tool type, administration mode, reference period, method to estimate portion size, consumption frequency categories for FFQ, the number and content of food and dish items and time to complete), sample size, participants’ characteristics (sex, age and health status), development process of a tool (development purpose, primary dietary data referred, methods to develop a dish list and dish composition database), details on validity testing and the advantages and disadvantages of dish-based dietary assessment methods. One review author (N.S.) extracted the data, which were checked by another author (X.Y.).
Assessment of study quality and synthesis of results
The quality of validation studies was assessed based on a scoring system developed by EURopean micronutrient RECommendations Aligned Network of Excellence(Reference Serra-Majem, Frost Andersen and Henríque-Sánchez25). This system enables the classification of validation studies according to methodological quality. The following five items were considered: (i) homogeneity of sample and sample size, with a maximum of 1 point (0·5 points when the sample was not homogeneous for certain characteristics such as sex and socio-economic status and 0·5 points when the sample size was composed of more than fifty individuals for biomarker studies or >100 for the other studies), (ii) statistics to assess validity, with a maximum of 3 points (e.g., 1 for comparison between means or medians; 0·5, 1 and 1·5 according to the correlation used, crude, adjusted and deattenuated or interclass, respectively; plus 0·5 for the assessment of agreement or misclassification), (iii) data collection methods (1 point if the data were gathered by personal interview), (iv) consideration of seasonality (0·5 points if considered in the validation design) and (v) inclusion of dietary supplements (1·5 points if considered in the validation study). However, we omitted the fifth evaluation item for dietary supplements in this review because supplements were possibly not considered as a dish and might not be included as a survey item in dish-based dietary assessment tools. Hence, a total score of each validation study could range from 0 (poorest quality) to a maximum of 5·5 (highest quality). We classified each validation study based on the summary score as follows: ‘very good/excellent’ with a score of ≥3·5, ‘good’ with a score of ≥2 to <3·5, ‘acceptable/reasonable’ with a score of ≥1 to <2 and ‘poor’ with a score of <1. One reviewer (N.S.) scored the studies, which were checked by another author (X.Y.).
We tabulated the findings from the individual studies in terms of tool characteristics, development process, the validity of tools, the current status of utilisation of tools for epidemiological studies and the advantages and disadvantages of dish-based dietary assessment methods. For FFQ, a median of the number of survey items of all tools was calculated. For validation studies, the median correlation coefficients between a tool and a reference were presented for food groups and nutrients. If the values were not shown in original articles, they were calculated based on individual values shown in original tables. All the calculations were conducted using Microsoft Office Excel 365. One author (N.S.) tabulated the data, and subsequently, another author (X.Y.) checked the result. Any disagreements were discussed and resolved by consensus or by another reviewer if necessary (K.M.).
Results
The initial database search identified 5313 records, of which 4062 remained once duplicates were removed (Fig. 1). After screening the titles and abstracts, 188 articles were retained for full-text assessment. We excluded 154 articles mainly because they were not a study of dish-based dietary assessment tools, and then four articles were added from the references of articles, yielding thirty-eight eligible articles. These articles were cited by 134 unique records, from which 101 articles that were already reviewed or were ineligible were excluded. For the remaining thirty-three articles, additional citation and reference search were conducted, yielding three more eligible records. Consequently, a total of seventy-four eligible articles were included in this study.

Fig. 1 The flow diagram of the literature search process for studies on the development, validation and application of dish-based dietary assessment tools
Characteristics of dish-based dietary assessment tools
Twelve dish-based dietary assessment tools were identified (Tool Nos. 1–12, Table 1). All the tools were developed for Asian-origin populations such as Koreans (n 4), Bangladeshis (n 2), Iranians (n 1), Indians/Malays/Chinese (n 1), Japanese (n 3) and Chinese Americans (n 1). The target age groups were adults (n 4), adolescents (n 1), children (n 1) or not specified (n 6). All tools were designed to assess the energy intake, of which eleven and five tools were also designed to assess nutrient intakes and food or food group intakes, respectively. Eleven tools were developed based on questionnaires such as FFQ and a diet history questionnaire, while one tool used a dietary record. The questionnaires (Tool Nos. 1–10 and 12) were all paper-based, and most of them could be interviewer administered. Reference period was 12 months or past year (n 6), past 1 month (n 2) or not specified (n 3). Eight questionnaires were semi-quantitative with 3–11 categories of portion size choices, five of which provided visual aids to assist portion size estimation. Most questionnaires had options for frequency response, ranging from five to eleven levels (Tool Nos. 1–7 and 10). The number of food or dish items used in the questionnaires ranged from 15 to 163 (median 84). Time to complete was reported in four questionnaires with a minimum of 5 min to a maximum of 60 min. The dietary record (Tool Nos. 11) was completed via the Internet website and was self-administered. Respondents selected their meal from an online database containing approximately 100 000 dishes.
Table 1 Summary and key features of twelve dish-based dietary assessment tools identified across the seventy-four publications

PB, paper based; WB, web based; PS, portion size; NR, not reported; IA, interviewer administered; KHANES, Korea National Health and Nutrition Examination Survey; SA, self-administered; SEPAHAN, Study on the Epidemiology of Psychological, Alimentary Health and Nutrition; NA, not applicable; DR, dietary record; DHQ, diet history questionnaire.
* Target age or sex of the tool was not specified if not indicated otherwise.
† Foods and nutrients used in each development and validation study.
‡ The number of dishes included in an online database from which respondents select their meal.
The details of dietary variables and dish items adopted in each tool are shown in the online supplementary material, Supplemental Table 1. There were a wide variety of dishes, including several traditional dishes in each country, for example, kimchi stew in Korea (Tool Nos. 1, 2 and 4), curry in Bangladesh (Tool Nos. 5 and 6) and sushi in Japan (Tool Nos. 9 and 10).
Development process of dish-based dietary assessment tools
Table 2 summarises the development process of the nine tools (Tool Nos. 1, 2, 4, 5, 7–10 and 12)(Reference Date, Yamaguchi and Tanaka4,Reference Yum and Lee11–Reference Keshteli, Ahmad and Somayeh13,Reference Lee, Lee and Ladenla15,Reference Kim, Kim and Lee16,Reference Sudo, Sekiyama and Watanabe26–Reference Neelakantan, Whitton and Seah28) . Seven tools were developed based on dietary intake estimated by 24-h dietary recalls or dietary records in the target population (Tool Nos. 1, 2, 4, 5, 8–10). These data contained a single- or multiple-day dietary intake obtained from twenty-five to 6817 respondents, with information on 977–55 000 food or dish items. Meanwhile, other tools were developed on the basis of informal interviews with small groups of people about their dietary intake of the preceding day or the information on commonly consumed foods and dishes provided by local dietitians, a prior questionnaire or observation of food available in supermarkets (Tool Nos. 7 and 12).
Table 2 Development process of nine dish-based dietary assessment tools
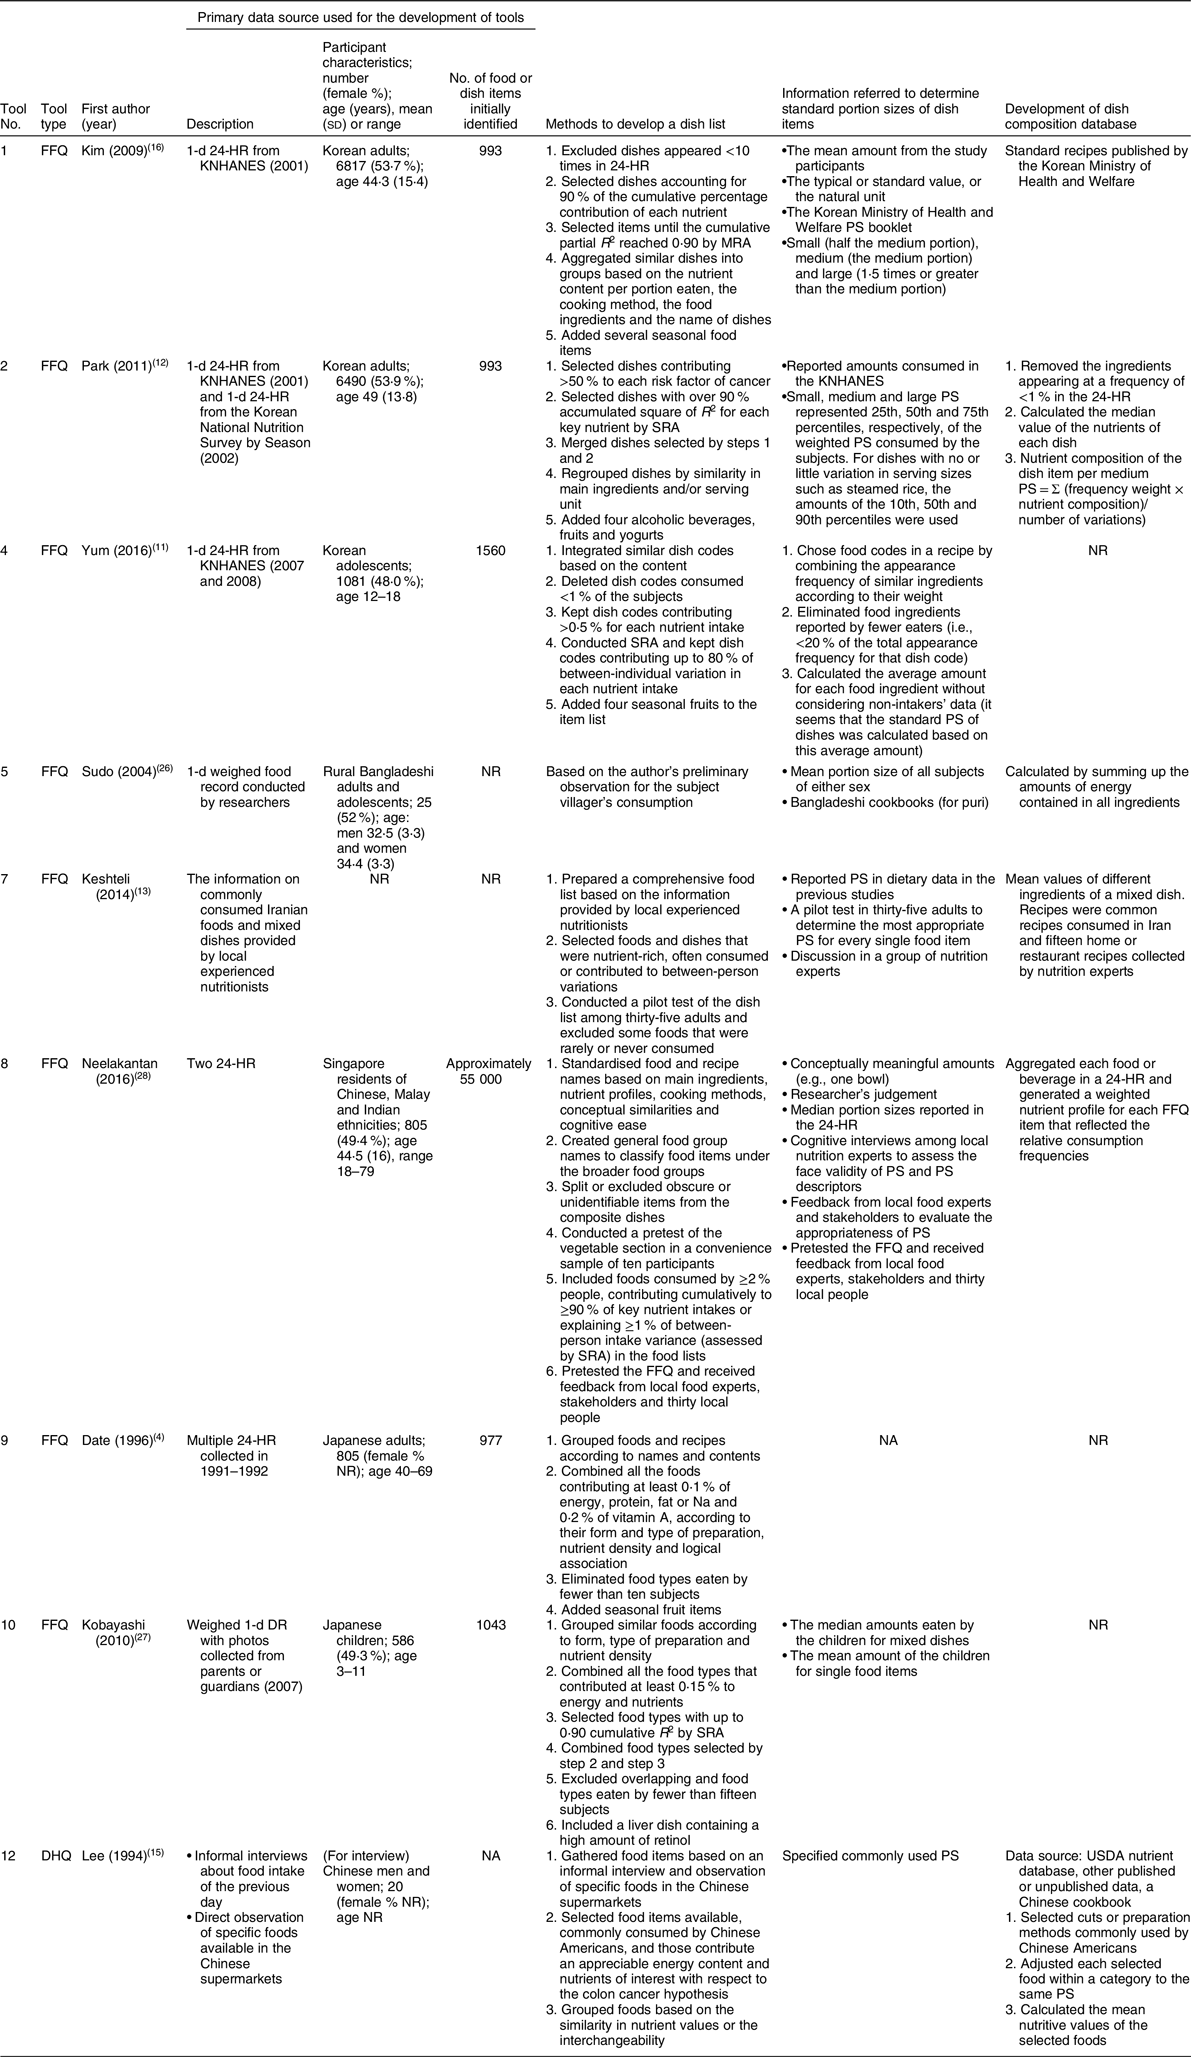
24-HR, 24-h dietary recall; KHANES, Korea National Health and Nutrition Examination Survey; MRA, multiple regression analysis; PS, portion size; SRA, stepwise regression analysis; NR, not reported; NA, not applicable; USDA, United States Department of Agriculture; DHQ, diet history questionnaire.
Dish list
In most tools, a dish list for an FFQ or diet history questionnaire was developed based on the results of the statistical analysis of dietary data. Although detailed process to select dish items and the order of procedures varied among tools, they can be classified as follows: (i) dishes were aggregated or categorised based on the nutrient content (Tool Nos. 1, 8, 9, 10 and 12), food ingredients (Tool Nos. 1, 2 and 8), preparation methods (Tool Nos. 1, 8, 9 and 10), dish names (Tool Nos. 1 and 9), serving units (Tool No. 2), conceptual similarities (Tool No. 8), cognitive ease (Tool No. 8), logical association (Tool No. 9), food form (Tool No. 10) or interchangeability (Tool No. 12); (ii) dishes eaten infrequently or eaten by a small number of subjects or those that were obscure or unidentifiable were excluded (Tool Nos. 1, 4, 8–10); (iii) dishes were selected based on their percentage contribution to the total intake of key nutrients (Tool Nos. 1, 2, 4, 8–10); (iv) dishes contributing to between-person variations were selected based on cumulative R 2 using multiple regression analysis (Tool Nos. 1, 2, 4, 8 and 10) and (v) some food or dish items, such as fruits including seasonal ones (Tool Nos. 1, 2, 4 and 9), alcohol and yoghurt (Tool No. 2) and liver dishes (Tool No. 10), were added manually.
Standard portion size and dish composition databases
Most of the tools determined the standard portion size of dishes using median or mean amounts of dishes reported by the participants (Tool Nos. 1, 2, 4, 5, 8 and 10). Other information referred was official portion size booklet (Tool No. 1), cookbooks (Tool No. 5) or expert opinions (Tool Nos. 7 and 8). Natural unit or eating frequency was also considered (Tool Nos. 1, 4 and 8).
The development process of the dish composition database was reported in six tools. They used self-reported intake (Tool Nos. 2, 5 and 8) or other recipes or nutrient databases (Tool Nos. 1, 7 and 12). Nutrient values of each dish were calculated as the mean or the weighted mean of nutrients of each dish.
Validity of dish-based dietary assessment tools
Table 3 shows the thirteen validation studies on nine tools (Study Nos. 2–4, 6, 8A, 8B, 9A–C, 10A, 10B, 11 and 12)(Reference Date, Yamaguchi and Tanaka4,Reference Lin, Bromage and Mostofa7,Reference Yum and Lee11,Reference Matsuzaki, Michie and Kawabata14,Reference Lee, Lee and Ladenla15,Reference Park, Noh and Song29–Reference Kobayashi, Kamimura and Imai32) . All the studies were conducted in people with the same ethnicity as the target population of each tool. The sample size ranged from 41 to 288. Five studies included men and women nearly equally (Study Nos. 2–4, 6, 8A and 8B), while three studies were conducted in groups consisting of mostly women (Study Nos. 9A, 11 and 12). Twelve studies assessed tool validity using self-reported dietary information as a reference, such as single- or multiple-day dietary record(s) (Study Nos. 2–4, 6, 9A–C, 10A, 10B and 11), 2-d 24-h dietary recall (Study No. 8A) and a typical day’s diet recall (Study No. 12). One study used concentration biomarkers such as urinary isoflavones and plasma carotenoids as a reference (Study No. 8B).
Table 3 Characteristics of the thirteen validation studies for nine dish-based dietary assessment tools
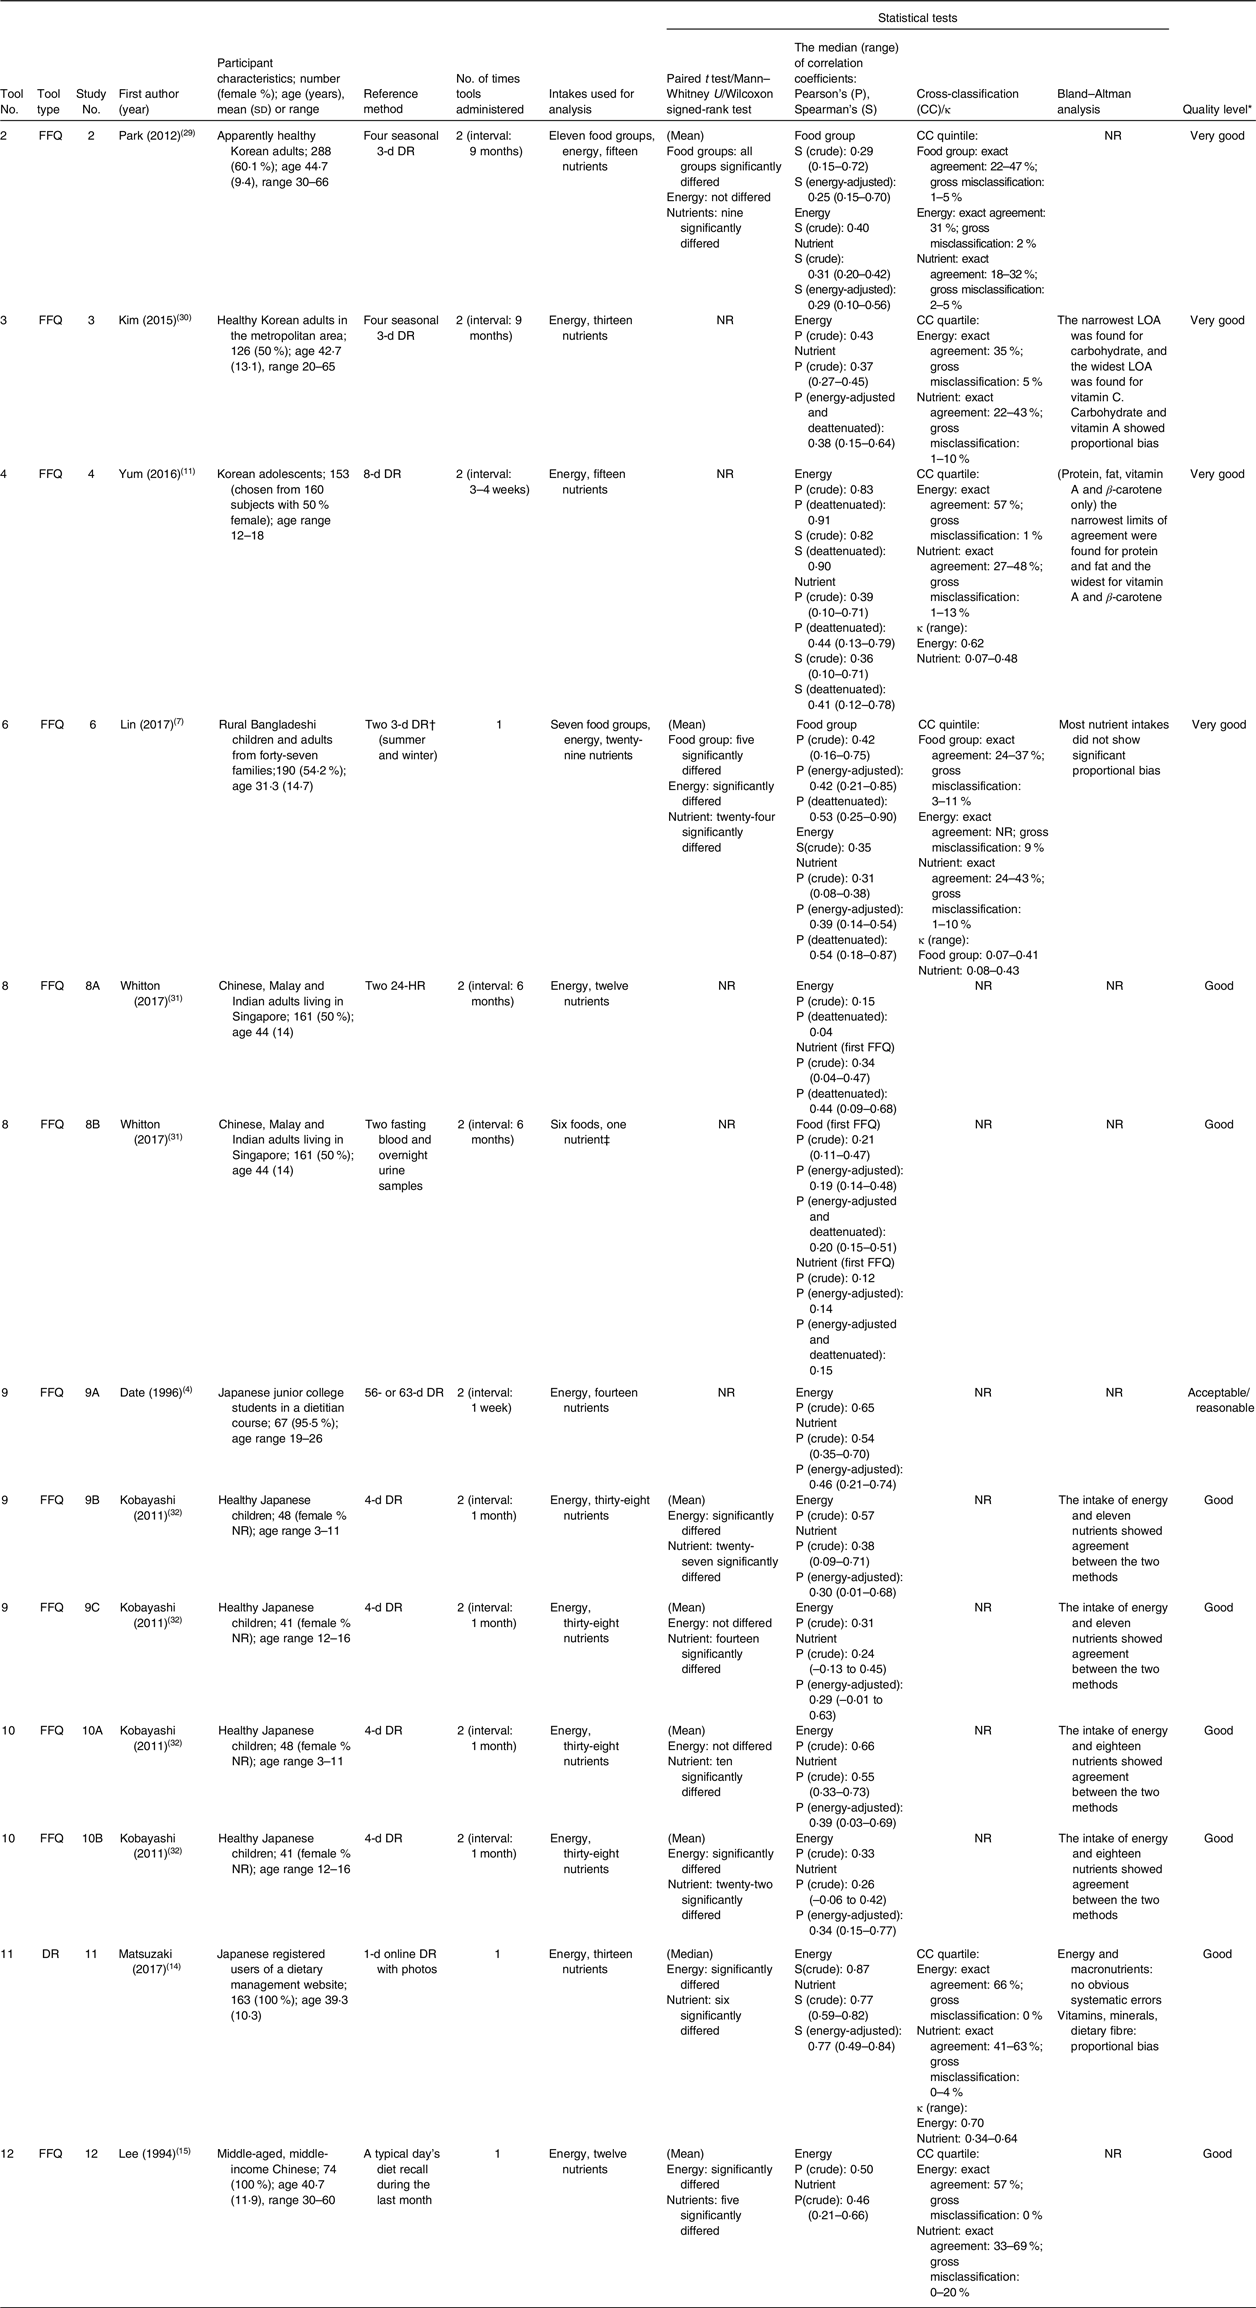
κ, weighted kappa coefficient; DR, dietary record; NR, not reported; LOA, limits of agreement; 24-HR, 24-h dietary recall.
* Evaluated by a scoring system developed by the EURopean micronutrient RECommendations Aligned Network of Excellence(Reference Serra-Majem, Frost Andersen and Henríque-Sánchez25). See online supplementary material, Supplemental Table 2 for the score of each tool.
† Recorded by the female head of the household in charge of food preparation and weighed by research members.
‡ The associations were investigated between urinary isoflavones and soya protein intake, serum carotenoids and fruit and vegetable intake, plasma eicosapentaenoic and DHA and fish and seafood intake, plasma PUFA and polyunsaturated fat intake and plasma odd-chain saturated fatty acid and dairy fat intake.
The mean or median intakes estimated using a dish-based dietary assessment tool were compared with a reference method in eight studies. Food group intakes significantly differed in >70 % of food groups in two studies (Study Nos. 2 and 6). A significant difference in energy intake was observed in five studies (Study Nos. 6, 9B, 10B, 11 and 12), while it was not observed in three studies (Study Nos. 2, 9C and 10A). For nutrients, the mean or median intakes significantly differed in 26–83 % of nutrients investigated in each study (Study Nos. 2, 6, 9B, 9C, 10A, 10B, 11 and 12).
Pearson’s or Spearman’s correlation coefficients were shown in all the thirteen studies. The median crude correlation coefficients for food groups ranged from 0·21 to 0·42 in three studies (Study Nos. 2, 6 and 8B). The crude correlation coefficients for energy ranged from 0·15 (Study No. 8A) to 0·87 (Study No. 11). For nutrients, studies showed a wide range of crude correlation coefficients, with median values ranging from 0·12 (Study No. 8B) to 0·77 (Study No. 11).
Cross-classification was used in six studies (Study Nos. 2–4, 6, 11–12). For food group, two studies showed similar range of percentages for the exact agreement (22–47 % in Study No. 2 and 24–37 % in Study No. 6). The percentage of the exact agreement for energy intake ranged from 31 % (Study No. 2) to 66 % (Study No. 11) across studies, and those for nutrient intake were at a minimum of 18 % (Study No. 2) and at a maximum of 69 % (Study No. 12). Three studies also calculated the κ-statistics (Study Nos. 4, 6 and 11).
Bland–Altman plots were shown in eight studies (Study Nos. 3, 4, 6, 9B, 9C, 10A, 10B and 11). Five studies concluded that energy and nutrients showed agreement (Study Nos. 9B, 9C, 10A and 10B) or no systematic error (Study No. 11) between the test tools and the reference method at a group level. The proportional bias was identified by three studies (Study No. 3, 6 and 11).
Supplemental Table 2 in the online supplementary material shows the details of the quality score of each validation study. The quality levels were classified as very good (Study Nos. 2–4 and 6), good (Study Nos. 8A, 8B, 9B, 9C, 10A, 10B, 11 and 12) and acceptable or reasonable (Study No. 9A).
Current status of the use of dish-based dietary assessment tools
Dish-based dietary assessment tools have been used in fifty-nine studies to evaluate dietary intake (see Table 4 for summary and online supplementary material, Supplemental Table 3 for details)(Reference Sudo, Sekiyama and Watanabe26,Reference Hwang, Kim and Lee33–Reference Ahn, Kim and Lee90) . Tool No. 7 has been used in twenty-four epidemiological studies in Iran. Tool No. 3 was employed in the Korean National Health and Nutrition Examination Survey and has been cited by fifteen studies. The dish-based tools were used mostly in cross-sectional studies to assess diet–disease relationship. Energy was assessed in forty-nine studies, and intakes of nutrients and foods were assessed in forty-three and forty-one studies, respectively. Ethnicity or age of the study participants was in accordance with the original target population in most tools, while Tool No. 12, whose target population was Chinese Americans, was also used for Chinese, Filipino Americans and Taiwanese.
Table 4 Studies using dish-based dietary assessment tools

IV, intervention; RCT, randomised controlled trial; DHQ, diet history questionnaire.
* The number of studies assessing the amount or frequency of foods.
Advantages and disadvantages of dish-based dietary assessment methods
Nine studies described potential advantages or disadvantages of dish-based dietary assessment tools (see online supplementary material, Supplemental Table 4). Four studies reported that dish-based tools would be convenient for data collection and analysis and may decrease participants burden(Reference Lin, Bromage and Mostofa7,Reference Yum and Lee11,Reference Keshteli, Ahmad and Somayeh13–Reference Lee, Lee and Ladenla15) . Three studies from South Korea and Iran have also suggested that dish-based dietary assessment would increase the accuracy of dietary intake assessment, because dietary habits in these countries are characterised by many kinds of mixed dishes with various ingredients(Reference Yum and Lee11,Reference Keshteli, Ahmad and Somayeh13,Reference Kim, Kim and Lee16) . It was also reported that focusing on consumption of mixed dishes rather than food ingredients seemed appropriate for Korean diet-related cancer research, since cancer-related dietary factors are relevant to culture-specific cooking methods and ingredients(Reference Park, Kim and Kim12). Conversely, potential disadvantages were reported in two studies: possibility of counting food items twice as a consequence of having a combination of mixed and discrete items on the food list(Reference Neelakantan, Whitton and Seah28) and systematic error due to large between-person variation in nutrient and food contents in dish items(Reference Park, Noh and Song29).
Discussion
In this review of seventy-four articles, we identified twelve dish-based dietary assessment tools. All the tools were developed for Asian-origin population, including Koreans, Bangladeshis, Iranians, Indians/Malays/Chinese, Japanese and Chinese Americans. Nine tools were validated using self-reported dietary information, and one of them was also validated using concentration biomarkers. Dish-based dietary assessment tools have been used in fifty-nine studies mostly to evaluate the association between diet and disease. To our knowledge, this scoping review is the first to systematically identify and describe dish-based dietary assessment tools.
The reason why dish-based dietary assessment tools were developed and used exclusively for Asian-origin population may be due to the characteristics of the Asian diet. Not only in South Korea and Iran but also in some other Asian countries, including Bangladesh, Singapore and Japan, typical diets are characterised by a variety of mixed dishes cooked with many ingredients, seasonings, spices and oils and prepared by different approaches(Reference Lin, Bromage and Mostofa7,Reference Park, Kim and Kim12,Reference Keshteli, Ahmad and Somayeh13,Reference Lee, Lee and Ladenla15,Reference Kim, Kim and Lee16,Reference Higgins and Green24–Reference Sudo, Sekiyama and Watanabe26,Reference Neelakantan, Whitton and Seah28,Reference Ahn, Kim and Lee90,Reference Shim, Oh and Kim91) . Additionally, it is reported that Korean dishes are served in a unique way that multiple people eat together from a large bowl or dish(Reference Park, Noh and Song29,Reference Ahn, Kwon and Shim92,Reference Na and Lee93) . These characteristics of Asian meals may result in difficulties in answering portion size and consumption frequency of a specific food item that is typically consumed with other multiple foods in mixture(Reference Date, Yamaguchi and Tanaka4,Reference Keshteli, Ahmad and Somayeh13,Reference Kobayashi, Tanaka and Toji27,Reference Park, Noh and Song29,Reference Kim, Song and Lee30,Reference Ahn, Kwon and Shim92) . Therefore, dish-based dietary assessment tools considered more appropriate and accurate for dietary assessment in such populations. Moreover, given that mixed dishes represent combination of foods and cooking methods, and that cooking methods would be a contributing factor of diseases(Reference Park, Kim and Kim12,Reference Kang and Kim89) , dish-based dietary assessment tools may be more relevant to assess diet–disease relationships at least some situations than food-based tools.
Because no study was conducted outside of Asia, it is difficult to evaluate the adequacy and feasibility of using dish-based dietary assessment tools in other populations. Although the dish-based approach may be beneficial in countries where various mixed dishes are consumed, the application of dish-based dietary assessment tools needs further consideration because dish-based tools also have their own disadvantages and dietary cultures vary among diverse populations.
Our results showed that most dish-based dietary assessment tools were paper-based FFQ. However, there were many differences in characteristics such as the number of food or dish items. The number of dish items was lowest (n 15) in an FFQ to assess only energy intake in rural Bangladeshi villagers, which have relatively homogeneous cooking habits(Reference Sudo, Sekiyama and Watanabe26). Meanwhile, an FFQ for multiple ethnic groups living in Singapore, which covered intakes of energy and multiple food groups and nutrients and contained many ethnic-specific items, had the highest number of dish items (n 163)(Reference Neelakantan, Whitton and Seah28). However, time to complete was longest (60 min) in a 122-item FFQ. This may be because it asked portion size or consumption frequency using open-ended questions(Reference Date, Yamaguchi and Tanaka4). Overall, the median number of dish items of the tools was 84, which was comparable with that of conventional FFQ in a previous review (median 79)(Reference Cade, Thompson and Burley6). Although it was expected that the use of dish-based dietary assessment approach could shorten an item list and the time required for completion(Reference Keshteli, Ahmad and Somayeh13), the number of dish items seemed to be determined by the variety of dishes consumed in the target population or study purposes.
Most tools were developed based on 1- or 2-d self-reported dietary information in a target population. Such short-term dietary information might not reflect habitual diet and seasonal variation, although seasonal fruits were added as survey items in several tools(Reference Kim, Kim and Lee16,Reference Kobayashi, Tanaka and Toji27,Reference Neelakantan, Whitton and Seah28) . One tool was developed based on informal interviews with a small group of people or expert opinions, which can also be a useful strategy to construct a list for culturally specific questionnaires(Reference Cade, Thompson and Burley6).
The development of dish lists is crucial to the success of dietary questionnaires(Reference Cade, Thompson and Burley6). The methods to construct a dish list varied among tools, whereas many of them classified dishes based on the various characteristics of dishes, such as nutrient contents, food ingredients and preparation methods. The classification of dishes is important because a different grouping strategy may result in different dish items on the questionnaire(Reference Neelakantan, Whitton and Seah28). However, to our knowledge, there is no ‘gold standard’ for the classification of dishes. Since there has been no established definition of ‘dish’, it is difficult to even differentiate dishes from single foods. Dish classification would differ depending on the cultural differences in the perception towards dishes. In any case, food grouping should fit within respondents’ conceptual framework to facilitate dietary reporting(Reference Cade, Thompson and Burley6).
Most studies developed databases of portion size or composition of dishes based on dietary intake data obtained from the study participants or common recipes or available nutrient databases. The use of actual dietary data would be effective to reflect the diet of the target population in a database, while the values may be affected by measurement error of dietary intake. Contrarily, the use of typical recipes is not influenced by measurement error but may not reflect the actual diet of the target population. It is challenging to determine the standard composition of dish because of the large between-person variations in the amount of food ingredients in a dish(Reference Park, Noh and Song29). Nevertheless, describing the development process is important for the interpretation of tool characteristics and the future development of new tools.
Validation of dietary assessment tools is essential because incorrect information may lead to misunderstanding of associations between dietary factors and diseases(Reference Cade, Thompson and Burley6). Our results suggested that the mean (or median) intake of energy and many food groups and nutrients differed between dish-based dietary assessment methods and the reference in more than half of the studies investigating these variables. The correlation coefficients for energy and nutrient between the two methods ranged widely across studies. The results of each study cannot be easily compared because dietary variables, survey methods and target populations differed among studies. For instance, the study with the highest correlation coefficients for energy compared a 1-d dish-based dietary record and 1-d food-based dietary record (reference) only in women(Reference Matsuzaki, Michie and Kawabata14). Meanwhile, a study showing the lowest correlation coefficients for energy compared two dish-based FFQ (tool) and two 24-h dietary recall (reference) in a group consisting of men and women equally(Reference Whitton, Ho and Tay31). The variations in results may have been partly attributed to such differences in study design. Nevertheless, some studies showed the correlation and exact agreement between the tool and reference, indicating that dish-based dietary assessment methods can be used for future dietary surveys.
Although the quality of the validation studies evaluated by a scoring tool developed by EURopean micronutrient RECommendations Aligned Network of Excellence was ‘acceptable/reasonable’ or above for all studies in this review, sample sizes of several studies were insufficient. Moreover, three studies were conducted in a group consisting of mostly women. This might lead to overestimation of tool validity because women tend to cook meals more often than men(Reference Matsuzaki, Michie and Kawabata14,Reference Mills, White and Brown94) , and this may consequently have influenced the accuracy of reporting dietary intake(Reference Matsuzaki, Michie and Kawabata14). Hence, validation of dish-based dietary assessment tools should be confirmed in population with enough size that includes both sexes. Furthermore, all the validation studies used self-reported information as a reference, which may have correlated errors with dish-based dietary assessment tools(Reference McKeown, Day and Welch95–Reference Yuan, Spiegelman and Rimm97). Although only one study used concentration biomarkers, since they assessed soya protein intake as a proxy for total isoflavone and fruit and vegetable intake as a proxy for carotenoid, these values may be inadequate for a direct comparison(Reference Whitton, Ho and Tay31). Hence, evaluation of the estimation ability of dish-based dietary assessment methods needs further biomarker-based validation studies.
Most dietary assessment tools were used in cross-sectional studies that assessed diet–disease relationships. The two most used tools were both developed within the framework of the specific epidemiological surveys and used in each of the survey(Reference Keshteli, Ahmad and Somayeh13,Reference Kim, Song and Lee30) . Studies citing Tool No. 7 reported that the tool was validated against 3-d 24-h dietary recalls(Reference Barak, Falahi and Keshteli48–Reference Shirani, Esmaillzadeh and Keshteli51,Reference Saneei, Fallahi and Barak53) or 3-d dietary record(Reference Valipour, Esmaillzadeh and Azadbakht62,Reference Anjom-Shoae, Sadeghi and Keshteli68,Reference Salari-Moghaddam, Keshteli and Haghighatdoost74) , or it has not been validated(Reference Khayyatzadeh, Esmaillzadeh and Saneei56,Reference Khodarahmi, Azadbakht and Daghaghzadeh57) , whereas we could not find the original paper describing such validity investigation. Tool No. 12 was used in a different population from the population in which the tool was developed and validated. Since dietary habits vary among different populations, a separate validation study would be needed for that population living in other provinces with unique dietary culture(Reference Park, Noh and Song29).
The strength of this review is the use of a comprehensive search strategy supplemented by reference and citation search. However, we are not certain that all relevant articles were identified. Given that existing dish-based dietary assessment tools are designed to be population specific, other studies on this topic may be published in native language except for English. Moreover, there may be other tools that have similar characteristics to the identified dish-based dietary assessment tools but did not meet the definition of tools set for this study. In fact, there are other FFQ including cooked items in survey items(Reference Block, Hartman and Dresser18,Reference Shahar, Shai and Vardi19) . However, since the difference between cooked and not cooked or dish or food is not clear, it is difficult to distinguish tools based on survey items of tools (e.g., the proportion of dish items included in a questionnaire). The concept of dish would differ among countries because each country or area has a variety of differences in food culture. Hence, we identified dish-based dietary assessment tools based on tool names and development purposes.
In conclusion, the present scooping review has identified a range of dish-based dietary assessment tools. They were exclusively developed and used in Asian-origin population at present. Although most tools were validated, there were many limitations in the study designs or reference methods. Further validation studies, particularly biomarker-based studies, are needed to assess the ability and wider application of dish-based dietary assessment tools.
Acknowledgements
Acknowledgements: None. Financial support: This research received no specific grant from any funding agency, commercial or not-for-profit sectors. Conflict of interest: None of the authors has any conflict of interest to declare. Authorship: N.S. formulated the research question, designed the research, conducted the review, drafted the first and revised version of the manuscript and had primary responsibility for the final content. X.Y. conducted the review. K.M. provided the critical oversight of the project, including critical input to the manuscript, and contributed to the preparation of the revised version of the manuscript. S.S. assisted in the writing of the manuscript. All authors read and approved the final manuscript. Ethics of human subject participation: Not applicable.
Supplementary material
For supplementary material accompanying this paper visit https://doi.org/10.1017/S136898002000172X.


 Open access