


Chronic diseases, also known as noncommunicable diseases, are the leading causes of disease and death worldwide. They cause 41 million deaths every year, equivalent to 71 % of global deaths(1,2) . In 2016, the mortality rate of chronic diseases among Chinese residents was 739/100 000, accounting for 89 % of total deaths, which was much higher than that caused by infectious diseases, traffic accidents, etc.(3). Chronic diseases have devastating impacts on society, economy and public health(Reference Yang, Wang and Zeng4,5) . The WHO has pointed out four modifiable behavioural risk factors for chronic diseases, including unhealthy diet, smoking, alcohol consumption and physical inactivity(1). An unhealthy diet is of primary risk and is the most prevalent factor affecting the occurrence and development of chronic diseases(Reference Majid and Elio6,Reference Majid and Elio7) . The Global Burden of Disease Study 2017 showed the number of deaths attributed to unhealthy diet worldwide reached 10·9 million(Reference Gakidou, Afshin and Abajobir8). Therefore, a comprehensive estimation and comparison of the disease risk of dietary factors can help to develop specific and effective disease prevention and control strategies(Reference Sun and Li9,Reference Li, Liu and Wang10) .
A large number of studies have analysed people’s eating and drinking behaviours, including the time and frequency of eating, the collocation of meat and vegetables, the intake of dairy products, salt and oil, and the proportion of coarse and fine grains(Reference Stookey, Wang and Ge11–Reference Su, Yang and Liu14). However, there were only a few studies related to dietary tastes, and their taste qualitative indexes were based on subjective evaluation, which was mainly due to the scarcity of systematically collected databases(Reference Su, Yang and Liu14,Reference Shen, Shi and Li15) . As a result, the quantitative studies on the relationship between taste preferences and chronic diseases have been extremely deficient.
It is true that the taste preference surveys based on individuals are costly and complex to conduct. In this respect, increasingly popular crowdsourcing data can provide a new perspective for quantitative taste research – taste preference quantisation based on population. In practice, due to the advantages of ample sources, sizable amounts and comprehensiveness, crowdsourcing data have been widely used in public health and medical fields, such as disease prediction, evidence-based public health decision-making, health management and monitoring, and personalised medicine(Reference Howe16–Reference Meng, Luo and Yu18). The use of crowdsourcing data to mine the overall taste preferences of the residents in a region can not only eliminate the impact of undersampling and reduce the cost of data collection but also show the overall characteristics of regional taste preferences more effectively.
China has a vast territory, large population and abundant resources. Different products, climates, religions and customs have bred unique regional food culture, with each province boasting specialties that form completely separate cuisines(Reference Cheng19–Reference Wang and Qiu23). Tastes, the core of Chinese food, differ from cuisine to cuisine. To some extent, the taste characteristics of the cuisine in a province can reflect the taste habits and preferences of the local people. Therefore, China is selected as our target area to carry out studies related to regional taste differences.
In this study, we extract and quantify people’s taste preferences by combining the crowdsourcing online recipes and restaurant data of each province in China. The association between chronic diseases and dietary tastes was established through the Geodetector method(Reference Wang, Li and Christakos24). The results provide basic data for exploring the impact of dietary taste preferences on the occurrence of chronic diseases. The present study addresses gaps in the quantitative studies related to tastes and chronic diseases, and it is a new attempt to apply crowdsourcing data, instead of individual surveys, to obtain research information in the field of public health.
Data and methods
Data
Crowdsourcing online recipes
Dietary taste data were obtained from Meishijie (http://www.meishij.net/), which provides structured recipe data and divides all dishes into a total of twenty cuisines according to their origins. In this study, the seasoning list of each recipe was used as the main data source for extracting dietary tastes. For example, the seasonings used in the Sichuan dish ‘Poached Spicy Slices of Pork’ include bean paste, light soy sauce, salt, dried chili, sugar, Chinese prickly ash, oil and garlic, as shown in Fig. 1.

Fig. 1 Seasonings of a dish (captured from Meishijie.com)
Points of interests of restaurants
Points of interests (POI) of restaurants were retrieved from Amap (https://www.amap.com/), an electronic map website, in August 2017. More than 7 million POI have been obtained in thirty-four provincial administrative regions in China. Each POI records information, including the name, detailed location coordinates and cuisine of the restaurant (such as ‘Sichuan cuisine’). Such information was used to analyse the proportion of each cuisine in each province.
Mortality of chronic diseases
Death cause surveillance served as one of the data sources of chronic disease(Reference Gu25). The data used in this study came from the ‘Atlas of Death Cause by Major Diseases of Residents in China’, which was published in 2013 by the National Centre for Chronic and Noncommunicable Disease Control and Prevention (http://ncncd.chinacdc.cn/)(Reference Abubakar, Tillmann and Banerjee26). Cause-specific mortality (unit: 1/100 000) refers to the number of deaths caused by a certain disease per 100 000 people in a given region, which reflects the degree of harm of various diseases and injuries to the residents’ lives(Reference Kirkwood and Sterne27). The data include multiple causes of death, covering thirty-three provincial administrative regions in China (no data available in Taiwan Province). In this study, seventy-one categories of chronic diseases were selected from all death causes as study subjects.
Methods
The data processing and research flow of this study are shown in Fig. 2. First, the seven taste indexes of each cuisine (Cuisine-Taste Matrix) were set up by analysing the recipe data. Through the statistics of the restaurant POI data, the proportions of various cuisines in each provincial region (Region-Cuisine Matrix) were obtained. Then, the seven taste indexes in each provincial region (Region-Taste Matrix) were calculated based on the above results. Finally, the Geodetector method was used to detect the association between the seven tastes and mortality of each chronic disease.

Fig. 2 Data processing and research flow
Extraction of cuisine taste
A web crawler was used to collect the recipe for each dish of every cuisine. Since there was no standardised measurements of the amounts of seasonings, we quantified the taste from the perspective of seasoning frequency of use.
First, the ingredients and seasonings of all recipes were gathered and merged (if the same item had multiple names) to determine the types of tastes used in this study. Based on the existing research on taste science, and by combining the particular context of Chinese food culture, we selected seven dimensional taste or sensation measurements to establish the ‘ingredients-taste’ reference table. They were ‘sour’, ‘sweet’, ‘umami’, ‘salty’, ‘fat’, ‘spicy’ and ‘pungent’(Reference Zhang28–Reference Ikeda31). Technically, ‘spicy’ and ‘pungent’ are better acknowledged as flavours but not tastes. But in China, people often think of them as two common tastes paralleling the other five tastes. So, in this study, these two sensations are also called tastes for convenience. The ‘spicy’ sensation here refers to the ‘hot’ feeling of capsicum, while the ‘pungent’ sensation refers to various peppery and irritating feelings of various sources other than capsicum, such as mustard, garlic and Zanthoxylum bungeanum Maxim.
Then, after deleting the tasteless ingredients, every ingredient or seasoning was labelled with one or more tastes. For example, the seasoning ‘seafood sauce’ was labelled with ‘salty’ and ‘umami.’ If some different seasonings with a certain taste were used in one dish at the same time, the dish would be labelled with that taste several times. The labels of seven tastes for every dish were counted to calculate the frequency of use of these seven tastes for every dish.
Finally, through summarising all the dishes of each cuisine and taking the average of each taste’s frequency of use in every dish, seven taste quantitative indexes for each cuisine were obtained.
Calculation of the taste indexes in each region
The sixteen cuisines that the POI used to classify the categories of restaurants are all included in the twenty cuisines covered by the recipe data. In this study, we used the POI corresponding to these sixteen cuisines that were shared by the two groups of data to extract regional tastes. There were 387 509 valid POI corresponding to the sixteen cuisines, with Guangdong and Macao having the largest and the least number of valid POI – 63 420 and seventy-one, respectively. The proportions of the POI of these sixteen cuisines to the total valid POI in the thirty-three provincial regions were analysed, and the values of the seven taste indexes of each provincial region were calculated according to the taste quantitative indexes of each cuisine. Taking ‘spicy’ in Sichuan Province as an example, the proportion of the POI of Sichuan cuisine to the total valid POI in Sichuan Province was taken as the weight and multiplied by the spicy index of Sichuan cuisine to obtain the contribution of Sichuan cuisine to the spicy taste in Sichuan Province. By analogy, every cuisine’s contribution to the spicy taste in Sichuan Province was obtained and added together to obtain the spicy index in Sichuan Province.
Pre-processing of taste data
Discrete taste explanatory variables are required when using the Geodetector method, while the taste indexes of regions are continuous. Therefore, taste indexes need to be discretised to meet the precondition of using this analysis method. In this study, we adopt the discretisation method introduced by Cao et al.(Reference Cao, Ge and Wang32), and the number of provincial regions within each level of each discretisation method was guaranteed to be at least two(Reference Wang and Xu33). Finally, thirty-five discretisation schemes were formed by sequentially combining the five discretisation algorithms with the seven hierarchical approaches. These five discretisation algorithms were equal interval, geometrical interval, natural break, quantile and sd. The seven hierarchical approaches referred to dividing the taste indexes into two to eight levels, and thirty-five discretisation schemes were tested on each taste individually.
Using the above approach, the discretisation of a certain taste index was performed, which was equivalent to apply the hierarchical clustering to thirty-three provincial regions according to the frequency of use of that taste, and the entire study area was divided into sub-regions with different taste levels.
Geodetector
The Geodetector was proposed in 2010 to measure the spatial stratified heterogeneity of geographical entities, as well as to reveal the driving forces behind spatial stratified heterogeneity(Reference Wang and Xu33). This method was first applied to assess the environmental risks of an endemic disease, such as neural tube defects, and has been widely used in landscape science, social science, land use, environmental science and human health in recent years(Reference Wang, Li and Christakos24,Reference Xu and Zheng34) . In this study, the Geodetector was introduced to explore the association between dietary taste preferences and the occurrences of chronic diseases in different regions.
The Geodetector includes three detectors. The factor detector identifies factors that are responsible for the risk and the power of determining the risk factors for the disease, which is expressed by the q-value shown in equation (1). The interaction detector reveals whether the risk factors interact or lead to disease independently. Lastly, the risk detector indicates whether there are significant differences in disease occurrences between sub-regions with different taste levels.
 $$\(q = 1 - {{{\rm{SSW}}} \over {{\rm{SST}}}} = 1 - {{\mathop \sum \nolimits_{h = 1}^L \mathop \sum \nolimits_{i = 1}^{{N_h}} \left( {{Y_{hi}} - \overline {{Y_h}} } \right)} \over {\mathop \sum \nolimits_{i = 1}^N \left( {{Y_i} - \overline Y } \right)}}\)$$
In equation (1), SSW represents the sum of the variances of the disease occurrences for the regions with different taste levels, SST represents the total variance of the disease occurrences for all regions, N represents the number of regions and h represents the level of a factor (h = 1,2,…,L). In this study, the discretisation scheme with the largest q-value was preferred(Reference Cao, Ge and Wang32), and the optimal number of levels is equal to L; $\(\overline Y\)$
and
$\(\overline Y\)$
and $\({{\overline Y_h}}\)$
represent the mean disease occurrence for all regions and for the regions with the taste level h, respectively; Yi and Yhi represent the disease occurrence for the i-th region of all regions and for the i-th region with taste level h, respectively. Note that the range of q-values is (0, 1). q = 1 means that the geographical division of the factor completely explains the spatial pattern of the disease, whereas q = 0 implies a completely random spatial occurrence of the disease.
$\({{\overline Y_h}}\)$
represent the mean disease occurrence for all regions and for the regions with the taste level h, respectively; Yi and Yhi represent the disease occurrence for the i-th region of all regions and for the i-th region with taste level h, respectively. Note that the range of q-values is (0, 1). q = 1 means that the geographical division of the factor completely explains the spatial pattern of the disease, whereas q = 0 implies a completely random spatial occurrence of the disease.
In this study, there are thirty-three provincial regions (N = 33). The disease occurrences of thirty-three provincial regions were used as response variables, and the discrete indexes of seven tastes for all regions were used as independent variables to conduct the Geodetector. For a certain taste, the higher q-value represents that this taste factor has a stronger ability to explain the spatial distribution pattern of the disease and can better reveal the effect of taste on the occurrence of the disease.
Results
Cuisine taste measurement
The numbers of the recipes of twenty cuisines obtained by web crawling in this study are shown in Table 1. For each cuisine, seven quantitative taste indexes were visualised by a colour chart. By comparing the seven tastes, this colour chart showed that the usage of the ‘pungent’ taste was the most frequent, followed by ‘salty’, while ‘spicy’ and ‘sour’ tastes were used in low frequency. Comparison of twenty cuisines showed that the dishes in Hong Kong and Taiwan had a ‘sweet’ emphasis, the dishes in Sichuan leaned towards ‘spicy’ and the dishes in Hubei were tended towards ‘pungent’. These results were basically in line with people’s general perception.
Table 1 Numbers of recipes and cuisine taste indexes

POI, points of interest.
Taste indexes of each region
After data collation and analysis, a total of 387 509 restaurant POI categorised by sixteen cuisines in the thirty-three provincial regions were obtained, with their proportion shown in Fig. 3. In most regions, the POI for Chuan cuisine and Qingzhen cuisine accounted for greater proportions. Besides, the cuisine accounted for a higher proportion in its origin region than in other regions. For example, Hui cuisine was the most abundant in Anhui Province and Zhe was the most popular cuisine in Zhejiang Province.
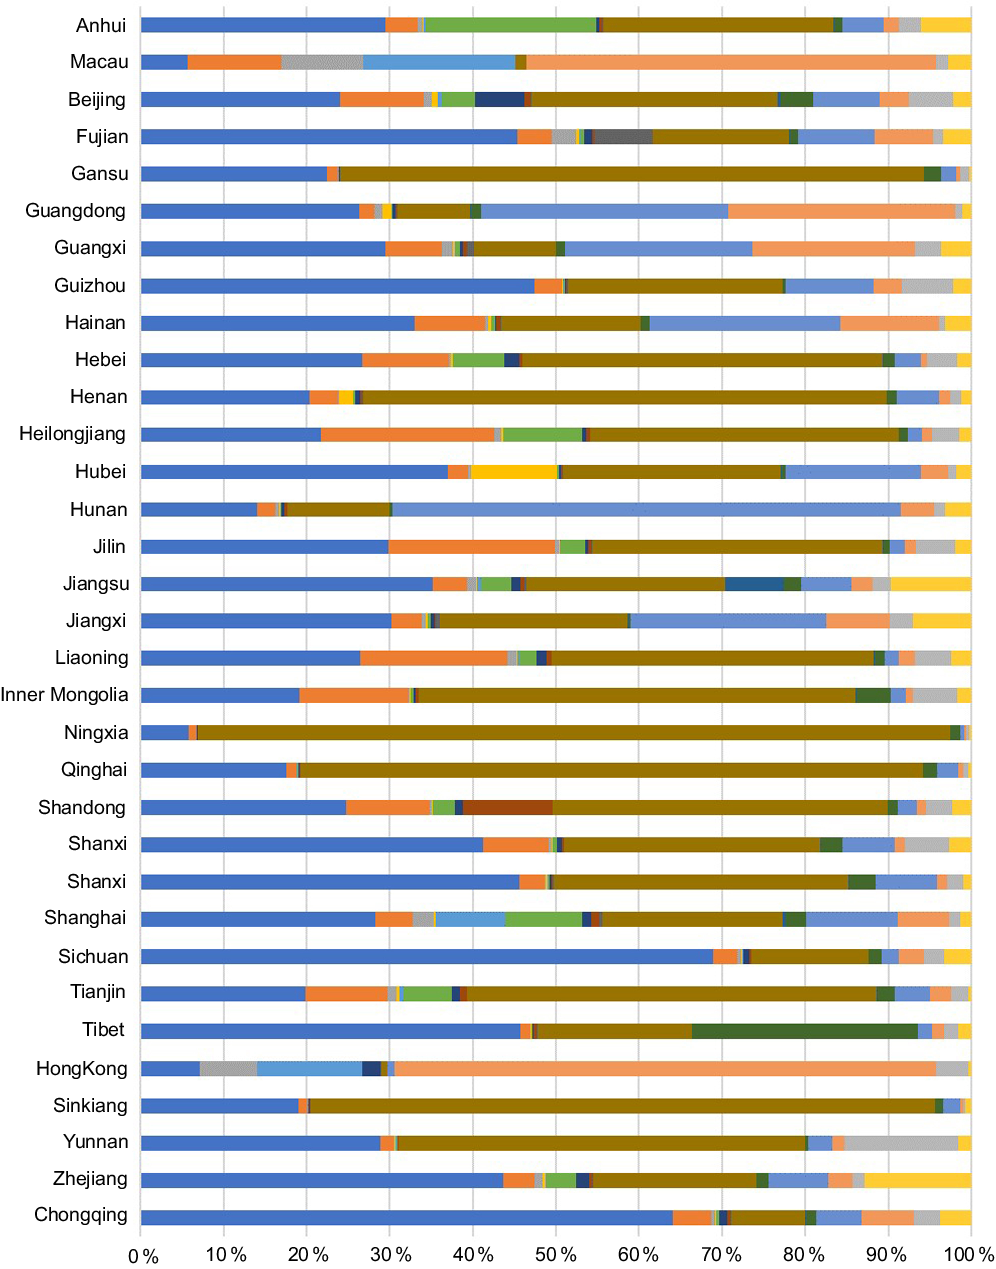
Fig. 3 Proportions of various types of POI in provincial regions. ![]() , Chuan;
, Chuan; ![]() , Dongbei;
, Dongbei; ![]() , Gangtai;
, Gangtai; ![]() , Hubei;
, Hubei; ![]() , Hu;
, Hu; ![]() , Hui;
, Hui; ![]() , Jing;
, Jing; ![]() , Lu;
, Lu; ![]() , Min;
, Min; ![]() , Qingzhen;
, Qingzhen; ![]() , Su;
, Su; ![]() , Xibei;
, Xibei; ![]() , Xiang;
, Xiang; ![]() , Yue;
, Yue; ![]() , Yungui;
, Yungui; ![]() , Zhe. POI, points of interest
, Zhe. POI, points of interest
To facilitate the comparison of tastes in the entire study area, the taste index in each provincial region was standardised by the mean taste index of all regions. As shown in Fig. 4, beyond ‘sweet’, the other six tastes in Macao and Hong Kong were mild; Gansu, Ningxia and Qinghai generally preferred strong tastes; across all provincial regions, Sichuan food was the spiciest; and Ningxia used the most ‘umami’ taste seasonings.

Fig. 4 Standardised indexes of seven tastes in provincial regions
Geodetector results
Factor detector results
Given a significance level of 1 %, the q-values for the factor detectors significantly associated with taste-disease combinations are shown in Table 2. There were sixteen kinds of diseases that emerged out of the seventy-one chronic diseases that exhibited significant correlations with one or more tastes.
Table 2 Q-statistics for the factor detector*

* Association between disease and taste is not significant and represented by en dash.
According to the number of diseases with significant association, seven taste factors were ranked: salty (9) > pungent (7) = sour (7) > fat (4) > spicy (3) > sweet (2) = umami (2).
From the view of the number of significant tastes corresponding to the disease, most chronic diseases had significant associations with only one taste factor. Whereas for a few chronic diseases, such as nasopharyngeal cancer, ovarian cancer and colorectal cancer, multiple tastes showed significant associations.
Interaction detector results
There were a total of twenty-one pairwise interactions for the seven tastes. As shown in Table 3, except for the interaction of the ‘salty’ and ‘pungent’ tastes, all the other taste interactions corresponded to one or more diseases. According to the interaction detector results for these diseases, seventy-five groups of ‘tastes pairwise-disease’ combinations had nonlinear enhancement outcomes, which means taste interactions can better explain the occurrence of the sixteen diseases than a single taste, at least in terms of spatial distribution.
Table 3 Results of the interaction detector

As far as single taste factors, according to the number of ‘taste pairwise-disease’ combinations with significant results that they participated in, they were ranked in descending order as umami (37) > spicy (24) > sweet (22) > sour (20) > fat (19) > salty (15) > pungent (13). This result showed a trend generally opposite to the frequency of occurrence of each taste compared to the factor detector results (Table 2). Taking ‘umami’ as an example, there were only two diseases with significant results corresponding to this single taste factor, which was the lowest among the seven tastes. In contrast, when the taste ‘umami’ was interacting with other taste factors, the number of diseases having a nonlinear enhancement effect of the pathogenic risk was 37, which was the highest among the seven tastes.
Risk detector results
Combining the common perception of healthy eating behaviours and the popular perception of common disease risk, we chose the disease-taste combination of ‘haemorrhagic stroke-salty’ as an example to illustrate the results of the risk detector, which had a significant result.
The spatial distribution of the standardised mortality of haemorrhagic stroke is shown in Fig. 5. The western region as a whole was a high-value region, the value of the northeastern region was intermediate and the low-value region was continuously distributed along the southeastern coast. The value of the south-central region gradually increased from southeast to northwest, without any obvious abrupt changes in this area; however, the areas are distinguished hierarchically.

Fig. 5 Standardised mortality of haemorrhagic stroke in provincial regions
‘Salty’ was the only taste risk factor significantly associated with haemorrhagic stroke (Table 2). The abscissa in Fig. 6 represents the six levels at which the taste ‘salty’ is divided, with higher levels representing greater saltiness. The ordinate represents the mean disease mortality rate of the provincial regions with respective saltiness. It can be seen that the risk of haemorrhagic stroke goes up with the increase in the ‘saltiness’ of the dietary taste.

Fig. 6 Risk detector results for haemorrhagic stroke (NB(6): natural break method, six levels)
Due to the monotonically increasing trend shown in Fig. 6, this association can be more intuitively observed in spatial correlation by comparing the small maps of the spatial distributions of the seven tastes in Figures 4 and 5. In other words, the spatial distribution of the frequency of use of the taste ‘salty’ most closely approximates the description of the distribution of the above diseases, which is more in line with people’s universal cognition. In addition, upon reviewing the medical literature related to haemorrhagic stroke, the finding that increased saltiness increased the risk of haemorrhagic stroke was confirmed to be consistent with existing studies(Reference Chisato, Naoyoshi and Natsuki35,Reference Yu, Luo and Li36) .
Discussion
Taste is a form of chemoreception, which occurs in specialised taste receptors in the mouth. According to previous research, there are five different types of taste these receptors can detect – sour, sweet, umami, salty and bitter(37). Because bitter foods are generally found unpleasant, bitter is not common in diets. As a result, we neglected this kind of taste in our study. Besides the five basic tastes, there is evidence for a sixth taste that senses fatty substances. In 2015, researchers suggested a new basic taste of fatty acids called fat taste. Olive oil, fresh butter and various kinds of vegetable and nut oils are typical foods that offer fat taste(Reference Keast and Costanzo38–Reference DiPatrizio40). The tongue can also feel other sensations not generally included in the basic tastes. These are largely detected by the somatosensory system. In Asian countries, within the sphere of mainly Chinese and Indian cultural influence, ‘spicy’ and ‘pungent’ have traditionally been considered two representative tastes besides the basic tastes. Although not tastes, these two kinds of sensations fall into a category called chemesthesis, and we called them tastes as well paralleling the other basic tastes for convenience in this study. Therefore, seven tastes were settled on in this study.
To date, there have been many cell biology studies on taste mechanisms demonstrating that taste has an important role in human evolution. For example, taste is responsible for evaluating the nutritional content of foods; taste preferences may have specific correlations with nutritional deficiencies and different tastes take on the role of recognising different chemicals to help identify and distinguish key dietary components and prevent the intake of toxic substances(Reference Sherman and Billing41–Reference Chaudhari and Roper43). When the body suffers from disease or discomfort, the function of taste will be subject to interference, thereby affecting the body’s intake of food(Reference Li, Chen and Zhang44). An improved understanding of taste biology and genetics may prevent or influence the development of chronic disease risk(Reference Chamoun, Mutch and Allen-Vercoe45). All of the above findings have been obtained through the experimental study of individuals. Although such a method enforces a more rigorous scientific basis, the research cost is higher and research method less transplantable. This study is the first to present a quantitative approach to the study of potential health risk factors based on crowdsourcing data mining. A unique feature of our study is that it starts from the spatial distribution pattern of the disease on the one hand, extracts the spatial distribution pattern of risk factor from crowdsourcing data on the other hand and spatially correlates the two. The results obtained are more universal and exploratory. Therefore, they can be used for exploration of associations in further public health research.
As an exploratory attempt to quantitatively analyse the taste risk factors of diseases using crowdsourcing data, the uncertainty of the research and applicability of the results still need further discussion and reflection:
-
(1) As to the method, on the one hand, since the chronic diseases were associated with dietary tastes by the Geodetector simply from the spatial statistical perspective, the diseases unselected by the Geodetector did not mean that they were not related to dietary tastes. For example, there was no significant association between sweet and diabetes in this study. Also, the diseases selected by the Geodetector did not necessarily mean that they could be completely explained by the related tastes. On the other hand, compared with simple bivariate correlation analysis, the advantage of the Geodetector is to detect the complex association between the taste and disease that is not limited to a linear relationship. By discretising the taste data, the nonlinear correlation can be more intuitively presented by clustering. Furthermore, if a significant association can be further confirmed in medical experiments, a discrete taste level will be easier in practice when developing public health interventions.
-
(2) As for the results, haemorrhagic stroke, as an example, showed our finding was consistent with prior knowledge, which preliminarily confirms the quantitative approach presented in this study is useful to the study of potential health risk factors and the findings are referable. Besides, there are some interesting results to note. In the results for risk detectors, a higher sour level corresponds to a lower risk of colorectal cancer, and a higher spicy level corresponds to a lower risk of ovarian cancer. Some pathological research has provided a possible explanation for such results. For example, the principal active component of spicy food is capsaicin. Researchers have found that capsaicin has a beneficial role in various cancers(Reference Sharma, Vij and Sharma46). Garlic is a common pungent seasoning, which has an antibacterial effect, and it has the potential to reduce the occurrence of colorectal cancer(Reference Tsai, Chen and Sheen47). But all these conjectures need to be verified by rigorous clinical experiments.
We have noted the active expression of umami in our results of the interaction detector. The taste umami acts as a ‘catalyst’ when it interacts with other tastes. The taste umami itself is not strongly related to most chronic diseases; however, when combined with other tastes, especially sour and sweet, it forms compound tastes such as umami-sour and umami-sweet, both of which have statistically significant associations with many chronic diseases. This joint effect of multiple tastes as a health factor has been suggested by many studies(Reference Bartoshuk48–Reference Capitanio, Lucci and Tommasi51). For example, the combination of ginger (pungent) and vinegar (sour) has a synergistic antibacterial effect(Reference Guan, Li Tian and Da Huang52). This indirect clue derived from our results may be beneficial to explain the association between this taste pairwise and chronic obstructive pulmonary disease or rheumatic heart disease.
It should be noted that the results of this study are data-driven. Due to the deficiency of the research on the relationship between chronic diseases and dietary tastes, only a small part of the results shown in Tables 2 and 3 can be related to the existing research. Most findings are presented for the first time, and their rationality may lack support from existing research findings or may have not even been studied yet. These results need to be interpreted or overturned more reasonably through pathological experiments. Although these results have not yet been confirmed, the value of these exploratory findings lies in providing basic data for scientific research in related fields and pointing out new study directions.
-
(3) This study was restricted by its data sources – the taste data obtained by using the POI of restaurants in 2017 were used to try to interpret the cause of death in 2013. As the effects of dietary tastes on chronic diseases exhibit hysteresis, the time design of the data in the experiment was not logically optimal; instead, the data’s accessibility alone became the priority. But, considering eating habits in a region are the result of accumulated behaviours following a long period of practice, dietary tastes will not change substantially in a short period of time. Therefore, in this study, we used 1-year restaurant POI data as a microcosm of the regional food categories to reflect the local taste characteristics, which is of scientific significance. However, if there are longer periods of regional restaurant data and chronic disease data collected thereafter and they are analysed from the perspective of spatial lifecourse epidemiology, the impact of the time effect described above can be maximally eliminated, allowing for a more scientific conclusion to be drawn(Reference Jia53). Also, this research method would have higher reference value and can be applied to the exploratory analysis of the causes of more diseases.
-
(4) From the perspective of dietary culture geography(Reference Cheng19), dietary cultures of different regions are integrated with each other. Differences in dietary taste do not have obvious geographical divisions, and choosing different spatial scales will yield different sensitivities to the problem, which is affected by the modifiable areal unit problem. Therefore, it should be emphasised that this study is limited by disease data sources. The experiment was conducted on the provincial spatial scale. The conclusions obtained are specific to the national scale and are not necessarily applicable to other spatial scales. Therefore, the conclusions have a spatial scale-effect problem. In addition, the conclusions from this experiment may be mainly applicable to China where the food environment is arranged and affects chronic disease risk in a unique way(Reference Jia, Xue and Cheng54–Reference Wang, Jia and Cheng57). For different countries or regions, the experiment needs to be adapted to local data. If the data on chronic diseases can be obtained with higher spatial resolution, the methodology of this experiment can be expanded at different scales of research to detect chronic disease risk factors that are more regionally specific.
Acknowledgements
Acknowledgements: The authors would like to thank Jinfeng Wang at the Institute of Geographic Science and Natural Resources Research, CAS and Junrui Chang from the Environmental Control Center of Chinese Center For Disease Control and Prevention for their suggestions and encouragement during the formation of this paper. The authors would be grateful to Chengdong Xu, associate research fellow at the Institute of Geographic Science and Natural Resources Research, CAS and Dr. Yongze Song, the Curtin University of Australia for their attributions on the maintenance of the R-package of the Geographical Detector. The author would also like to acknowledge the work done by Weikai Qiu for his contribution to the experimental data processing section. Financial support: None. Conflict of interest: None. Authorship: T.F. and P.J. conceived and designed the study. H.L. performed data analysis and drafted the paper. T.F. and H.L. revised the manuscript and critically discussed the results. All authors were involved in interpreting the data and approved the final paper. Ethics of human subject participation: This study was not a clinical trial. Ethical standards disclosure is not necessary in this study.


