


Introduction
The development of high-performance solid-state white lighting (SSWL) materials and devices remains intense, with phosphor down-converted light–emitting devices (LEDs), a dominant technology. The approach of using InGaN-based blue LED down-converted with Ce:YAG has proven extremely successful commercially [Reference Pust, Schmidt and Schnick1]. To meet the ever-increasing needs for higher brightness and high-efficiency integrated devices, designs are trending toward using semiconductor laser diodes (LD) as a pumping source because high pump powers lead to increased down-converted brightness without sacrifices in efficiency because unlike LEDs, LD does not suffer efficiency droop at high drive currents [Reference Wierer and Tsao2].
The higher power promised by LD white light, however, leads to significant thermal management concerns at the integrated device level that are often dictated by the thermal properties of the phosphor capping layers. The higher pump powers and power densities lead to localized heating stemming from quantum defect during down-conversion, which can degrade the photoluminescent (PL) properties through temperature-dependent quenching effects, for example [Reference Bachmann, Ronda and Meijerink3]. In addition, aggressive pumping ultimately leads to thermal gradients within the phosphor capping layer(s) that may result in melting and/or thermal fracture. Melting of the capping layer is particularly prevalent in low–thermal conductivity materials such as polymer–phosphor composites, which have k < 1 W/(m K), whereas thermal fracture can occur in bulk glasses and ceramics which have moderate thermal conductivities [1–2 for glasses [Reference Waxler, Cleek, Malitson, Dodge and Hahn4], and ∼10 W/(m K) for RE:YAG [Reference Klein and Croft5]].
To solve these thermal managements problems, SSWL device engineers are relying on strategies developed to address similar thermal management problems observed in monochromatic light conversion sources, i.e., high-powered solid-state lasers. These methods include (i) using conversion phosphor materials with improved thermomechanical properties and (ii) relying on more sophisticated cooling schemes to reduce the localized thermal load. This is because the deliverable power of the converter scales with the thermal conductivity k and the fracture stress σF with the thermal shock figure of merit given by the following equation:
 $${R_{\rm{s}}} = {{k\left( {1 - v} \right)} \over {\alpha E}}{\sigma _{\rm{F}}}\quad ,$$
where E is the elastic modulus, α is the coefficient of thermal expansion, and v is Poisson's ratio.
The material issues are being addressed by (i) shifting away from embedding active phosphors such as Ce:YAG within polymer epoxy and instead using glasses as encapsulants [Reference Zhou, Luo, Liu, Gu, Lu, Zhang, Fan, Jiang and Wang6], (ii) using bulk ceramic or single crystal Ce:YAG [Reference Waetzig, Kunzer and Kinski7] and (iii) using highly thermally conductive passive ceramics as a phosphor encapsulant, i.e., an Al2O3/Ce:YAG composite [Reference Cozzan, Lheureux, Dea, Levin, Graser, Sparks, Nakamura, Denbaars, Weisbuch and Seshadri8, Reference Denault, Cantore, Nakamura, DenBaars and Seshadri9, Reference Park, Cho and Kwon10, Reference Wang, Tang, Zheng, Li, Zhou and Xie11], which results in a higher composite thermal conductivity. The management can be addressed by using different heat sink materials for the LED packaging [Reference Fulmek, Sommer, Hartmann, Pachler, Hoschopf, Langer, Nicolics and Wenzl12]. In addition, many different hosts for Ce have been investigated as suitable candidates to replace YAG, such as glasses [Reference Yu, Liu, Dai, Sheng, Luan and Peng13], other garnets [Reference Devys, Dantelle, Laurita, Homeyer, Gautier-Luneau, Dujardin, Seshadri and Gacoin14] and sesquioxides [Reference Raukas, Konrad and Mishra15] because their relatively open structure permits high solubility (∼5%) of rare earth ions [Reference Lupei, Lupei and Ikesue16]. Many other rare earths and transition metals have also been doped into many crystal hosts to produce phosphors for down-converting blue and ultraviolet (UV) pumping [Reference Tsao, Crawford, Coltrin, Fischer, Koleske, Subramania, Wang, Wierer and Karlicek17].
However, with few exceptions [Reference Wieg, Penilla, Hardin, Kodera and Garay18], it has proven difficult to find another single material system that possesses such a broad PL spectrum as Ce:YAG. The different crystal field interactions result in doped phosphors with unique optical properties. This leads to designs reliant on mixtures of phosphors, each with PL in different portions of the visible spectrum (red, green, blue, and RGB) being stacked or mixed to produce down-converted SSWL. The differing PL efficiencies, quantum defect, and sensitivities to temperature can result in poor color rendering effects which are only amplified under aggressive pumping, i.e., thermal loading [Reference Pust, Schmidt and Schnick1, Reference Fulmek, Sommer, Hartmann, Pachler, Hoschopf, Langer, Nicolics and Wenzl12].
We propose the use of polycrystalline sapphire (alumina), as a host for the Ce atom, because of its superior thermomechanical properties to most host materials will enable similar aggressive optical pumping of LD-pumped broadband phosphors. Alumina is a well-known PL host, especially for transition metal dopants Cr and Ti, which are commercially known as synthetic ruby and Ti:sapphire, arguably the most important gain media [Reference Silfvast19]. Ruby was used to first demonstrate the laser [Reference Maiman20] and Ti:sapphire [Reference Wall and Sanchez21] is still used to produce the shortest temporal optical laser pulses. The crystal field interactions of alumina with each dopant results in starkly different PL properties. Ruby is characterized by dominant monochromatic transitions amenable to high-energy lasing with extremely narrow linewidth (5 Å), and Ti:sapphire possesses an extremely large gain bandwidth (520 nm), which is useful for producing tunable laser sources and/or ultra-short pulses.
The ability to dope Ce into alumina could result in broadband phosphor with properties suitable for high-power/high-brightness SSWL devices. The challenge in achieving such a material is with incorporating adequate quantities of Ce into the alumina matrix to sufficiently down-convert the pumping source. This is because of the ionic radii disparity of rare earths with Al3+ (dopant host site) that leads to an extremely low equilibrium solubility limit of ∼10−3% for the rare earths far below the concentrations used for down-conversion phosphors [Reference Chambers and Clarke22]. Stemming from our earlier advancements in producing bulk ceramic Ce:YAG [Reference Penilla, Kodera and Garay23] and Tb3+- [Reference Penilla, Kodera and Garay24] and Nd3+-doped [Reference Penilla, Devia-Cruz, Duarte, Hardin, Kodera and Garay25] ceramic alumina for high-energy/high-powered solid-state laser gain media, we have produced highly doped bulk polycrystalline Ce:Al2O3, using similar simultaneous solid-state reactive-current activated pressure-assisted densification (CAPAD) processing that permits access to kinetic windows away from equilibrium conditions. This processing has permitted the doping of 0.5 at.% (Ce:Al), a concentration about 500 times above the equilibrium solubility limit for rare earths in alumina.
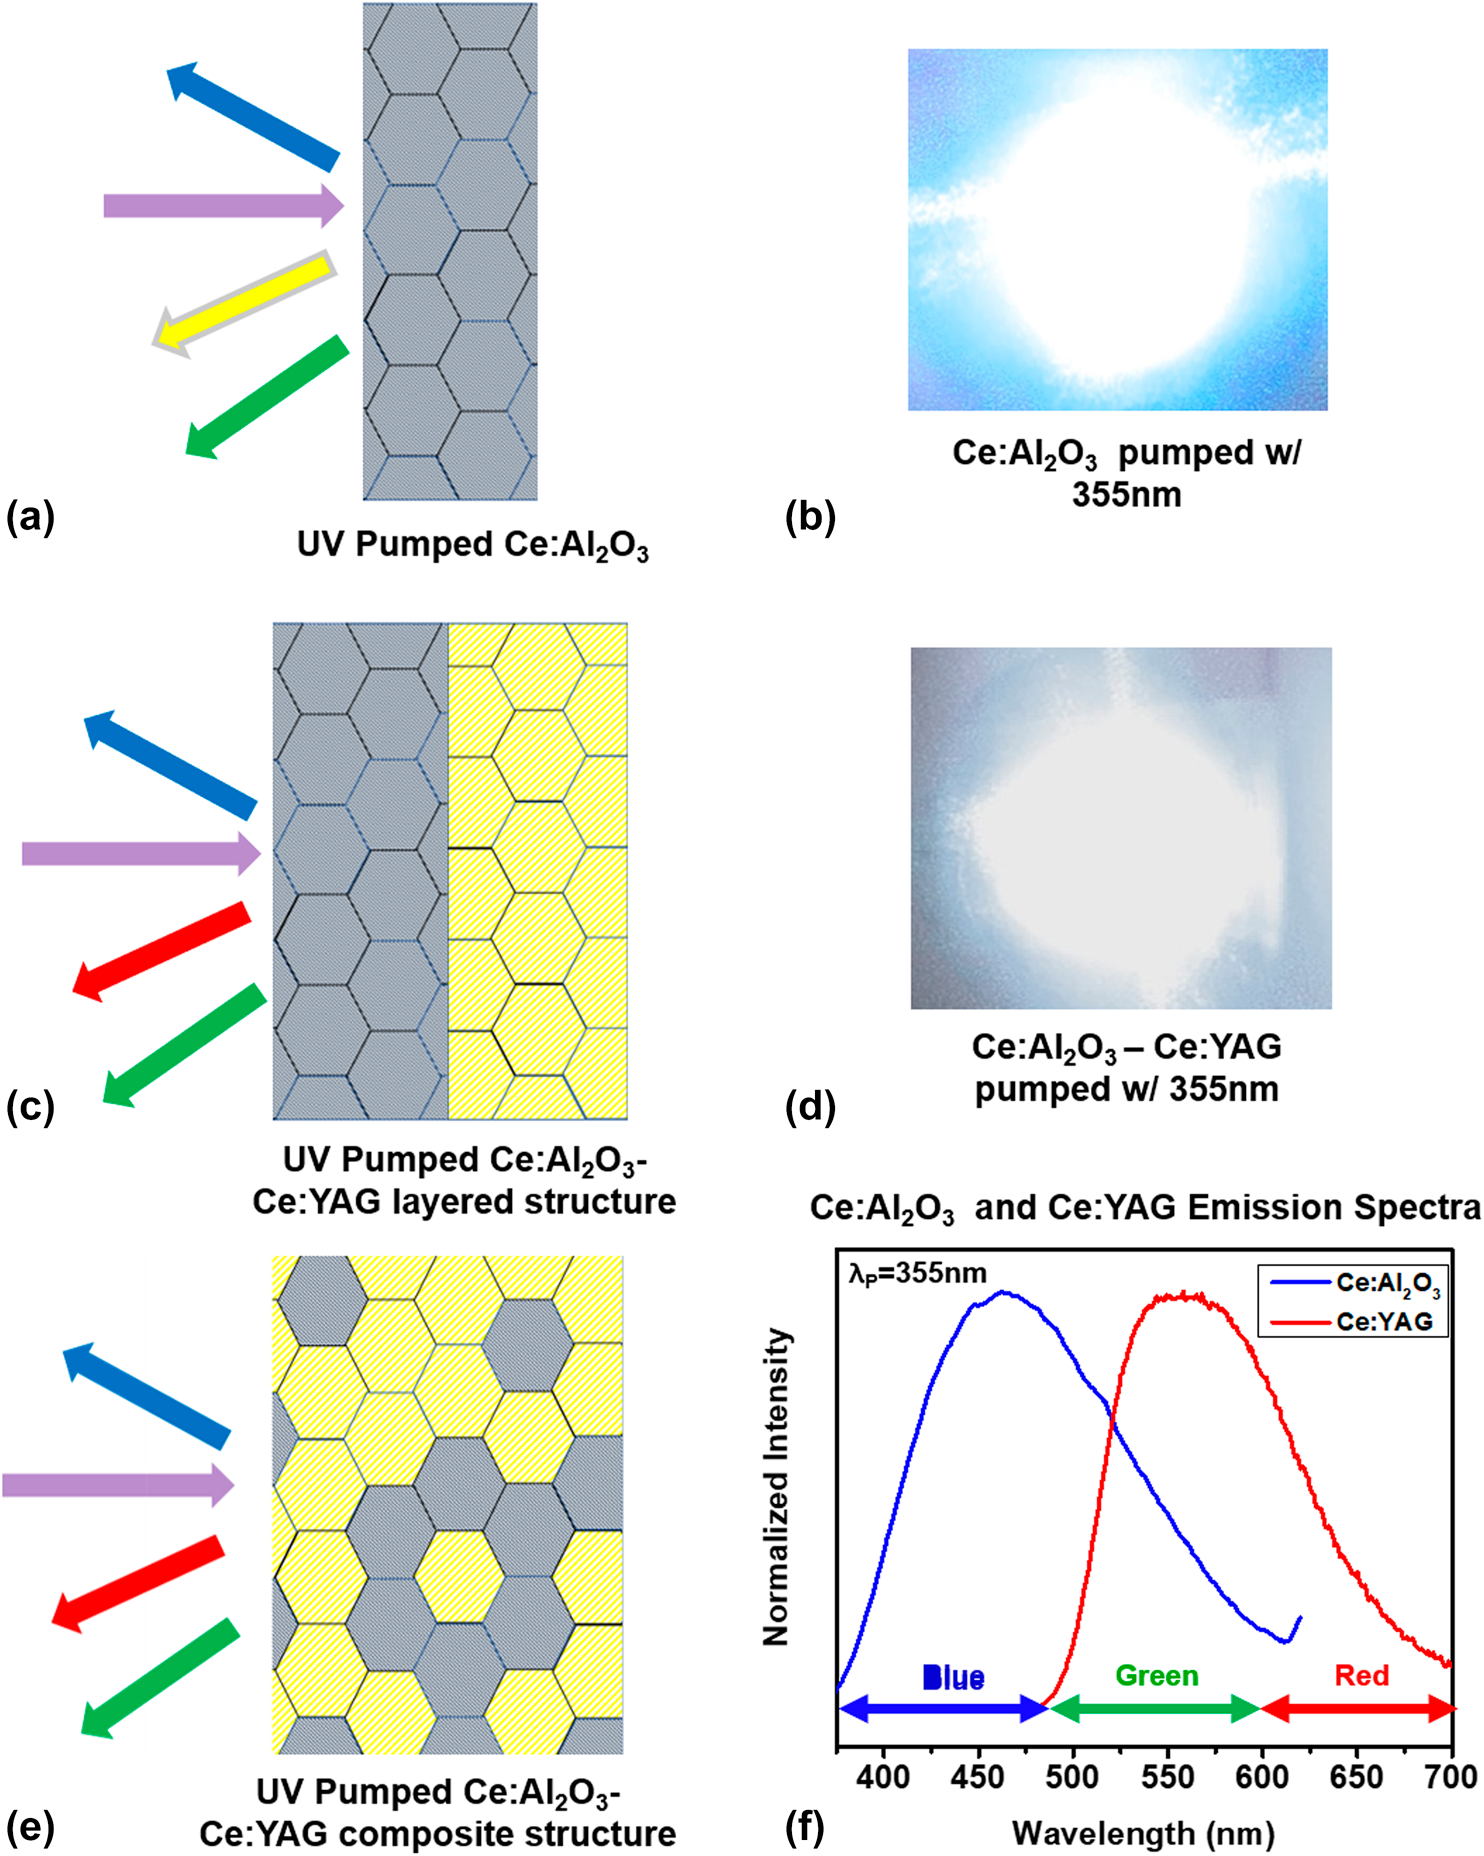
We show that the unique crystal field results in a broadband emission from 400 to 600 nm from the Ce3+ dopant, when it is pumped with UV light at 350 nm, allowing its use as a down-converter. Conveniently, this pumping wavelength is now widely commercially available in UV LED/LD. Conceptually, this is shown in Fig. 1(a), while the PL under UV excitation at 355 nm from a 6-ns laser pumping pulse is shown in Fig. 1(b). The broadband emission that covers the blue and green portions (notice the blue green halo) and extents into the yellow portion of the visible spectrum which results in a near white hue, although it does lack sufficient red contribution required for a true white. To increase red components, Ce:Al2O3 can be used in conjunction with other capping layers that produce red light to produce white light via color mixing and/or with traditional capping layer materials such as Ce:YAG to produce an integrated device with an improved bandwidth in the blue portion of the visible spectrum. This can be accomplished as a layered stack [Fig. 1(c), with resultant PL in Fig. 1(d)] or as a homogenously mixed Al2O3–Ce:YAG/ceramic [Fig. 1(e)] composite similar to that demonstrated by Denault [Reference Denault, Cantore, Nakamura, DenBaars and Seshadri9], Cozzan [Reference Cozzan, Lheureux, Dea, Levin, Graser, Sparks, Nakamura, Denbaars, Weisbuch and Seshadri8] and Wang [Reference Wang, Tang, Zheng, Li, Zhou and Xie11] to make a bulk phosphor with improved thermomechanical properties. In this proposed scenario, the alumina portion would not only serve as a high–thermal conductivity encapsulant but also serve as an active phosphor within the bulk ceramic. The overlap in the respective PL emission line shapes from Ce:Al2O3 and Ce:YAG is appreciated in Fig. 1(f) and should result in similar white light as from the layered structure shown in Fig. 1(d).

Figure 1. (a) Conceptual schematic of Ce:Al2O3 as a stand-alone UV-pumped broadband blue–green phosphor; (b) picture of bulk Ce:Al2O3 emission when pumped with 355 nm laser light; (c) conceptual schematic of Ce:Al2O3/Ce:YAG layered structure for UV laser–pumped SSWL; (d) picture of the resulting emission from the Ce:Al2O3/Ce:YAG layered structure when pumped with 355 nm laser light; (e) conceptual schematic of Ce:Al2O3–Ce:YAG composite based on the design of Denault [Reference Denault, Cantore, Nakamura, DenBaars and Seshadri9], Cozzan [Reference Cozzan, Lheureux, Dea, Levin, Graser, Sparks, Nakamura, Denbaars, Weisbuch and Seshadri8] and Wang [Reference Wang, Tang, Zheng, Li, Zhou and Xie11]; and (f) emission spectra of Ce:Al2O3 and Ce:YAG, showing the overlap in emission that would fully encompass the blue, green, and extend into red.
To understand the crystal field effects in Ce:Al2O3, we have characterized the PL response from 295 to 4 K, revealing the effects of thermal broadening in this crystal system. We have also synthesized Ce:YAG ceramic powders through chemical precursor approach and processed bulk, dense materials using high-pressure, CAPAD route at moderate temperatures to obtain variance in bulk crystallinity, i.e., unique crystal fields. Previous studies by Jayaram et al. in various Al2O3–Y2O3 systems has shown that it is possible to produce bulk, dense, amorphous, partially crystalline and nanocrystalline YAG possible under similar processing temperature and pressure conditions [Reference Sellappan, Jayarem, Chokshi and Davikar26, Reference Thangamari, Gandhi, Jayaram and Chokshi27]. Here, we study the effects of tailored crystallinity on the PL properties of bulk Ce:YAG ceramics. We also have investigated the PL response of these samples in a similar temperature range. The PL characteristics of Ce:Al2O3 and Ce:YAG show opposite trends in PL intensity response as a function of sample temperature; as temperature decreases, the emission intensity of Ce:YAG decreases, whereas Ce:Al2O3 increases. The PL characterization allows us to propose the band diagram for Ce:Al2O3, and the comparison to Ce:YAG indicates that the 5d levels in Ce:Al2O3 likely do not overlap with the conduction band as in the case for Ce:YAG. The increase in the PL intensity at lower temperatures for Ce:Al2O3 is indicative of thermal broadening effects that are observed in rare earth–doped oxide crystals and glasses. The combined thermomechanical and PL properties of Ce:Al2O3 may permit its use in high-powered/high-brightness integrated devices that use high-efficiency LD as efficient pumping sources for the downconversion phosphors.
Results and discussion
Phase, microstructural, and optical analysis of Ce:YAG powders
Thermogravimetric analyses (TGA)/differential thermal analysis (DTA) results showed that loss of volatile matters present in the as-synthesized powders results in significant weight reduction, ∼60 wt%, when the powders are heat-treated at the rate of 30 °C/min over 500 °C [Fig. 2(a)]. After 700 °C, the rate of loss is minimal and with the majority of volatile materials removed. Powder X-ray analysis [Fig. 2(b)] indicates that the Ce:YAG powders prepared by organic/inorganic steric entrapment (the PVA synthesis route) had low crystallinity (remained X-ray amorphous), even after calcining at 800 °C for 30 min. X-ray diffraction (XRD) analysis also indicates the absence of the common perovskite phase, YAP, which is commonly observed during the (pristine or doped) YAG synthesis [Reference Penilla, Kodera and Garay23]. The direct formation of garnet structure from amorphous powder behavior was also observed in coprecipitation of pristine YAG powders [Reference Sellappan, Jayarem, Chokshi and Davikar26]. On further heat treatment above 850 °C, the amorphous powders start crystallizing and completely convert into the desired garnet structure (Ce:YAG) and no remanence of perovskite structure, Y2O3 or Al2O3, can be observed.

Figure 2. (a) DTA and TGA of as-synthesized 3 at.% Ce:YAG powders before calcination, (b) XRD of Ce:YAG powders versus annealing temperature, (c) low-magnification SEM of Ce:YAG powders annealed at 700 °C for 30 min, and (d) high-magnification SEM of Ce:YAG powders annealed at 700 °C for 30 min, showing the typical morphology of these as-synthesized powders.
In the case of Ce:YAG, synthesized through chemical precursor route, offers excellent mixing of the starting precursors and high phase purity of the resultant oxides [Reference Nguyen, Lee and Kriven28]. In addition, with low processing temperature compared with conventional routes, it also results in materials with highly porous nature [Reference Ribero and Kriven29]. The microstructure of the powder can be seen in SEM micrographs of powders calcined at 700 °C for 30 min shown in Figs. 2(c) and 2(d). The fine nanoporous microstructure of the powder is typical to the steric entrapment synthesis method, which facilitates the grinding/milling process [Reference Ribero and Kriven29, Reference Sellappan, Tang, Shi and Garay30]. The finely grounded/milled powders tend to densify because of particle sliding and rearrangement under relatively higher pressure at moderate temperature regimes, which contribute to complete densification of materials without crystallization or partial crystallization [Reference Sellappan, Jayarem, Chokshi and Davikar26, Reference Thangamari, Gandhi, Jayaram and Chokshi27, Reference Sellappan, Tang, Shi and Garay30].
Phase and microstructural analysis of bulk Ce:YAG ceramics
Materials with varying degrees of crystallinity are useful for investigating crystal field effects associated with bulk consolidation. To this aim, the as-synthesized Ce:YAG powders were consolidated with CAPAD at varying temperatures as described in section “Synthesis, processing and densification of Ce:YAG”. Figure 2(a) shows that the powders densified at 500 °C for 15 min under 500 MPa show very low crystallinity. When the consolidation temperature increased to 700 °C, partial crystallization is observed as evidenced by the presence of the YAG phase along with remnant amorphous powders. The XRD pattern of the partially crystallized peaks indicated, crystallization of pure YAG. As previously reported for the coprecipitated pristine YAG powders [Reference Sellappan, Jayarem, Chokshi and Davikar26], in the current study, Ce-doped YAG powders were also consolidated under high pressure at moderately low temperature. To produce a fully dense and also completely crystallized material, the consolidation temperature was increased to 1400 °C, under 100 MPa. Reduction of pressure from 500 to 100 MPa is necessary to avoid deformation of the die materials. Bulk density values measured through the Archimedes method for all the bulk samples are plotted against the processing temperature in Fig. 3(b). The fully crystallized material (1400 °C/100 MPa) is close to 99.1% compared with the theoretical density of pristine YAG. The density plot clearly reveals that the materials fabricated at 500 and 700 °C have a substantial fraction of materials in the amorphous form. SEM images observed at low magnification clearly reveal any form of porosity present in the material and clearly show the ability to consolidate them very well under the chosen experimental conditions [Fig. 3(c)]. However, when the material surface was observed under higher magnification, some pores with a diameter in the order of ∼100 nm are seen [Fig. 3(d)]. We attribute the ability to retain the amorphous structure while achieving the densification of particles into the bulk form to the optimized processing conditions, especially to the low calcination and also the densification temperature. In addition, by achieving the amorphous material in the bulk, dense form, we were also able to achieve partially crystalline and fully crystalline 3 at.% Ce:YAG.

Figure 3. (a) XRD of bulk Ce:YAG ceramics for different CAPAD processing conditions, (b) plot of the relative density versus CAPAD processing temperature for Ce:YAG, with the green line depicting the bulk theoretical density, (c) low-magnification SEM of the bulk Ce:YAG produced at 500 °C and 500 MPa, showing lack of porosity although the bulk density is significantly lower than that of fully crystalline Ce:YAG, and (d) high magnification of the bulk Ce:YAG produced at 500 °C and 500 MPa, showing the presence of a small amount of pores of ∼100 nm diameter within the bulk ceramic.
Phase and microstructural analysis of Ce:Al2O3
In Fig. 4(a), the effect of CAPAD-processing temperature on a relative density of 0.5 at.% Ce:Al2O3 ceramics is plotted. We observe the classic sigmoidal behavior with a densification onset temperature of ∼1150 °C, and the relative density nears the theoretical limit (>99%) at processing temperatures above 1250 °C with a 5-min isotherm under 105 MPa. The transparency of the sample produced at 1250 °C can be appreciated in the photo included as an inset in Fig. 4(a). Under these processing conditions, the Ce:Al2O3 specimen has an average grain size of ∼300 nm [Fig. 4(b)] and is pure phase as determined by XRD of the bulk ceramics [Fig. 4(c)], when compared with the Al2O3 diffraction pattern standard (ICSD# 63647). The transparency can be appreciated in Fig. 4(d), where the real in-line transmission is plotted as a function of wavelength from the UV through the mid-IR. In addition, we present an optical micrograph of a polished transparent ceramic placed atop the black text as an inset that qualitatively depicts the high transparency of the bulk ceramic sample. The transparency is attributed not only to the elimination of residual porosity but to the phase purity and fine average grain size, as scattering due to refractive index mismatch at pores and grain boundaries are minimized. These results are in agreement with our previous reports on the production of laser-grade ceramic ruby [Reference Penilla, Hardin, Kodera, Basun, Evans and Garay31] and Tb:Al2O3 [Reference Penilla, Kodera and Garay24] and Nd:Al2O3 [Reference Penilla, Devia-Cruz, Duarte, Hardin, Kodera and Garay25], all of which were produced from similar powders and CAPAD processing conditions. However, in contrast to our observations in the Nd:Al2O3 system, we do not observe a systemic stretching of the matrix lattice in the Ce:Al2O3 system, and this may merit further investigation and is currently outside of the scope of this study.

Figure 4. (a) Plot of the relative density versus CAPAD processing temperature for Ce:Al2O3, (b) SEM of polished and thermally etched bulk Ce:Al2O3 processed at 1250 °C, (c) XRD of bulk Ce:Al2O3 compared with the diffraction pattern for pure α-Al2O3 (ICSD#: 63647), and (d) picture of a Ce:Al2O3 ceramic taken atop a text, showing the sample transparency.
In addition to influencing the grain boundary scattering, small average grain sizes permit the over equilibrium incorporation of Ce within the Al2O3 matrix, which leads to optical activity from the Ce ion, with the latter being discussed in section “PL properties of Ce:YAG and Ce:Al2O3”. The small grain size results in an increased grain boundary volume, resulting in space for the dopants to distribute, permitting the matrix to accommodate higher dopant concentrations with an increased average distance between Ce ions, avoiding concentration quenching effects. For alumina, the critical grain size needed to fully accommodate dopant concentrations required for PL applications (c vol ∼ 1020 ions/cm3), with an optimal interionic distance, to avoid PL quenching is ∼25 nm. Currently, the production of such microstructures is not experimentally possible, with the final grain size at full density being a limiting factor. (For a detailed discussion about the grain boundary volume and volumetric dopant concentrations, refer to our recent communication [Reference Penilla, Devia-Cruz, Duarte, Hardin, Kodera and Garay25].) As the actual grain size of Ce:Al2O3 is ∼300 nm, the accommodation of optically active dopants along grain boundaries is not possible in these materials, indicating that the microstructure cannot fully explain the presence of PL active Ce within the bulk matrix. Fortunately, this requirement is somewhat relaxed as the applied CAPAD processing conditions are kinetically favorable (high heating and cooling rates) to result in a quenched microstructure with rare earth present within grain interiors [Reference Penilla, Kodera and Garay23, Reference Penilla, Kodera and Garay24, Reference Penilla, Devia-Cruz, Duarte, Hardin, Kodera and Garay25]. In this case, the dopant concentration is ∼500 times above the solubility limit, i.e., at volumetric concentrations similar to a common Ce-dopant concentration in Ce:YAG phosphors [Reference Zhou, Luo, Liu, Gu, Lu, Zhang, Fan, Jiang and Wang6, Reference Penilla, Devia-Cruz, Duarte, Hardin, Kodera and Garay25].
PL properties of Ce:YAG and Ce:Al2O3
Figure 5(a) plots the PL excitation and emission scans for 3 at.% Ce:YAG powders as a function of calcination temperature over which the powders transition from fully amorphous to fully crystalline. This dopant concentration is chosen as the PL intensity is sufficient to produce adequate down-conversion while avoiding detrimental concentration quenching. These effects have been investigated by a number of independent researchers, including our previous work on bulk Ce:YAG ceramics, which showed that an optimal Ce-dopant concentration range is on the order of 3–4 at.% [Reference Penilla, Kodera and Garay23, Reference Purwanto, Wang, Ogi, Lenggoro, Tanabe and Okuyama32].
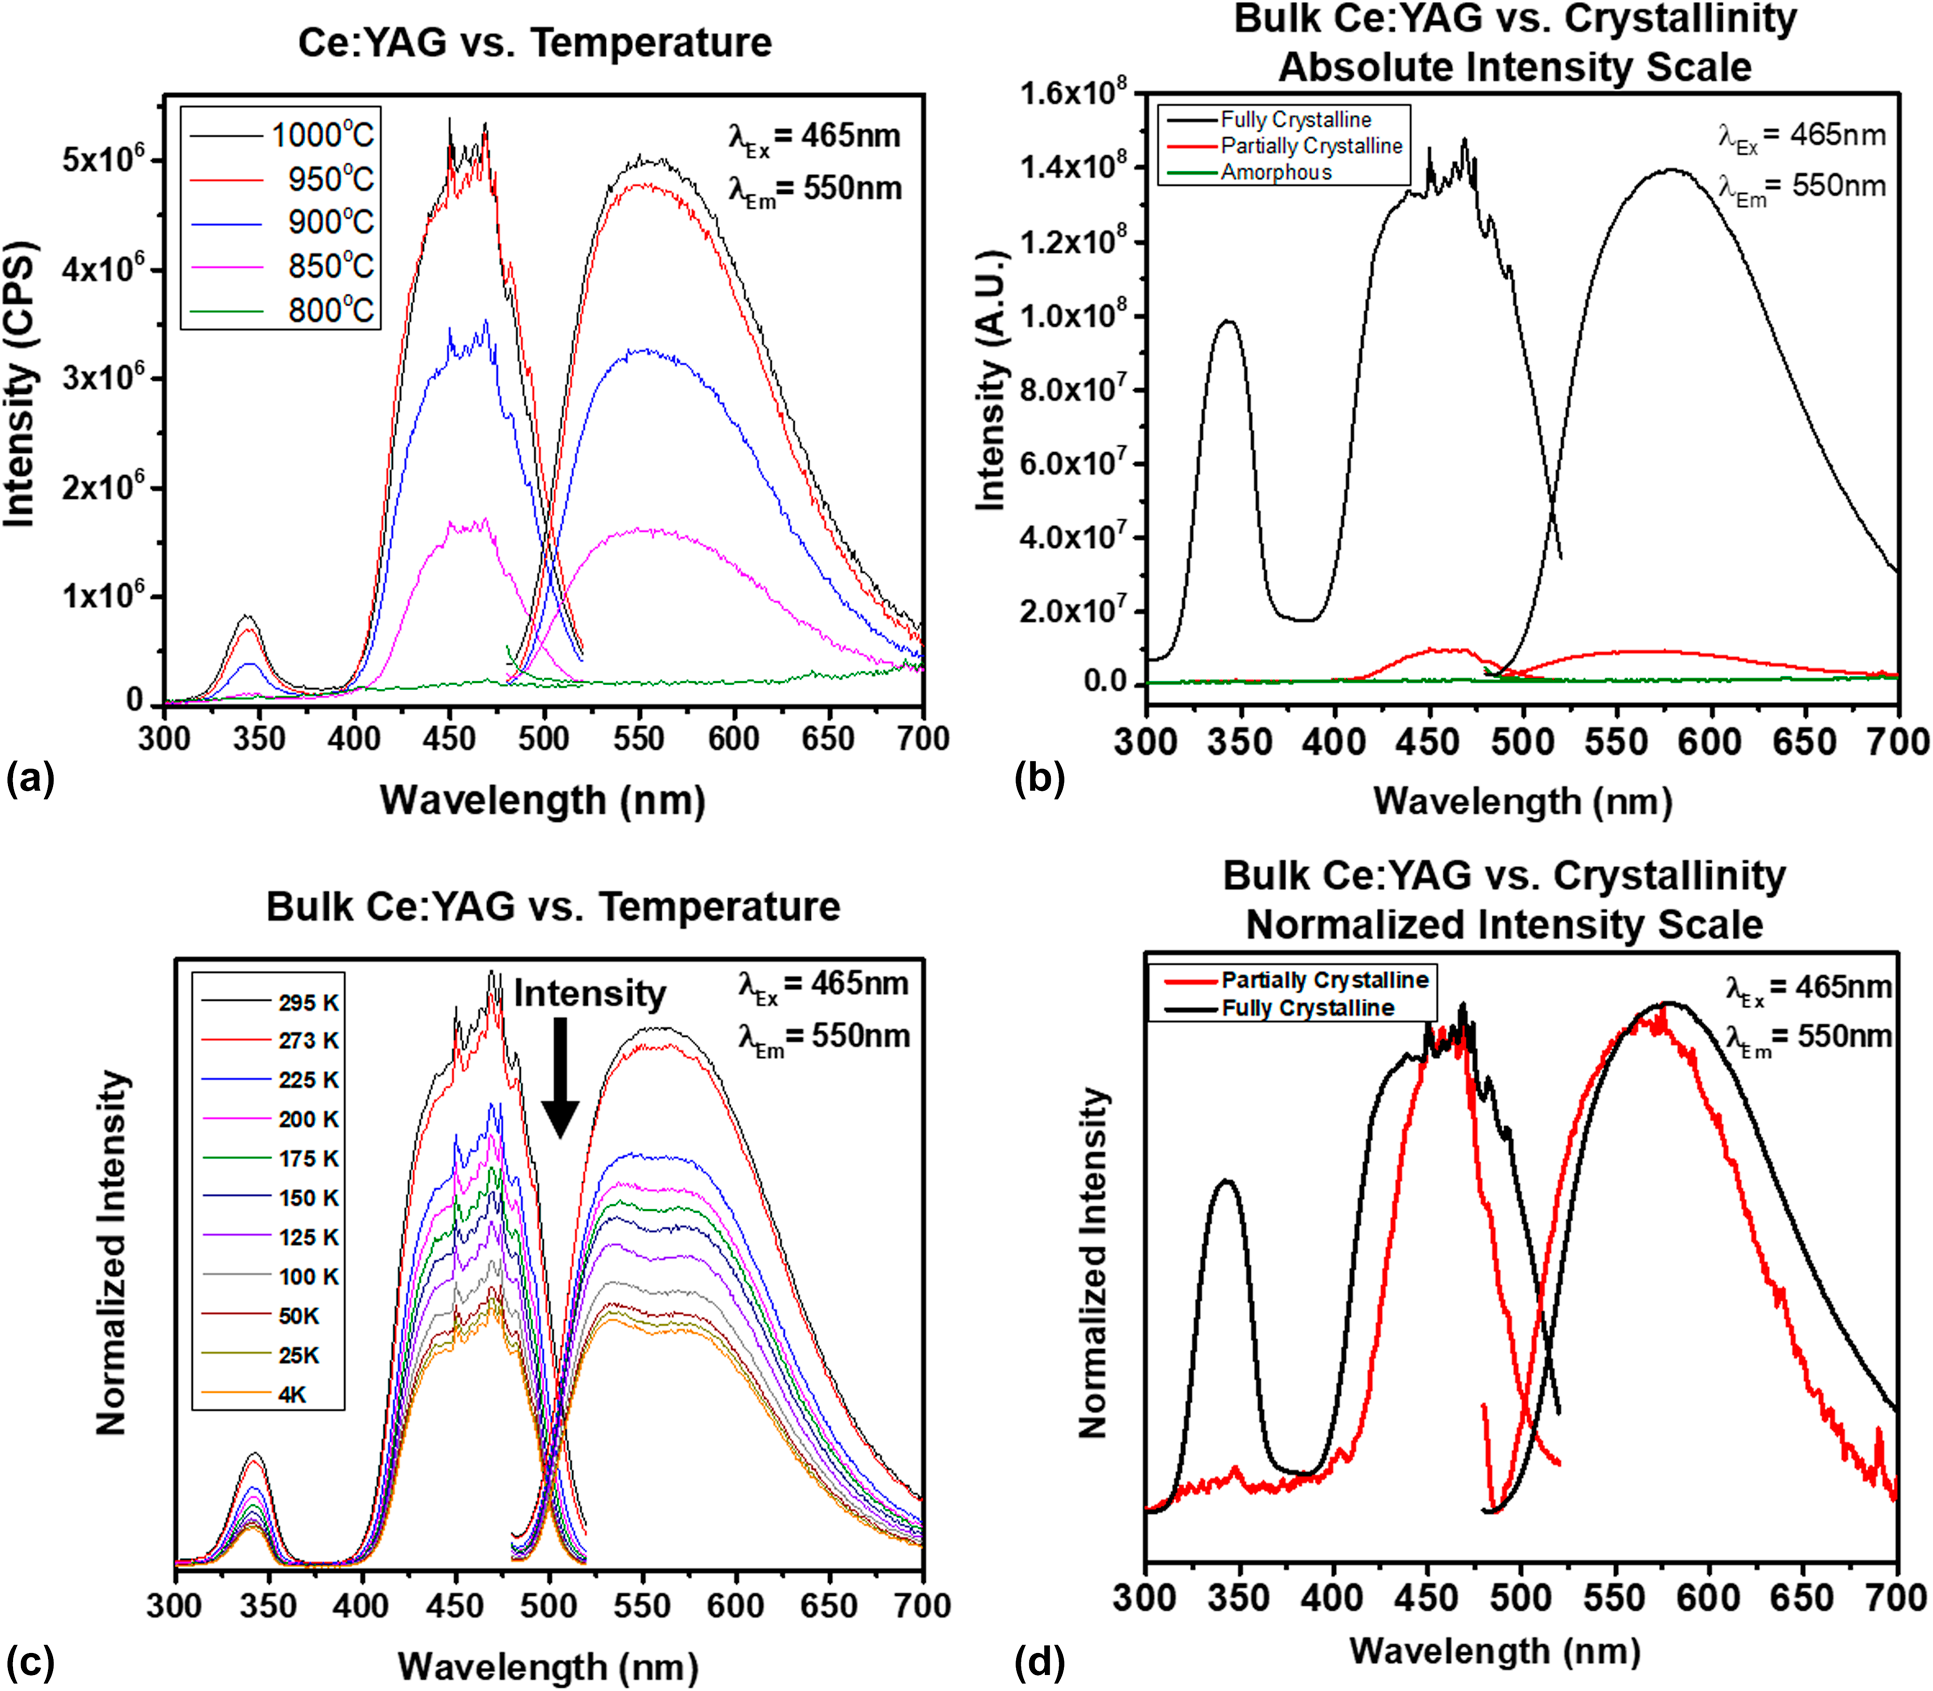
Figure 5. (a) PL excitation and emission spectra of 3 at.% Ce:YAG powders annealed at different temperatures, (b) absolute intensity PL excitation and emission spectra of bulk amorphous and partially and fully crystalline 3 at.% Ce:YAG ceramics, (c) PL excitation and emission spectra of bulk crystalline Ce:YAG from room to cryogenic temperatures, (d) normalized intensity PL excitation and emission spectra of bulk, partially, and fully crystalline 3 at.% Ce:YAG.
The excitation scans show the classic absorption bands associated with the 5d ← 4f transitions, with the 4f–5d 2 centered at 330 nm and the 4f–5d 1 centered at 465 nm, consistent with our previous work in solid-state reacted Ce:YAG [Reference Penilla, Kodera and Garay23]. In addition, the PL measurements show that the absolute intensity of the excitation and emission spectra monotonically increase with the degree of crystallization, with no optical activity being present in the fully amorphous powders that were calcined at 800 °C. These results indicate that it is the interaction of the Ce atom with the ordered structure of the YAG lattice that results in optical activity and are consistent with previous studies of Ce:YAG powders produced through other routes [Reference He, Liu, Li, Yang, Yu, Zeng and Yu33].
Pumping Ce:YAG with wavelengths accessing the absorption bands yields the broadband luminescence from ∼500 to 650 nm with its peak at approximately 530 nm, which arises from the 5d band splitting into 5 levels and relaxing to the doubly degenerate 4f ground state [Reference Tomiki, Akamine, Gushiken, Kinjoh, Miyazato, Miyazato, Toyokawa, Hiraoka, Hirata, Ganaha and Futemma34]. However, because powders cannot be readily characterized at cryogenic temperatures, we were not able to resolve the splitting of the 4f ground state. The emission scans were taken with pumping at 465 nm, the most efficient pumping wavelength and the typical pumping wavelength that is used to produce white light from Ce:YAG via color mixing. Because Ce:YAG does not have emission in the blue portion of the spectrum (<500 nm), engineers typically adjust the thickness of the phosphor capping layer to permit some “bleed-through” of the blue pumping source, which tends to have a rather narrow FWHM of ∼5–10 nm. To improve the color rendering, a contribution from an additional phosphor capping layer [e.g., Ce:Al2O3, Figs. 1(b) and 1(c), and discussion in the following paragraphs] with a broader FWHM in the blue portion of the spectrum, a larger can be incorporated within an SSWL device. In the Ce:YAG/Ce:Al2O3 case, pumping can be carried out with a single UV LED because the absorption bands overlap.
We also report a similar trend in bulk Ce:YAG materials that are fully dense yet possess differing degrees of crystallization as described in section “Phase and microstructural analysis of bulk Ce:YAG ceramics”. Figure 5(b) shows the room temperature excitation and emission PL spectra for three samples: a fully amorphous sample, a partially crystalline/amorphous sample, and a fully crystalline sample. These results reveal the high dependence of the optical activity to the structure of the host; the ceramic with a nearly amorphous structure shows no optical luminescence activity, whereas those samples with crystalline Ce:YAG present show optical response. Similar to the powder samples, the absolute intensity increases with the increased volumetric proportion of crystallinity phase present. The line shape and intensity of the excitation and emission scans of the fully crystalline material are also consistent with previous reports on the transitions of Ce3+ in YAG [Reference Penilla, Kodera and Garay23, Reference Tomiki, Akamine, Gushiken, Kinjoh, Miyazato, Miyazato, Toyokawa, Hiraoka, Hirata, Ganaha and Futemma34, Reference Hamilton, Gayen, Pogatshnik, Ghen and Miniscalco35, Reference Zych, Brecher and Glodo36, Reference Nair and Dhoble37].
In addition to room temperature PL spectroscopy, the bulk nature of the sample permitted spectroscopic characterization across the temperature range from 298 to 4 K, which is plotted in Fig. 5(c). By subjecting the samples to low temperatures, the thermal effects of the host on the Ce ions can be mitigated and the line broadening and splitting of the 4f ground states can be observed. Following the methodology of Nair [Reference Nair and Dhoble37], we were able to deconvolute the excitation and emission spectra for the bulk sample and confirm the energy gaps for the 4f–5d 2 and 4f–5d 1 transitions, as well as the splitting of the 4f states. These measurements are in line with the energy diagram for Ce:YAG, reconstructed herein in Fig. 7(a), with data from the previous reports by Tomiki [Reference Tomiki, Akamine, Gushiken, Kinjoh, Miyazato, Miyazato, Toyokawa, Hiraoka, Hirata, Ganaha and Futemma34], Hamilton [Reference Hamilton, Gayen, Pogatshnik, Ghen and Miniscalco35], and Zych [Reference Zych, Brecher and Glodo36], including the location of the zero-phonon line, i.e., the intersection of the excitation and emission spectra, which is measured here at room temperature as ∼515 nm and at 4 K to be blue-shifted to ∼500 nm. Because the lower 4f state is nearly depopulated at room temperature, it is likely that at cryogenic temperatures, the splitting is thermally mitigated, resulting in a lesser contribution toward the red portion of the spectrum. Here, however, the spectroscopic techniques do not permit the observation of the higher energy 5d states, which require more sophisticated excited-state absorption and photoconductivity measurement methods [Reference Hamilton, Gayen, Pogatshnik, Ghen and Miniscalco35, Reference Zych, Brecher and Glodo36]. Our methods do permit the measurement of the excitation and emission spectra to temperatures below 60 K, which were omitted in the work of Zych because the sensitivity of the detector was unable to resolve any PL signature at lower temperatures.
In addition, we observe that the intensity of the PL spectra decreases at low temperatures, which is not the typical behavior for rare earths, as reduction in temperature usually results in line thinning and accompanied by an increased PL intensity [Reference Silfvast19, Reference Zych, Brecher and Glodo36]. The atypical behavior has been ascribed to the interaction of lattice traps with the electrons that are brought to the higher energy 5d energy states of the Ce dopant that overlap with the conduction band as shown in Fig. 7(a). At low temperatures, the traps have more time to interact with the free electrons in the conduction band, offering a nonradiative pathway to relaxation, resulting in decreased PL intensity [Reference Zych, Brecher and Glodo36]. This effect is reduced with increased temperature, thereby reducing nonradiative decays that result in an increase in the PL intensity.
The partially crystalline sample, however, does show interesting behavior in the line shape and the position of the zero-phonon line. Figure 5(d) plots the PL spectra of the two Ce:YAG samples that have on a normalized scale, which allows easier comparison of the line shape characteristics. The excitation scan of the partially crystalline samples reveals the absence of the 4f–5d 2 band centered at 330 nm, as well as a narrowed FWHM of the 4f–5d 1 band centered at 465 nm, from ∼93 to ∼58 nm. This behavior indicates that although XRD does not show any shifts in the peak position of the YAG peaks, the symmetry of the crystalline phase has not yet fully approached the D2 symmetry, which causes the 5d states to split into five components [Reference Tomiki, Akamine, Gushiken, Kinjoh, Miyazato, Miyazato, Toyokawa, Hiraoka, Hirata, Ganaha and Futemma34]. Consequently, the resultant emission is also narrowed from ∼105 to 67 nm as the higher energy 5d states are not present to present optical absorption and branch to the 4f ground state on relaxation. The lack of emission toward the red suggests that the ground state has not fully split and the shift in the position of the zero-phonon line from ∼515 to ∼497 nm is evidence that the energy difference between 5d 1 and 4f 1 is smaller than in fully crystalline Ce:YAG by as much as 0.1 eV, which is consistent with a crystal field interaction similar to what is observed in the fully crystalline sample at cryogenic temperatures.
As a side note, in this sample, a small emission peak corresponding to the R-lines for ruby (Cr:Al2O3) at 693 nm is clearly discerned. This is likely as Cr is present as a minor impurity within the aluminum nitrate salts used for synthesis. Although the XRD does not show the presence of the secondary phase, the PL characterization is, thus, sensitive enough to discern intermediary stages of crystallization to YAG. The ruby R-line luminescence is not present in the fully crystalline ceramics as alumina is no longer present at this stage because it is consumed to produce YAG. This is a plausible scenario, as the phase detention limit is on the order of 1–5%, in which extremely low (ppm) amounts of active ions can be detected using modern photo multiplication equipment and techniques. These measurements show the benefit of corroborating phase identification measurements with supporting characterization such as PL instead of fully relying on standard XRD techniques for phase identification throughout processing as is often done.
In a similar manner, we have characterized the PL excitation and emission spectra for Ce:Al2O3 from room to cryogenic temperatures. We observe that the PL intensity of Ce:Al2O3 increases at low temperatures [Fig. 6(a)], which is in stark contrast to the classic phosphor down-convertors such as Ce3+:YAG. Figure 6(b) plots the peak intensity over the temperature range for the normalized excitation and emission scans of Ce:Al2O3. Comparison of Figs. 6(a) and 6(b) allows one to clearly see the differences in the trends between the two material systems. The peak PL intensity for Ce:Al2O3 increases by a factor of ∼1.8, whereas it decreases to about 30% of the room temperature value for Ce:YAG. Using the same fitting approach described earlier on the spectra collected at 4 K, we were able to determine the location of the 5d 1–5d 4 states [Fig. 6(c)] and were also able to resolve the crystal-field splitting of the ground state [4f 1 and 4f 2, Fig. 6(d)] to be ∼0.36 eV, slightly larger than in Ce:YAG. We assume that the 5d 5 state requires higher energy (lower wavelengths) to access than UV–visible pumping as is the case for Ce:YAG.

Figure 6. (a) PL excitation and emission spectra of bulk crystalline Ce:Al2O3 from room to cryogenic temperatures, (b) plot of the peak normalized intensity from room to cryogenic temperatures for Ce:YAG and Ce:Al2O3, (c) PL excitation spectra of Ce:Al2O3 collected at 4 K, with a cumulative fit of the 5d states superimposed on the experimental data, and (d) PL emission spectra of Ce:Al2O3 collected at 4 K, with a cumulative fit of the 5d-states superimposed on the experimental data.
The spectra also show evidence of line thinning, particularly in the excitation spectra, as 5d 4 at ∼300 nm is favored at lower temperatures, whereas some of the structures pertaining to the lower 5d states are observable at room temperature. The behavior of Ce:Al2O3 is consistent with the low-temperature optical behavior of other rare earths doped into oxides, such as Nd- [Reference Ter-Gabrielyan, Dubinskii, Newburgh, Michael and Merkle38, Reference Ter-Gabrielyan, Dubinskii, Newburgh, Michael and Merkle39] and Er-doped [Reference Penilla, Hardin, Kodera, Basun, Evans and Garay31] YAG, that exhibit optical 4f to 4f transitions that are shielded from crystal-field interactions by the outer 5d shell. The low-temperature behavior of Ce:Al2O3 indicates that the position of the 5d ← 4f optical transitions are located below the conduction band, which allows us to propose the simplified energy band diagram for Ce in Al2O3 in Fig. 7(b). These measurements do not allow for the determination of the exact position of the ground state in relation to the conduction and valence bands. Precise locations could be determined using low-temperature transmission measurements of these materials, which is currently unavailable in our experimental setup. As such, we must leave the precise location of the 4f ground state in relation to the valence band as an open question for a subsequent communication.
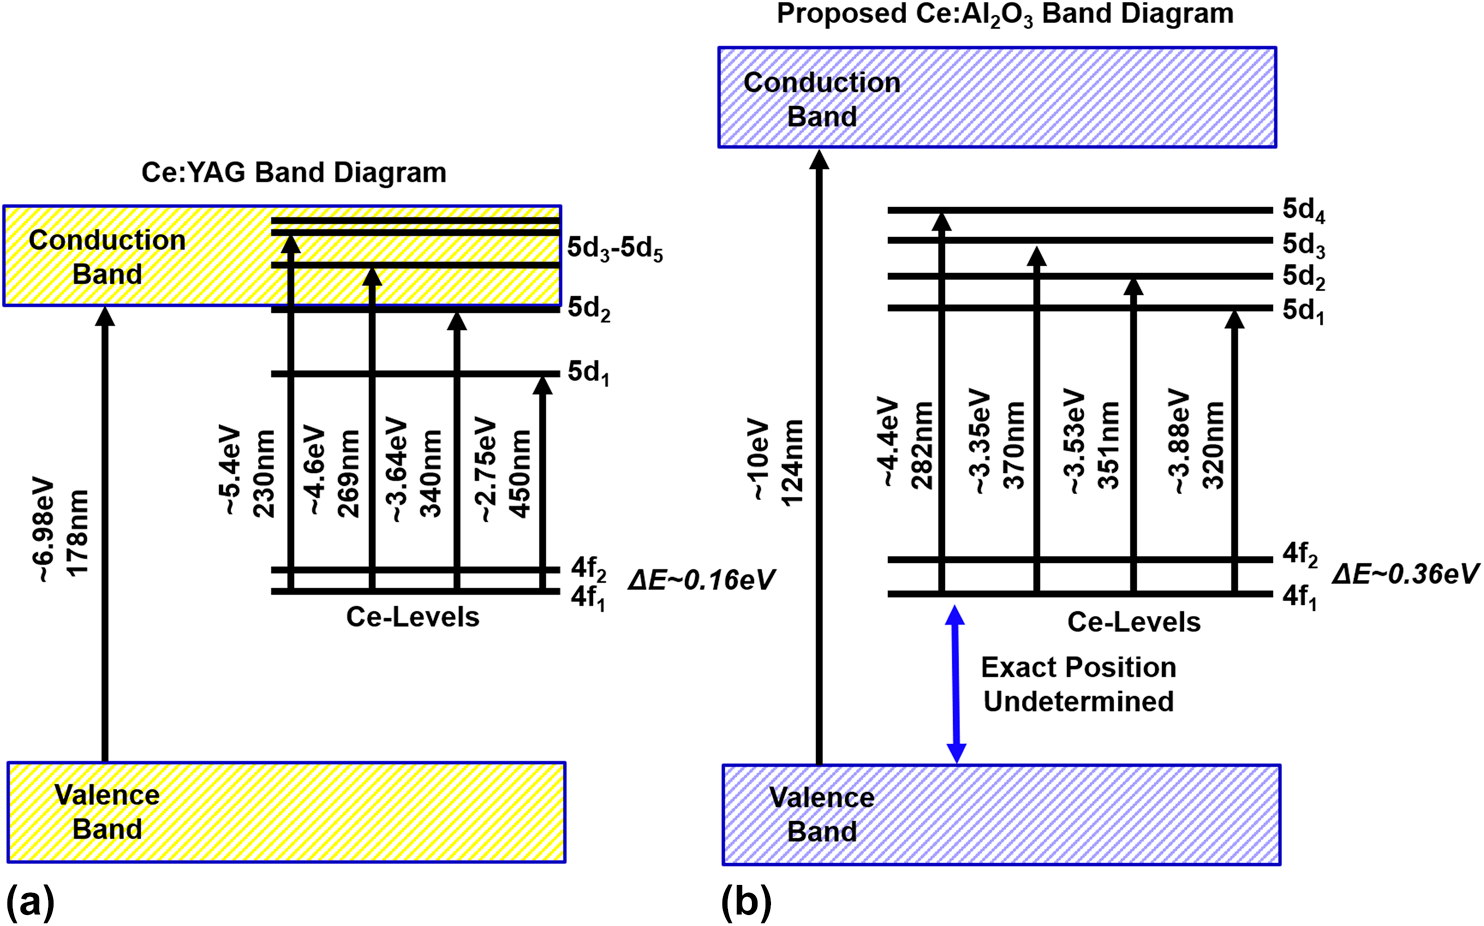
Figure 7. (a) Ce:YAG band diagram as previously suggested using data from Tomiki [Reference Tomiki, Akamine, Gushiken, Kinjoh, Miyazato, Miyazato, Toyokawa, Hiraoka, Hirata, Ganaha and Futemma34], Hamilton [Reference Hamilton, Gayen, Pogatshnik, Ghen and Miniscalco35], and Zych [Reference Zych, Brecher and Glodo36] and (b) proposed simplified band diagram for Ce:Al2O3.
Summary
Bulk 0.5 at.% Ce:Al2O3 ceramic phosphors were fabricated with a simultaneous solid-state reaction-densification route via CAPAD. The highly doped Ce:Al2O3 phosphors have a broadband emission in the blue/green portion of the optical spectrum from 400 to 600 nm when pumped with UV light. In addition, Ce:YAG powders and bulk Ce:YAG ceramics were fabricated with controlled crystallinity. The PL spectra were characterized and compared with Ce:Al2O3 from 298 to 4 K, revealing that the different crystal fields result in different absorption and emission. Using these characterization tools, we are able to propose the energy differences between the 5d and 4f states of Ce in Al2O3, and the increased PL intensity over the same temperature range indicates that the observed 5d states likely do not overlap with the conduction band as has been observed in Ce:YAG. Instead Ce:Al2O3 behaves similar to other rare earths, with an observed line thinning, an increase in spectral intensity at lower temperatures, indicative of quenching of thermally induced broadening. The over equilibrium–doped phosphors bring wide-band PL from the Ce3+ active ion transitions to a matrix with higher thermal conductivity and thermal shock resistance. Ce:Al2O3 can be used with other broadband phosphors such as Ce:YAG as an active encapsulant or as an additional capping layer to produce LD-pumped high-brightness/high-power SSWL devices, with improved thermomechanical performance that does not rely on LED pumping, which suffers from efficiency droop.
Methodology
Synthesis, processing, and densification of Ce:Al2O3
Before reaction-densification, ultra-high purity α-Al2O3 submicron powder (99.99% purity, Taimei Chemical, Japan) and CeO2 nanopowder (99.97% purity, Sigma-Aldrich, USA) were weighed and mixed to achieve a Ce:Al ratio of 0.5%. After mixing in a mortar, the powders were suspended in ultra-high purity water (UHP, 99.99% purity) and tumble milled at ∼50 RPM using 3-mm-diameter, α-Al2O3 spherical media (99.99% purity, Taimei Chemical, Japan). The mixed powders were sieved and dried at 70 °C under 30 mmHg vacuum. Following vacuum drying, 3.000 ± 0.0001 g of the powders were suspended in 30 mL of UHP water and planetary ball milled at 150 RPM for 3 and 6 h using 30 g of 3-mm-diameter media. The powders were sieved and dried in air at 120 °C for 12 h and kept dry until consolidation.
The bulk ceramic Ce:Al2O3 phosphors were produced using an all-solid-state, one-step reaction-densification route using CAPAD [Reference Penilla, Kodera and Garay23, Reference Penilla, Hardin, Kodera, Basun, Evans and Garay31]. 1.500 ± 0.0001 g of powder was secured within graphite tooling to produce fully dense bulk disk-shaped specimens with 19 mm diameter. The ceramic specimens were processed at various temperatures with a heating rate of ∼300 °C/min and a 5-min isothermal treatment. In conjunction with the thermal cycle, the powders were uniaxially pressurized to 105 MPa with a 35.33-MPa/min pressure ramp. The ultimate uniaxial pressure was released at the end of the isothermal treatment.
Synthesis, processing, and densification of Ce:YAG
The 3 at.% Ce:YAG (Y2.97Ce0.03Al5O12) powders used in this study were synthesized through a solution polymerization–based route, organic/inorganic steric entrapment method [Reference Nguyen, Lee and Kriven28, Reference Ribero and Kriven29, Reference Sellappan, Tang, Shi and Garay30]. High-purity yttrium(III) nitrate hexahydrate, aluminum nitrate nonahydrate, and cerium(III) nitrate hexahydrate (Alfa Aesar, Ward Hill, MA, USA) were the precursor sources of the cations. The single-pot synthesis route began with preparing polymeric solution containing 5 wt% of 80% hydrolyzed polyvinyl alcohol (PVA, Sigma-Aldrich, St. Louis, MO, USA) dissolved in deionized water by stirring for 24 h at room temperature. Stoichiometric amounts of Y(NO3)3·6H2O, Al(NO3)3·9H2O, and Ce(NO3)3·6H2O were mixed together, following the stoichiometry Y2.97Ce0.03Al5O12, and stirred with PVA solution. This solution was stirred for an additional 12 h. The PVA fraction in solution with the nitrates was chosen so that there were 4 times more positively charged valences from the cations than negatively charged functional end groups of the organics (in the case of PVA, –OH groups) [Reference Ribero and Kriven29]. This strategy ensures that there are more cations in the solution than hydroxyl functional groups of the polymer, with which they could chemically bond. The precursor solutions were then heated on a hot plate with continuous stirring (350 °C, 300 RPM) until water evaporates, resulting in a thick yellow gel. The aerated gel formed was then vacuum dried at 70 °C under −850 millibar for 24 h. The vacuum drying process resulted in a yellowish dried crisp foam which was first ground using an agate mortar and pestle. The ground powders were heat treated at various temperatures for 30 min to investigate the phase evolution behavior. To fabricate bulk specimens, as-synthesized powders were calcined at 700 °C for 30 min, which results in pale yellowish powders. The calcined powders were then planetary ball milled (equipment details and also 300 RPM) for 6 h using 10-mm silicon nitride (Si3N4) milling media with deionized water to reduce the particle size and to increase the specific surface area. The milling media were then drained, and the solution was centrifuged at 3300 RPM for 10 min, then dried at ∼70 °C for 24 h using a vacuum drying oven under −850 millibar. The dried granules were ground in a mortar and stored dry until CAPAD processing.
These amorphous powders were consolidated using low temperature and high pressures with custom-built CAPAD apparatus to obtain materials with varying crystallinity. The high heating rates (∼300 °C/min) associated with CAPAD allow control over the total processing times, which is in conjunction with the high applied pressures (∼500 MPa), and allow the fabrication of fully dense ceramics with control in the ultimate crystallinity. 0.25 g of powders were packed into 10-mm-diameter WC–Co die, initially prepressed under 500 MPa for 2 min, and the pressure was completely removed before starting the experiment. Pressure was increased to ∼70 MPa/min, and the die setup was heated at the rate of ∼300 °C/min. A fully dense fully crystalline Ce:YAG sample was produced, also via CAPAD, but under conventional processing conditions of 1400 °C and 100 MPa within graphite tooling, with all other parameters unchanged. This was carried out because the WC–Co tooling is not suitable for operation above ∼1000 °C, which yielded only partially crystalline ceramics (not presented herein).
Material characterization
DTA and thermogravimetric analyses (TGA) (SDT Q600-TA Instruments, New Castle, DE) at 30 °C/min were performed on the as-synthesized powders to study the precursor-to-ceramic powder conversion and phase formation. XRD using Cu Kα1 (λ = 1.54058 Å) radiation was implemented on a Phillips X'Pert diffractometer (Model DY1145), in point source mode, with a 45 kV potential, 40 mA current, a 0.002 step-size, and 2 s integration time, from 2θ = 15–60°. The collected XRD spectra were compared with published standards for α-Al2O3 (ICSD#: 63647) and YAG (ICSD#: 23848).
The bulk density of the bulk specimens was measured by Archimedes' method using deionized water at room temperature. A low-speed saw was used to section the densified specimen using a diamond-tipped saw, and cross-sectioned regions were grounded using diamond-impregnated grit disks for microstructural investigations. Scanning electron microscopic (SEM; Zeiss Sigma 500) analyses were performed on the surfaces of the specimens that were polished with diamond lapping (grit ∼ 0.1 μm), as well as the powders, and no conductive layer was applied before observation.
Room temperature and cryogenic photoluminescence characterization
Photoluminescence (PL) excitation and emission spectra were measured on a custom-built spectrofluorometer based on Horiba-PTI model 3558, using a tungsten deuterium lamp with monochromators as an excitation source. The spectroflourometer was coupled to an Advanced Research Systems closed-cycle helium cryostat (ARS-2HW) using a conductive cold finger within a windowed housing that enabled measurements from 4 to 295 K. All measurements were performed at 45° angle of incidence (AOI) on polished bulk ceramics, and the PL spectra were collected from the specimen front face. Excitation spectra were collected between λ = 250 nm and λ = 420 nm, while monitoring the peak emission intensity near λ = 465 nm. Emission spectra were collected between λ = 350 nm and λ = 610 nm, while monitoring the peak emission intensity near λ = 330 nm. In all cases, the excitation and emission monochromators were adjusted to achieve a spectral bandwidth of 1 nm. The step size was 1 nm, while the intensity was integrated for 1 s. Three excitation and emission spectra were collected and averaged.
Acknowledgments
We gratefully acknowledge the funding of this work by a multidisciplinary research initiative (MRI) from the High Energy Lasers—Joint Technology Office (HEL-JTO) and the Office of Naval Research (ONR). Some of the characterization work was enabled by ACIF grant NSF CHE-9974924.


 Open access