


There are over 10·2 million persons held in prisons and detention centres worldwide( Reference Walmsley 1 ), and although there is variation in incarceration rate between countries, Australia is just below the world average of 144/100 000 population( Reference Walmsley 1 ). In Australia, the current aggregate sentence length is 4·7 years( 2 ), and with nearly 60 % of all prisoners having a previous imprisonment( 2 ), the prison diet is an important issue with relation to duty of care and food policy.
Prisoners are a group where, as a result of all foods being provided, issues of dietary intake can arise( Reference Edwards, Hartwell and Schafheitle 3 ). Jurisdictions that manage prisons have a duty of care to not only provide adequate diets but also diets that do not knowingly contribute to a burden of diet-related disease. Despite prisoners being a potentially vulnerable group, little information on intakes and food practices is available( Reference Herbert, Plugge and Foster 4 ). Diets need to be supportive of health and well-being, as well as meet financial obligations of the state (e.g. getting value for money)( Reference Edwards, Hartwell and Schafheitle 3 ). Historically, detailed rations were often used( Reference Carpenter 5 ), but the literature about actual foods provided, how they are shared, used or consumed is limited( Reference Edwards, Williams and Hartwell 6 ).
Across time, the diets of prisoners have been highly scrutinised, politicised( Reference Davies 7 ), linked to discipline( Reference Cross 8 ) and informed by the emerging field of nutrition science( Reference Carpenter 9 ). International standards for the management of prisons include that food is of ‘nutritional value adequate for health and strength’( 10 ), yet there is little knowledge about whether these standards are achieved in prison populations. Of the limited studies available, most are based on self-report and/or menu analysis and do not account for all foods prisoners can access such as snacks or purchased additional foods( Reference Herbert, Plugge and Foster 4 ).
The fundamental security requirements of prisons pose challenges for researchers( Reference Wakai, Shelton and Trestman 11 ). Gaining accurate assessments of diet is complex. In collecting these data from prisoners, issues of poor literacy, numeracy and cognitive functioning( Reference Borzycki 12 ), higher rates of learning disability( Reference Hayes 13 ), limitations in use of technological methods (due to security) and the broader role that food plays in prisons( Reference Godderis 14 ) are more complex than in free-living communities.
Although health-promotion principles of good diet are espoused to lower the burden of non-communicable disease while under jurisdictional control as a duty of care( 15 ), studies of food provision in this context highlight the complexity of foodservice operations within constrained budgets( Reference Edwards, Williams and Hartwell 6 ). Although most prisons in Western countries promote healthy foods, little is known whether this aligns with prisoners’ expectations or wants and whether this is evidenced in dietary intake and outcomes of diet-related chronic disease. The purchase of supplementary food has been noted in the USA, Europe( Reference Johns, Edwards and Hartwell 16 ) and Australia( Reference Williams, Walton and Hannan-Jones 17 ). Policy gaps exist in providing guidance to prison services to meet their duty of care in food provision, and indeed whether the food provided contributes in any way to health and well-being status, and how the ability to purchase additional foods contributes to nutrient intakes.
This study aimed to assess the dietary and nutrient intakes of prisoners with an ultimate goal of informing food and nutrition policy in this setting.
Methods
Full permission to conduct the research was obtained from Queensland Corrective Service, with ethics approval granted by The University of Newcastle Human Research Ethics Committee, Newcastle, Australia. The study was conducted according to the guidelines laid down in the Declaration of Helsinki and complied with the Australian Code for the Responsible Conduct of Research.
Participants and setting
Participants were recruited from a 945-bed male-only, high-secure, publicly funded prison in Queensland, Australia. The management identified 276 eligible prisoners for the study based on exclusion criteria of those unable to consent or who posed a risk to the researchers due to aggressive behaviours. Before providing informed consent, participants attended a 30-min information session to account for literacy issues. No incentives were provided. All food in the prison (for prisoners, staff and visitors) was under management control, and the researchers were granted access to all areas, staff and relevant records in the prison related to prisoner food and diet, including dietitian reviews of menus from the previous 10 years.
Research design
A cross-sectional research design was used with convenience sampling.
Dietary intake assessment
Multiple methods were used to assess the food available to prisoners to enhance accuracy and confidence in the data collected. These included an assessment of food portion sizes, food quality (including nutritional composition and organoleptic qualities) and usual dietary practices of prisoners at the group level. The method to assess the food supply included those described for Queensland in the study by Williams et al.( Reference Williams, Walton and Hannan-Jones 17 ). The food supply data collection was conducted over 8 weeks with eighteen full-day on-site inspections including kitchens, food storage areas, prisoner accommodation, detention units, activity areas, work areas and gardens. Semi‐structured interviews were conducted with foodservice staff including prisoner cooks (and assistants) to verify usual practice. Data were compared with records from previous menu reviews and food purchase records to determine changes in food supply over time. A systematic method of repeat inspections of prisoner accommodation areas and kitchens was used to observe consistency in practice and change in food holding. A digital camera (Panasonic DMC-TZ2 6 megapixel, 28-mm wide, 10× optical zoom; Panasonic) and electronic scales (CAS SW-1W, max 20 kg, 0·002 kg; CAS Corporation) were used to assist in the verification and assessment.
Group-level dietary assessment informed the development of a tool to support a diet history method (Burke as described in Gibson( Reference Gibson 18 )) for collection of individual prisoner dietary intake. The tool included 329 colour photographs of all food available to prisoners showing each meal of the 4-week menu, plus rationed foods and snacks, presented on eighty A4 pages. Images of verified food portions (prepared in prison kitchens) were shown on standard issue prison plates or bowls, with each meal component photographed separately. Pre-packaged foods (e.g. snack foods) were shown in the packaging sizes made available to the prisoners. All images were presented on a black background (see Fig. 1). The tool was trialled with prisoner cooks for recognition of food type and quantity.

Fig. 1 Data collection tools used to support diet history. A,B,C, Plastic takeaway containers (750, 500 and 310 ml); D, mug (300 ml); E, spoon (5 ml); F, bowl (400 ml); G, dinner plate (254 mm diameter); H, salad bowl (2·25 litre); I, separate visual prompts for ‘extras’ (e.g. sauces, salt, artificial sweetener); J, photo books; K, interview booklet; L, diet history form.
Dietary interviews of 50-min were conducted face to face by two accredited dietitians familiar with the prison environment. Table 1 provides an overview of the dietary interview protocol. Anthropometric measures, blood samples and additional questions in relation to physical activity and weight change were collected at this time and are reported elsewhere( Reference Hannan-Jones and Capra 19 ).
Table 1 Overview of the dietary intake protocol
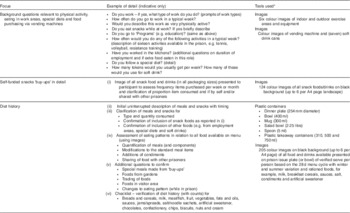
* See Fig. 1.
Individual dietary data were cross-checked for internal consistency between diet histories, food available and standard portions provided in the prison. Dietary intakes were analysed with FoodworksTM using AUSNUT 2007 Brands, Foods and Supplements( 20 – 22 ) to establish nutrient intakes. When foods that were known to be fortified with nutrients (e.g. table margarine and breakfast cereals) were consumed, the values for the specific brands were used.
Methods used to minimise error in collecting dietary intake data and analysis included the following: using a standardised introductory script; responses being checked before closure of an interview; photographs; standard questions for probing at completion of recall; use of cross-checks and lists; use of standardised utensils; inclusion of both summer and winter menu in the tool; single author entering the data; use of standard rules for foods not included in the database; and systematic management of mixed dishes. Food purchases reported by prisoners were compared with actual records of purchases.
Results were compared with the Australian and New Zealand nutrient reference values including recommended dietary intake (RDI), adequate intake (AI), upper level of intake (UL), acceptable macronutrient distribution range (AMDR) and suggested dietary targets (SDT), with the latter targets set to optimise diets for lowering chronic disease risk( 23 ). Dietary intakes were compared with adult males (19 years and over) in Australia from the 2011–2012 Australian Health Survey (AHS). The probability of inadequate intake was calculated after the method of Beaton, described in the study by Gibson( Reference Gibson 18 ). This was explored within various age groups to determine whether the risk of inadequacy varied with age.
Verification of dietary intake data
Dietary intake data were examined for plausibility using energy intake (EI):BMR method( Reference Black 24 ), where EI:BMR ratio <1 or >3 were rejected unless reported body weight changes were consistent. Medical records were examined to confirm diagnosed diet-related chronic diseases, medications, therapeutic diets and nutritional supplements.
Individual prisoner snack food purchasing (‘buy-ups’) records of 3 months (including tokens for vending machines) were compared with dietary interview data for participants who had been in the centre for more than 3 months and for whom plausible diets were reported.
Statistical analysis
Statistical analysis was conducted using IBM SPSS Statistics for Windows version 22.0( 25 ) with descriptive statistics of means with their standard errors calculated.
The study group was compared with prisoners in the facility and the Australian prisoner population using a test of proportions (two-tailed, χ 2 test for two independent samples). Data for continuous variables are presented as means with their standard errors or medians and interquartile ranges (IQR) for those with a skewed distribution. Comparison of prisoner dietary intake data was made with the 2011–2012 AHS for males above 19 years of age( 26 , 27 ) using one-sample t tests.
Results
Description of the food provision
Prisoners were provided a no-choice 4-week cyclic menu, modified twice per year (for summer and winter). Meals were prepared by prisoner cooks and assistants in two centralised cook-fresh kitchens under the supervision of correctional staff. Prepared food was transported in bulk via insulated trolleys to prisoner accommodation areas (holding up to fifty men) and portioned under supervision. Additional basic foods such as bread, milk and tea were issued according to a ration from kitchens to accommodation and prisoner work areas. Salt was added in cooking of prisoner meals, with prisoners provided 1 g portion-controlled sachets, which assisted in recall and quantification. Food provision was assessed to meet the national dietary guidelines by accredited dietitians on a 1–2-year basis since the prison opened 10 years before the study.
Prisoners could purchase additional snack foods weekly (‘buy-ups’), soft drinks from vending machines (using tokens) and snack foods from vending machines in visitor areas (also using tokens). A total of 117 non-perishable snack food products could be purchased through the ‘buy-up’ system and vending machines, with minimal change in the selection available since the prison opened. Each prisoner was able to spend up to $100 weekly (depending on available funds), which included a maximum of twenty tokens (each worth $1·10, sufficient for one 375 ml soft drink); however, purchasing privileges could be withdrawn as part of behaviour management. A number of prisoners had access to a small vegetable garden, where a limited variety of primarily green vegetables were grown.
The majority of prisoner accommodation areas had hot water (for beverages), toasters (basic salamanders in large units and domestic toasters in small units) and refrigerators, where prisoners could store a restricted range of chilled foods such as milk and margarine. Freezers were not permitted for security management. No other cooking facilities were available to prisoners, with the exception of barbecues (with prisoner access according to menu) and small electric frypans (in selected areas only).
Prisoner profile
Consent was obtained from 121 prisoners, with 120 full dietary interviews collected (response rate 43·5 %). The age profile of the study group was slightly older than prisoners in the facility (P<0·005) with a mean age of 35·5 (sd 12·0, range 19–77) years; however, no observable difference was found when compared with national statistics of male prisoners in Australia( 28 ). The reported length of stay of the study group at the facility ranged from 1 month to 10 years (when the facility was opened), with a mean of 22 (sd 22) months.
Prisoner food practices
The assessment at the group level showed a high level of modification of the prison food including holding back components of meals for inclusion in later meals with addition of ‘buy-up’ foods. For example, cold meat from a lunch time meal being added to noodles (from ‘buy-ups’) with sauces from the group’s rations being a modified meal. This practice was referred to by prisoners and (some) custodial staff as a ‘cook-up’.
Group-level meal observations showed sharing and swapping of food, even though officially not permitted in the facility, but tolerated by custodial staff (to ‘keep the peace’) and monitored to ensure that the behaviour was not excessive. Dietary interviews confirmed ‘trading’ practices, particularly in relation to provided food such as milk, ‘buy-ups’ (including cigarettes), tokens for soft drinks and in some areas vegetables from gardens. Note that this research was conducted before Queensland prisons becoming tobacco and smoke free in May 2014.
Verification of plausibility of dietary intake data
Of the 120 complete dietary assessments, 106 were deemed plausible. Observations, prisoner interviews and discussions with custodial staff identified high levels of physical activity, particularly resistance training( Reference Hannan-Jones and Capra 19 ).
Comparison of prisoner dietary interviews with individual records for ‘buy-ups’ found that 50 % of participants could accurately report 103 (88 %) products within 0·5 serves (items) per month with an IQR from 96·3 (82·3 %) to 108·0 (92·3 %). Self-report of diet-related chronic disease and therapeutic diets aligned with medical records. No prisoners were prescribed or had access to vitamin or mineral supplements. One commercial high-energy/protein milk-based sports supplement was available for prisoners to purchase through the ‘buy-ups’ but none were provided on a therapeutic basis.
The sensitivity of biomarkers in relation to dietary intake was generally low, and thus many can only discriminate between the extremes of the intake range. Examples of exceptions that reflect intakes over the entire range are urinary N, Na and K. Intakes of some other nutrients can be established over the medium- to long-term through hair or tissue biopsy( Reference Gibson 18 ). We were not able to collect biopsy material or urine samples in this context to validate reported intakes. However, the mean fasting Fe level (n 78) was 21·5 (se 0·7) μmol/l, mean total Fe-binding capacity was 58·5 (se 0·8) μmol/l, saturation 37·0 (se 1·2) % and ferritin 183·6 (se 15·5) μmol/l. When compared with the normal reference range, only one participant had Fe levels below the recommended level. These data are consistent with the dietary Fe intakes reported.
Nutrient assessment of food provision and intakes
Nutrient analysis of food available to all prisoners (i.e. verified standard portions from the menu and other foods issued per person per day), participant-reported intake including the proportion of nutrients from ‘buy-ups’ and comparison with the latest dietary survey of adult males (19 years and over) in Australia (AHS)( 26 , 27 ) is shown in Table 2 for macronutrients and in Table 3 for micronutrients (and caffeine).
Table 2 Macronutrients per person per day of food provision (verified standard portions from the menu and other foods issued), prisoner diet and proportion ‘buy-ups’ in comparison with non-prisoner adult males (Australian Health Survey (AHS)Footnote *) (Mean values with their standard errors; percentages)

Table 3 Micronutrients (and caffeine) per person per day of food provision (verified standard portions from the menu and other foods issued), prisoner diet and proportion ‘buy-ups’ in comparison with non-prisoner adult males (Australian Health Survey (AHS)Footnote *) (Mean values with their standard errors; percentages)

RDI, recommended dietary intake; AI, adequate intake; DFE, dietary folate equivalent; N/A, data not available.
† RDI/AI males 19–70 years( 23 ).
‡ P value comparing prisoner diet with the AHS was determined by t test.
§ RDI 19–50/51–70 years.
║ RDI 19–30/31–70 years.
¶ Excludes discretionary salt.
** Provided as tea only.
The food available, if all consumed, at the group level provided sufficient energy for males of typical height in the Australian community (1·7–1·8 m)( 29 ) and a physical activity level of 1·6( 23 ) (Table 2). The standard allocation of food per person per day met both RDI and AI for adult males for all ages with the exception of Na, which was above UL (2300 mg/d( 23 )), long-chain fatty acids at 93 % of AI and vitamin D lower than the requirement for older males (51 years and over) (Tables 2 and 3).
Table 4 identifies that the percentage of individuals who reported inadequate intakes of nutrients was lower in the prisoner population when compared with the adult male population (19 years and over) in Australia( 23 , 27 ). To date, there has been no release of national data on the percentage failing to meet the recommended levels where the nutrient has an AI rather than an estimated average requirement (EAR)/RDI and no data for any recommended values other than EAR and the AMDR. The cut-point method was used to establish the percentage with inadequate intakes( Reference Gibson 18 ). Additional estimates of the probability of inadequate intakes of the prisoners were made, so as to not overstate the case of ‘deficiency’, which can happen with the use of single cut-point values (data not shown). The estimates of the probability of inadequate intake were 8 % for Mg for those over 30 years and 2·9 % for those under 30 years compared with 20·8 %<RDI; 6·0 % for Ca for those over 70 years of age and 1·5 % for those under 70 years compared with 15·1 %<RDI; 3·5 % for folate compared with 9·4 %<RDI; 2·7 % for each of Zn and I compared with 7·5 and 8·5 %, respectively, <RDI; and 2·3 % compared with 7·5 %<RDI for vitamin A.
Table 4 Percentage of prisoners (n 106) reporting inadequate intakes relative to nutrient reference values( 23 ) in comparison with non-prisoner adult males (Australian Health Survey (AHS)Footnote *)Footnote †

EAR, estimated average requirement; RDI, recommended dietary intake; AI, adequate intake; AMDR, acceptable macronutrient distribution range; SDT, suggested dietary targets; N/A, data not available; DFE, dietary folate equivalent.
* AHS males 19 years and over( 27 ).
† No prisoner reported an inadequate intake at any level for niacin or P.
The standard serve of food provided was within all AMDR. The food provided also met the SDT for fibre and total folate, but it was below the recommended levels for long-chain n-3 fatty acids (24 %), vitamin E (52 %), vitamin C (60 %), close to recommended values for total vitamin A (96 %) and K (94 %) and well outside the recommended target for Na (at 304 %)( 23 ). The major food sources of Na in participant-reported dietary intakes are outlined in Table 5.
Table 5 Main sodium sources in prisoner diet (n 106) (Medians and interquartile ranges (IQR))
Impact of buy-ups on nutrient intake
Of the sixteen RDI and AI for micronutrients assessed, thirty (28·3 %) participant-reported nutrient intakes met all (except Na), with a further twenty-seven (25·5 %) meeting fourteen. The high-energy/protein sports supplement was consumed by thirty-five (33 %) participants, and of this group 80 % of the reported nutrient intakes met fourteen or fifteen RDI and/or AI for micronutrients, compared with 41 % for those who did not consume the supplement.
A small variety of canned fish was available on the ‘buy-ups’, with sixty-three (59·4 %) prisoners reporting dietary intakes between 2 and 286 g/d (median 36 (IQR 14–71) g). For the group that reported consumption of canned fish, median long-chain fatty acid intake was 383 (IQR 245–581) mg, with this group not normally distributed, with one person above the UL of 3000 mg, an outlier, compared with a median 149 (IQR 94–176) mg for those who did not report diets with canned fish from ‘buy-ups’.
Soft drinks, sports drinks (electrolyte type) and cordial were consumed by eighty-three participants (78·3 %), with median intakes of 126 (IQR 13–228) g/d. For prisoners who consumed these beverages, the median energy from this source was 351 (IQR 71–915) kJ. Approximately 20 % of the Na intake came from the ‘buy-ups’, primarily from instant noodles, which contributed to nearly 40 % of the Na from the ‘buy-ups’.
Discussion
This research presents a unique description of prisoner dietary intakes and insight into food practices in a high-secure prison, using detailed and multiple methods to support confidence in the accuracy of the nutrient assessment. Its strength is the use of multiple methods to increase confidence in the data, given this population poses a number of challenges to data collection. The photographic tools used facilitated focused dietary interviews for this group as they are known to have lower literacy levels than the general population. Responses were able to be verified at a global level through purchasing records and observations.
The food provision was mostly nutritionally adequate, but reliant on all foods provided to be consumed for certain nutrients to meet estimated requirements. At the individual level, there were individuals who consumed less than adequate diets, despite the large EI and the restrictions on the less-desirable food groups.
These data show prisoner dietary intakes to be higher in total energy and macronutrients than those reported in the latest national dietary studies for males (AHS) with the exception of cholesterol, which was lower. Not all reported dietary intakes achieved the AI for fatty acids and fibre; however, given that the mean intake for these nutrients is higher in the prisoner dietary intakes than that reported for adult males in the AHS, it suggests that prisoner dietary intakes may be more favourable for these nutrients. With the mean reported prisoner dietary intake higher in energy than that of adult males generally, it is not surprising that most micronutrient intakes (with the exception of vitamin E) were higher. For nutrients where EAR are set and comparisons can be made with adult males in the AHS, the reported prisoner dietary intakes were much more favourable, with the exception of folate.
The finding of over 60 % of reported prisoner dietary intakes not achieving adequate vitamin D intake is of concern. None of the males over 50 years met the 5 μg recommended level, let alone their higher requirement. No comparison dietary data are available on vitamin D intakes in the latest AHS survey; however, biomedical measures in the survey found inadequate status for 12·7 % of persons across the year in Queensland (where this study was conducted)( 30 ). Inadequate dietary intakes were reported in the 2007 national survey for children( 31 ); therefore, it is likely that the findings of our study are reflective of a broader issue of dietary inadequacy in the Australian community. Major sources in the food provision and prisoner dietary intakes for vitamin D in this study were milk and fortified margarine. In this prison, the milk supply (rationed at 600 ml/person per d) had been changed to low-fat type to assist with the reduction of SFA intake, and it is evident that this change negatively impacted vitamin D availability, especially for the older age groups. Exposure to sunlight was also both controlled and limited.
Mg and Ca were also found to be nutrients at risk. The sources of Ca were similar to that found in the AHS for adult males( 26 ); however, for Mg, in the general population, meat featured as a more prominent source. In the prison environment, meat is limited due to both budgetary restraint and to be compliant with the national dietary guidelines. No special provision was made for older males to support higher requirement of Ca.
In relation to optimal diets to lower chronic disease risk, reported nutrient intakes of participants generally met AMDR with the exception of SFA and linoleic n-6 fatty acids (for approximately a third of the group), but overall the food provision and mean intakes were more favourable than in the general population. The alcohol-free environment of the prison may have contributed to the better diets overall. SDT were less well achieved, particularly for Na, long-chain fatty acids and vitamin E, C and A. No comparative data were available for the general community.
This study has shown the significant dietary contribution of discretional foods through the ‘buy-ups’ system. Instant noodles were a significant source of both energy and Na. Other popular food products that had a negative impact on prisoner dietary intakes (primarily due to their energy and/or SFA source) were soft drinks, biscuits, chocolates, chips, confectionery and spreads. In contrast, some ‘buy-up’ foods had a positive impact on prisoner nutrient intakes including milk and fortified milk-based drinks, breakfast cereals, canned fish and nuts. Those who consumed the commercial milk-based sports supplement drink had an overall better nutritional profile.
The reported Na intakes were very high with none meeting the SDT of <1600 mg. Added salt is difficult to quantify, and in the AHS nearly half of adult males described adding salt to food at the table and while cooking( 26 ), with this discretionary salt not being included in the reported dietary Na intake data, limiting comparability. Salt shakers were not permitted in this prison (as deemed a potential vessel to hide contraband); thus, added salt was provided via 1 g portion-control sachets. Prisoners were consistent when recalling whether they used the salt sachets with their food and where they would use them across the 28-d menu cycle. With instant noodles, flavour sachets (high in Na) came in separate packages, and thus we were able to quantify the levels with prisoners reporting never using them, using them as per instructions with noodles and collecting multiple flavour sachets and using them with other improvised meals (‘cook ups’), making our quantification easier. Given that the intakes of K were >60 % higher in these prisoners compared with the general population, the impact of the high Na may be lessened (compared with AHS).
Modification of food
Descriptions were provided by more experienced prisoners showing abilities to innovatively modify foods (with limited ingredients and equipment), and in some areas of the prison this modification attempted to replicate cultural cuisines with ‘Greek’, ‘Italians’ and/or ‘Asian’ dishes described. In one instance, a participant described how yogurt continued to be (secretly) cultured for months since originally provided on the menu. Similar practices to these have been described in other studies of prisoner diets( Reference Ugelvik 32 , Reference Bosworth and Thomas 33 ), and highlight the issues of managing food preferences and the broader role food plays in this setting.
Food and nutrition policy
This research highlights the importance of considering all aspects of food provision when setting food policy. There is a need for balance when determining whether there is to be a choice while promoting healthy foods, ensuring that these are acceptable to the group. Fortified foods including breakfast cereals, breads and margarines were important contributors to the overall adequacy of diets. The issues of trading and distortion of meals highlight the broader role that food plays in the institutional context, particularly in the more restrictive environment. The consumption of snack foods outside the planned provision in prisons is typical across jurisdictions( Reference Johns, Edwards and Hartwell 16 , Reference Williams, Walton and Hannan-Jones 17 ). If the goal of the menu is health and chronic disease prevention, then these snacks, as shown in this study, have the potential to either improve the nutrient intake profile or reduce its quality.
Limitations
This was a cross-sectional study, although it aimed to capture usual intake over the period of incarceration. Although we are confident in the data collected, we were limited to the group included in the study and were unable to collect data at a second time point. In the AHS, there was significant under-reporting among male respondents for the first time, with this estimated to be in the order of 17 %( 26 ). Therefore, confidence in actual nutrient intakes in the general community has been reduced and there could be fewer (or more) differences than we conclude.
Conclusions
Overall, this study shows planned food provision as nutritionally adequate, with the exception of vitamin D for older males, long-chain fatty acids and Na well above the upper limit, more favourable intakes than the general community. The Australian SDT for lowering chronic disease risk were not achieved in the planned food. Significant energy and nutrients were being provided by additional foods outside the planned foods, distorting the nutritional aims of the menu, both positively and negatively. It is challenging to deliver particular nutrients in menus with budgetary limitations, designed to match health promotion goals and where there is no choice. The high Na intake is a major concern, and with main sources from breads and cereals, any attempts to lower Na would require a significant change in the types of food provided.
The prisoners ate big diets, nearly twice compared with other male adults, yet they could not achieve the recommended intakes. Menus based on national dietary guidelines require careful planning for appropriate nutrients to be delivered within energy limits.
Acknowledgements
The authors thank the participants in the study and Queensland Corrective Services.
The present study was funded through the Universities of Newcastle and Queensland higher education student allowance.
The authors contributions are as follows: both authors initiated and designed the study and collected data. M. H.-J. analysed the data. Both authors wrote and reviewed the manuscript.
The authors have no financial or personal potential conflicts of interest to declare.


