


According to the WHO, 39 % of adults were overweight and 13 % had obesity in 2016(1) with paediatric data being just as concerning with 340 million children from 5 to 19 years old classified with overweight and obesity worldwide(1). This alarming prevalence of overweight, obesity and their associated metabolic complications call for a better understanding of the mechanisms involved to propose innovative and effective weight loss strategies. Among them, the regulation of energy balance(Reference Blundell, Gibbons and Caudwell2,Reference Hopkins, Duarte and Beaulieu3) and the pathways involved in the control of appetite and energy intake (EI) have been of particular interest in recent years(4). Both homoeostatic and hedonic mechanisms influence the motivation to eat (hunger), meal size (satiation) and post-meal suppression of hunger (satiety)(Reference Blundell and Finlayson5).
Indeed, a number of objective and subjective methods have been developed for the quantification and evaluation of both food intake (e.g. ad libitum test meals, food diaries) and appetite sensations (e.g. visual analogue scale; VAS). These VAS usually comprise questions pertaining to hunger ‘How hungry do you feel?’, fullness ‘How full do you feel?’, desire to eat ‘How strong is your desire to eat?’ and prospective food consumption ‘How much do you think you could eat?’, with ‘not at all’ to ‘extremely’ as labelled end points. Integrating both the energy content of food ingested during a meal and the associated change in appetite sensations, Green et al. developed a Satiety Quotient (SQ) as an indicator of the satiating efficiency of food(Reference Green, Delargy and Joanes6). The SQ is calculated by dividing the change in subjective appetite sensations in response to a meal by the energy content of the meal.
Since its development, there has been an increasing use of the SQ. While initially created as an indicator for the satiating efficiency of a meal or food, the SQ has been associated with food intake(Reference Dubé, Tremblay and Lavoie7–Reference Drapeau, King and Hetherington10) and body weight (BW) and composition(Reference McNeil, Prud’homme and Strychar9,Reference Salama, Drapeau and Tremblay11,Reference Arguin, Tremblay and Blundell12) or used as a tool to classify individuals by their satiety responsiveness(Reference Drapeau, Blundell and Gallant13–Reference Hollingworth, Dalton and Blundell15). However, the extent to which the SQ has been applied in research and its scientific and clinical relevance has yet to be examined. Therefore, the aim of this systematic review is to review the available evidence of the different contexts in which the SQ has been utilised in research, the methodologies used to calculate the SQ and to examine its clinical utility.
Methods
This review is registered in the PROSPERO database as CRD42019136442. The PRISMA guidelines were followed for the preparation of this paper(Reference Liberati, Altman and Tetzlaff16).
Database search
The following electronic bibliographic databases were searched: PubMed, Embase, Scopus, Web of Science, CAB Abstract Core Collection and Google Scholar. The literature search considered studies from the year 1900 to April 2020. Keyword searches were performed for ‘Satiation’, ‘Satiety response’, ‘Appetite’, ‘Hunger’, ‘Humans’, ‘Fullness’, ‘Prospective Food Consumption’, ‘Desire To Eat’, ‘Motivation To Eat’ and ‘Satiety Quotient’. The search strategy for each of the databases is detailed in Table 1. The search strategies were developed based on an analysis of the literature and were open-ended according to the nature of each database. The reference lists of the articles included were also examined to complete the search.
Table 1. Database search strategy details
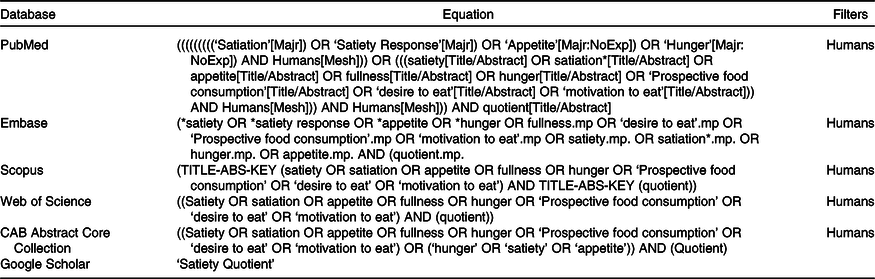
Mp, title, abstract, heading word, drug trade name, original title, device manufacturer, drug manufacturer, device trade name, keyword, floating subheading word, candidate term word.
Study eligibility
Inclusion criteria
To be included in the review, studies had to use SQ. There was no exclusion criterion for the study design (cross-sectional, observational, longitudinal or interventional), population (no limit for age, weight status and associated complications and both sexes were included) and meal type (standardised or ad libitum). Published peer-reviewed studies, conference proceedings and posters (when data and design properly described), theses and dissertations were eligible.
Exclusion criteria
When data were presented in a graphical form without mean or standard deviation indicated, the corresponding author of the work was contacted to obtain complementary data. If the corresponding author did not answer or declined the query, studies were excluded. When the full text was not found and the corresponding author was unreachable or did not respond, the article was excluded.
Study selection
Titles and abstracts of potentially relevant studies were screened in duplicate for inclusion in the review and any discrepancies were collectively discussed by the authors. The same procedure was followed for the full texts. Any disagreement regarding eligibility for inclusion was discussed and a consensus made among co-authors.
Data extraction
For every included study, the following data were extracted: sample size and characteristics (sex, age, BMI), study design and aim, VAS characteristics (specific appetite sensations assessed and timing), meal characteristics, SQ equation and main SQ results.
Risk of bias
Risk of bias was independently evaluated by two authors (AF, DT) using the Cochrane risk of bias tool(Reference Higgins and Green17). Risk of bias was assessed for: selection bias, performance bias, detection bias, attrition bias and reporting bias. Any discrepancies in bias coding were resolved by a third reviewer. Studies were not excluded on the basis of risk of bias.
Results
The flow diagram presented in Fig. 1 illustrates the selection/inclusion/exclusion process. The initial database search identified 1281 studies and nine additional studies were also identified. Following the removal of duplicate studies, 495 studies were identified. After review of titles and abstracts, 162 studies were excluded and eighty-five full-text were screened, leaving fifty-two included studies. Table 2 details the risk of bias analysis. Of the fifty-two studies included, thirty-three were acute studies(Reference Green, Delargy and Joanes6–Reference Drapeau, Blundell and Therrien8,Reference Salama, Drapeau and Tremblay11,Reference Drapeau, Blundell and Gallant13–Reference Hollingworth, Dalton and Blundell15,Reference Hansen, Sjodin and Ritz18–Reference Thivel, Roche and Miguet42) and nineteen were longitudinal studies(Reference McNeil, Prud’homme and Strychar9,Reference Drapeau, King and Hetherington10,Reference Arguin, Tremblay and Blundell12,Reference Harrington, Martin and Ravussin43–Reference Beaulieu, Casanova and Oustric59) .
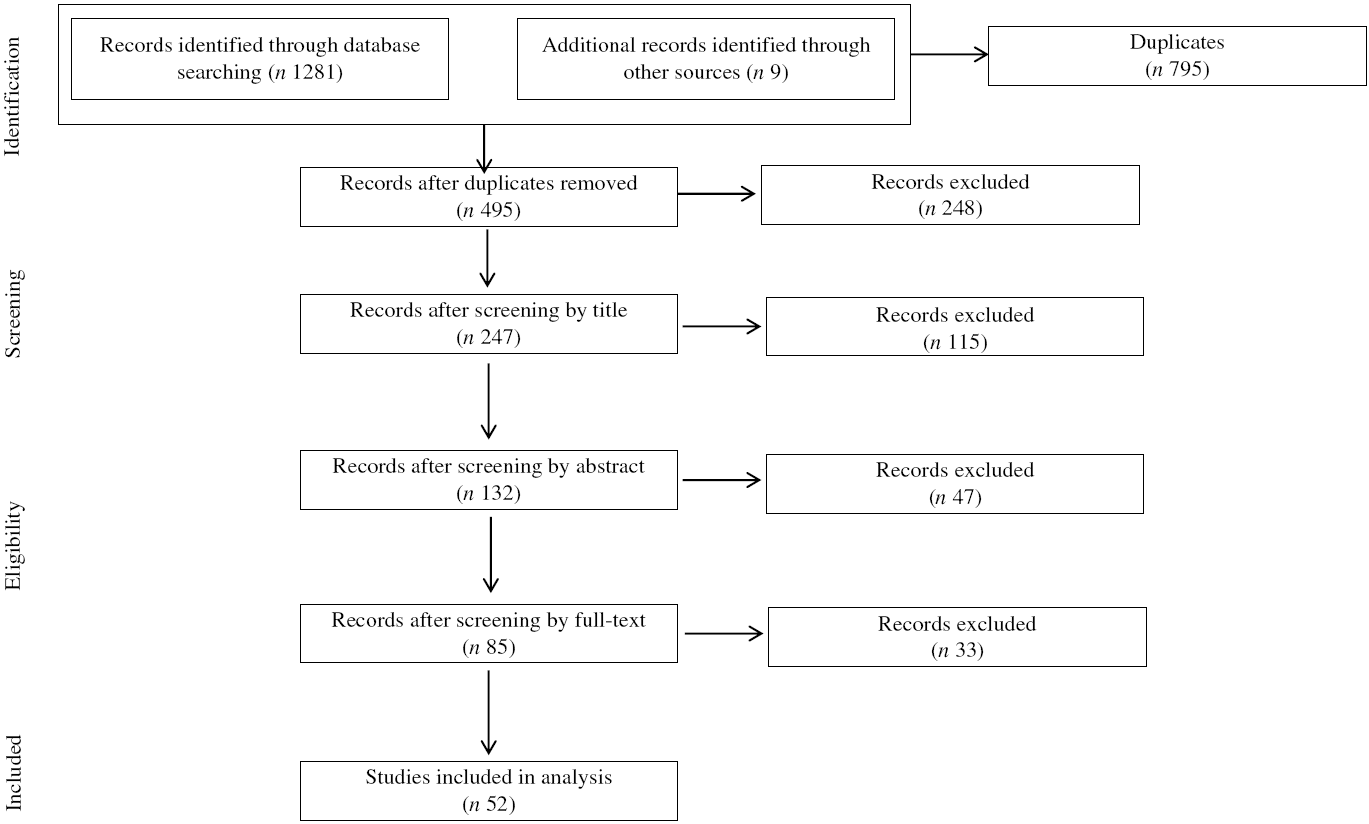
Fig. 1. Flow chart.
Table 2. Risk of bias
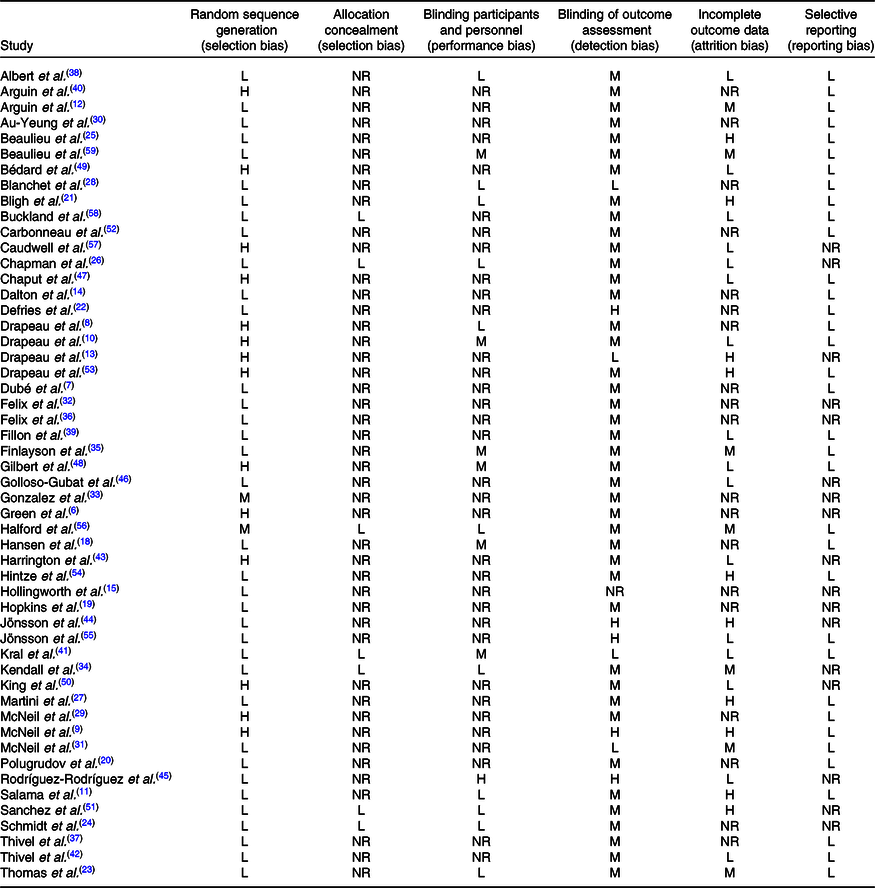
L, low risk; M, medium risk; H, high risk; NR, not reported.
Acute studies
Of the thirty-three acute studies, twenty-nine were conducted in adults(Reference Green, Delargy and Joanes6–Reference Drapeau, Blundell and Therrien8,Reference Salama, Drapeau and Tremblay11,Reference Drapeau, Blundell and Gallant13–Reference Hollingworth, Dalton and Blundell15,Reference Hansen, Sjodin and Ritz18–Reference Thivel, Fillon and Genin37,Reference Arguin, Gagnon-Sweeney and Pigeon40,Reference Harrington, Martin and Ravussin43) and four in adolescents(Reference Albert, Drapeau and Mathieu38,Reference Fillon, Mathieu and Masurier39,Reference Kral, Moore and Chittams41,Reference Thivel, Roche and Miguet42) .
Adult acute studies (n 29)
Main aim, population and design
The main aims, populations and used designs are presented in Table 3 and fully detailed in the online Supplementary material.
Table 3. Population, design, methods and main results of adult acute studies*
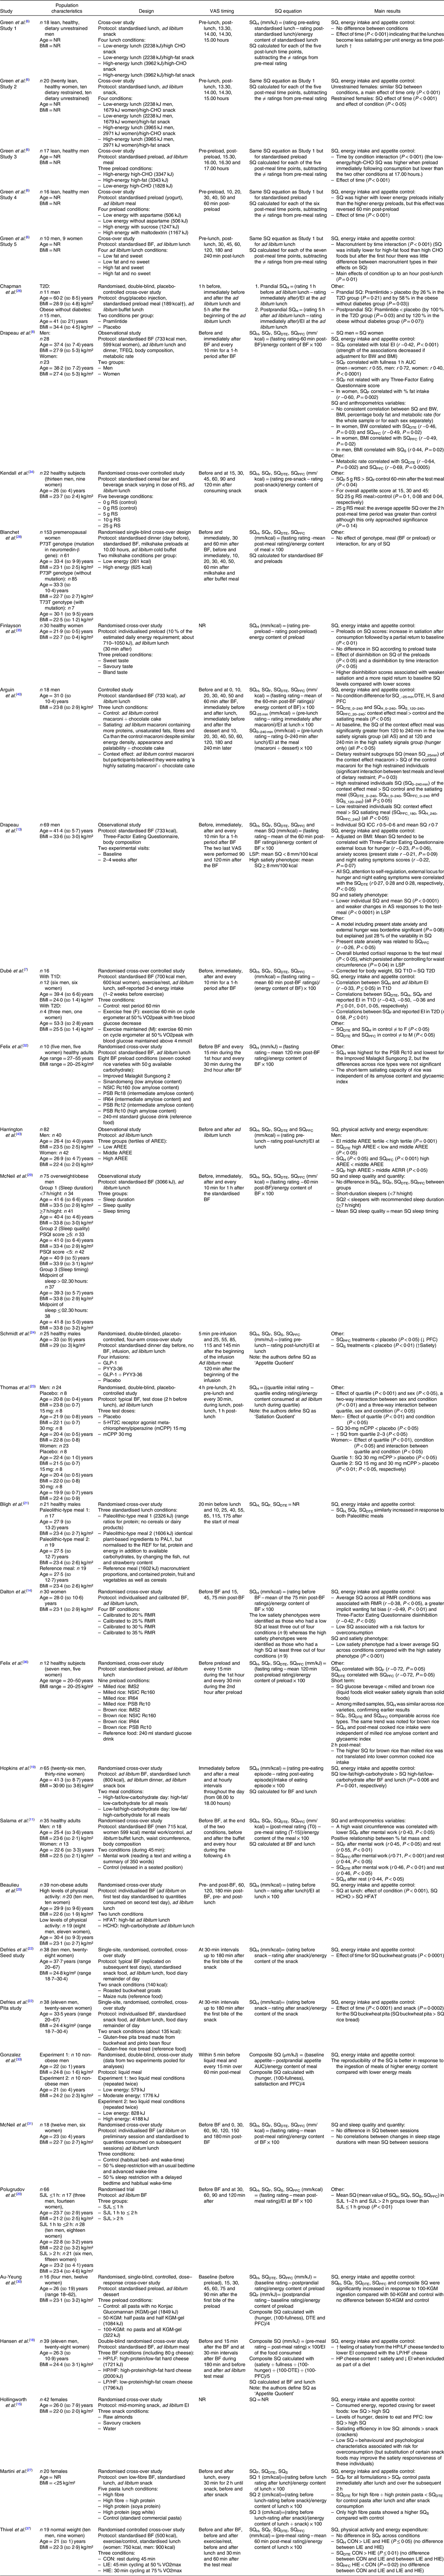
VAS, visual analogue scale; SQ, Satiety Quotient; NR, not reported; AS, appetite sensation; H, hunger; BF, breakfast; EI, energy intake; T2D, type 2 diabetes; BW, body weight; F, fullness; DTE, desire to eat; PFC, prospective food consumption; S, satiety; RS, resistant starch; LSP, low satiety phenotype; T1D, type 1 diabetes; AREE, activity-related energy expenditure; SJL, social jetlag; LIE, low-intensity exercise; HIE, high-intensity exercise.
* Only protocol is detailed that is relevant to SQ.
† To convert energy values from kcal to kJ, multiply by 4·184.
Methods
Topics
Of the twenty-nine studies, 90 % (n 26) compared SQ in response to a stimulus (meal, exercise and sleep), the remaining studies(Reference Drapeau, Blundell and Therrien8,Reference Drapeau, Blundell and Gallant13,Reference Dalton, Hollingworth and Blundell14) used SQ to categorise their population (high or low satiety phenotype). Fifty-nine percent of the included studies (n 17) compared the SQ response to meals of different composition. Of these seventeen studies, two used liquid meals(Reference Blanchet, Lemieux and Couture28,Reference Gonzalez, Frampton and Deighton33) , fourteen solid meals(Reference Green, Delargy and Joanes6,Reference Dalton, Hollingworth and Blundell14,Reference Hollingworth, Dalton and Blundell15,Reference Hansen, Sjodin and Ritz18,Reference Hopkins, Gibbons and Caudwell19,Reference Bligh, Godsland and Frost21,Reference Defries, Petkau and Gregor22,Reference Beaulieu, Hopkins and Blundell25,Reference Martini, Brusamolino and Del Bo27,Reference Au-Yeung, Jovanovski and Jenkins30,Reference Kendall, Esfahani and Sanders34–Reference Thivel, Fillon and Genin37,Reference Arguin, Gagnon-Sweeney and Pigeon40) and one study compared solid v liquid meals(Reference Felix, Trinidad and Tuano32). Of these studies, three examined the effect of meals differing in energy content(Reference Dalton, Hollingworth and Blundell14,Reference Blanchet, Lemieux and Couture28,Reference Gonzalez, Frampton and Deighton33) and five studies compared the effect of meals differing in macronutrient composition(Reference Green, Delargy and Joanes6,Reference Hollingworth, Dalton and Blundell15,Reference Hansen, Sjodin and Ritz18,Reference Hopkins, Gibbons and Caudwell19,Reference Beaulieu, Hopkins and Blundell25) . Martini et al. (Reference Martini, Brusamolino and Del Bo27) compared the effect of meals differing in fibre and protein, and Au-Yeung et al. (Reference Au-Yeung, Jovanovski and Jenkins30) compared the effect of different amounts of protein intake via konjac glucomannan capsules and one study examined the combined effects of a modification in macronutrients, unsaturated fats, fibre and Ca(Reference Arguin, Gagnon-Sweeney and Pigeon40). In a slightly different way, Felix et al. (Reference Felix, Trinidad and Tuano32) compared the effect of different kinds of rice and Finlayson et al. (Reference Finlayson, Bordes and Griffioen-Roose35) the effect of different tastes on appetite sensations. Defries et al. (Reference Defries, Petkau and Gregor22) compared the different satiating effects of meals made from buckwheat flour or rice flour, while Felix et al. (Reference Felix, Tuano and Mallillin36) compared the different satiating effects of white rice or brown rice using four different types of rice and Kendall et al. (Reference Kendall, Esfahani and Sanders34) the effect of different resistant starch compositions using beverages. Finally, in their study, Bligh et al. (Reference Bligh, Godsland and Frost21) investigated the satiating effect of two different types of Paleolithic meals compared with a reference meal.
Three of the studies investigated the influence of sleep on SQ(Reference Polugrudov, Popov and Smirnov20,Reference McNeil, Drapeau and Gallant29,Reference McNeil, Forest and Hintze31) : one examined the effect of sleep duration(Reference Polugrudov, Popov and Smirnov20), while another examined the timing(Reference McNeil, Forest and Hintze31) and a last one assessed the influence of the duration, quality and timing of sleep(Reference McNeil, Drapeau and Gallant29). Two of the twenty-eight studies investigated acute medication interventions(Reference Thomas, Dourish and Tomlinson23,Reference Chapman, Parker and Doran26) and one assessed the effect of hormone infusions(Reference Schmidt, Gregersen and Pedersen24). Among the acute studies, two included acute exercise in their protocol and compared appetite sensations after the same exercise performed at different blood glucose levels(Reference Dubé, Tremblay and Lavoie7) and the other compared different intensities of exercise(Reference Thivel, Fillon and Genin37) or different activity related energy expenditure(Reference Harrington, Martin and Ravussin43). One study investigated the effect of mental work(Reference Salama, Drapeau and Tremblay11) and another compared the appetite sensation response of men and women(Reference Drapeau, Blundell and Therrien8). Finally, Drapeau et al. (Reference Drapeau, Blundell and Gallant13) characterised the biopsychobehavioural profiles of men with low satiety phenotype at the start of a weight loss intervention.
Visual analogue scale
Regarding the type of VAS used, 79 % (n 23) of acute studies used the pen and paper method(Reference Green, Delargy and Joanes6–Reference Drapeau, Blundell and Therrien8,Reference Salama, Drapeau and Tremblay11,Reference Drapeau, Blundell and Gallant13,Reference Dalton, Hollingworth and Blundell14,Reference Polugrudov, Popov and Smirnov20,Reference Defries, Petkau and Gregor22,Reference Schmidt, Gregersen and Pedersen24,Reference Chapman, Parker and Doran26–Reference Thivel, Fillon and Genin37,Reference Arguin, Gagnon-Sweeney and Pigeon40,Reference Harrington, Martin and Ravussin43) , 10 % (n 3) used electronic VAS(Reference Hansen, Sjodin and Ritz18,Reference Bligh, Godsland and Frost21,Reference Thomas, Dourish and Tomlinson23) and three studies did not specify the type of scale used(Reference Hollingworth, Dalton and Blundell15,Reference Hopkins, Gibbons and Caudwell19,Reference Beaulieu, Hopkins and Blundell25) . Of the twenty-three studies using pen and paper scales, fifteen used 100 mm scales(Reference Green, Delargy and Joanes6,Reference Dalton, Hollingworth and Blundell14,Reference Polugrudov, Popov and Smirnov20,Reference Defries, Petkau and Gregor22,Reference Schmidt, Gregersen and Pedersen24,Reference Chapman, Parker and Doran26,Reference Martini, Brusamolino and Del Bo27,Reference Au-Yeung, Jovanovski and Jenkins30–Reference Felix, Tuano and Mallillin36,Reference Harrington, Martin and Ravussin43) , while eight used 150 mm scales(Reference Dubé, Tremblay and Lavoie7,Reference Drapeau, Blundell and Therrien8,Reference Salama, Drapeau and Tremblay11,Reference Drapeau, Blundell and Gallant13,Reference Blanchet, Lemieux and Couture28,Reference McNeil, Drapeau and Gallant29,Reference Thivel, Fillon and Genin37,Reference Arguin, Gagnon-Sweeney and Pigeon40) . For studies that used electronic VAS, one used 100 mm scales(Reference Hansen, Sjodin and Ritz18), one used 60 mm scales(Reference Bligh, Godsland and Frost21) and one did not specify the length of the scale used(Reference Thomas, Dourish and Tomlinson23). The three studies that did not specify the type of scale used also did not specify the length of the scale(Reference Hollingworth, Dalton and Blundell15,Reference Hopkins, Gibbons and Caudwell19,Reference Beaulieu, Hopkins and Blundell25) .
Out of the twenty-nine studies, twenty-eight assessed ‘Hunger’(Reference Green, Delargy and Joanes6–Reference Drapeau, Blundell and Therrien8,Reference Salama, Drapeau and Tremblay11,Reference Drapeau, Blundell and Gallant13–Reference Hollingworth, Dalton and Blundell15,Reference Hansen, Sjodin and Ritz18–Reference Chapman, Parker and Doran26,Reference Blanchet, Lemieux and Couture28–Reference Thivel, Fillon and Genin37,Reference Arguin, Gagnon-Sweeney and Pigeon40,Reference Harrington, Martin and Ravussin43) , twenty-four measured ‘Fullness’(Reference Dubé, Tremblay and Lavoie7,Reference Drapeau, Blundell and Therrien8,Reference Salama, Drapeau and Tremblay11,Reference Drapeau, Blundell and Gallant13,Reference Dalton, Hollingworth and Blundell14,Reference Hansen, Sjodin and Ritz18,Reference Polugrudov, Popov and Smirnov20–Reference McNeil, Forest and Hintze31,Reference Gonzalez, Frampton and Deighton33,Reference Kendall, Esfahani and Sanders34,Reference Felix, Tuano and Mallillin36,Reference Thivel, Fillon and Genin37,Reference Arguin, Gagnon-Sweeney and Pigeon40,Reference Harrington, Martin and Ravussin43) and twenty investigated ‘Prospective Food Consumption’(Reference Dubé, Tremblay and Lavoie7,Reference Drapeau, Blundell and Therrien8,Reference Salama, Drapeau and Tremblay11,Reference Drapeau, Blundell and Gallant13–Reference Hollingworth, Dalton and Blundell15,Reference Hansen, Sjodin and Ritz18,Reference Polugrudov, Popov and Smirnov20,Reference Defries, Petkau and Gregor22,Reference Schmidt, Gregersen and Pedersen24,Reference Blanchet, Lemieux and Couture28–Reference McNeil, Forest and Hintze31,Reference Gonzalez, Frampton and Deighton33,Reference Kendall, Esfahani and Sanders34,Reference Felix, Tuano and Mallillin36,Reference Thivel, Fillon and Genin37,Reference Arguin, Gagnon-Sweeney and Pigeon40,Reference Harrington, Martin and Ravussin43) . ‘Desire to Eat’ was assessed in twenty studies(Reference Dubé, Tremblay and Lavoie7,Reference Drapeau, Blundell and Therrien8,Reference Salama, Drapeau and Tremblay11,Reference Drapeau, Blundell and Gallant13–Reference Hollingworth, Dalton and Blundell15,Reference Hansen, Sjodin and Ritz18,Reference Bligh, Godsland and Frost21–Reference Thomas, Dourish and Tomlinson23,Reference Martini, Brusamolino and Del Bo27–Reference McNeil, Forest and Hintze31,Reference Kendall, Esfahani and Sanders34,Reference Felix, Tuano and Mallillin36,Reference Thivel, Fillon and Genin37,Reference Arguin, Gagnon-Sweeney and Pigeon40,Reference Harrington, Martin and Ravussin43) and ‘Satiety’ in four studies(Reference Hansen, Sjodin and Ritz18,Reference Polugrudov, Popov and Smirnov20,Reference Schmidt, Gregersen and Pedersen24,Reference Martini, Brusamolino and Del Bo27) . However, as described below, all appetite sensations measured were not used for the calculation of SQ.
Calculation of Satiety Quotient
Equations used
Of the twenty-nine acute studies included, eight used the initial equation proposed by Green et al. (Reference Green, Delargy and Joanes6,Reference Defries, Petkau and Gregor22,Reference Schmidt, Gregersen and Pedersen24,Reference Au-Yeung, Jovanovski and Jenkins30,Reference Gonzalez, Frampton and Deighton33–Reference Finlayson, Bordes and Griffioen-Roose35,Reference Harrington, Martin and Ravussin43) : (appetite sensation pre-meal – appetite sensation post-meal)/EI of eating episode. This equation was slightly reworked by Drapeau et al. (Reference Drapeau, King and Hetherington10), who used this equation but multiplied the result by 100. Fifteen studies used the equation proposed by Drapeau et al. (Reference Dubé, Tremblay and Lavoie7,Reference Drapeau, Blundell and Therrien8,Reference Drapeau, Blundell and Gallant13,Reference Dalton, Hollingworth and Blundell14,Reference Hansen, Sjodin and Ritz18–Reference Polugrudov, Popov and Smirnov20,Reference Beaulieu, Hopkins and Blundell25,Reference Blanchet, Lemieux and Couture28,Reference McNeil, Drapeau and Gallant29,Reference McNeil, Forest and Hintze31,Reference Felix, Trinidad and Tuano32,Reference Felix, Tuano and Mallillin36,Reference Thivel, Fillon and Genin37,Reference Arguin, Gagnon-Sweeney and Pigeon40) . While previous studies have used similar equations, others have calculated the SQ slightly differently. Chapman et al. (Reference Chapman, Parker and Doran26) calculated two SQ: a prandial SQ that considered in its calculation both pre- and post-meal appetite sensations, and a post-prandial SQ only considering post-meal sensations. In their study, Martini et al. (Reference Martini, Brusamolino and Del Bo27) calculated three different SQ: (1) the same equation as Drapeau et al. using the pre- and post-lunch appetite sensations and energy content of lunch; (2) (appetite sensation before lunch – appetite sensation before snack)/energy content of lunch × 100 and (3) (appetite sensation before lunch – appetite sensation after snack)/(energy content of lunch + snack) × 100. More specifically, Au-Yeung et al. (Reference Au-Yeung, Jovanovski and Jenkins30) used the Green equation for SQH, SQDTE and SQPFC. For SQF, they subtracted fullness post-eating from fullness fasting. Salama et al. (Reference Salama, Drapeau and Tremblay11) also reversed the order of subtraction between appetite sensations contrary to what was done by Drapeau, subtracting pre-meal sensations from post-meal sensations. Two studies did not specify the type of equation used(Reference Hollingworth, Dalton and Blundell15,Reference Bligh, Godsland and Frost21) . Finally, Thomas et al. (Reference Thomas, Dourish and Tomlinson23) used an adapted version of the equation proposed by Green and calculated ‘satiation quotient’ per quartile, reflecting the satiety capacity of a food as eaten ((quartile initial hunger – quartile ending hunger rating)/energy consumed during quartile).
Appetite sensations used
Although we have previously detailed the different appetite sensations assessed in the included studies, SQ was not calculated in each of these studies using all the assessed sensations. Twenty-five studies calculated an SQ for ‘Hunger’(Reference Green, Delargy and Joanes6–Reference Drapeau, Blundell and Therrien8,Reference Salama, Drapeau and Tremblay11,Reference Drapeau, Blundell and Gallant13,Reference Dalton, Hollingworth and Blundell14,Reference Hopkins, Gibbons and Caudwell19–Reference Chapman, Parker and Doran26,Reference Blanchet, Lemieux and Couture28–Reference Felix, Trinidad and Tuano32,Reference Kendall, Esfahani and Sanders34–Reference Thivel, Fillon and Genin37,Reference Arguin, Gagnon-Sweeney and Pigeon40,Reference Harrington, Martin and Ravussin43) , sixteen for ‘Fullness’(Reference Dubé, Tremblay and Lavoie7,Reference Drapeau, Blundell and Therrien8,Reference Salama, Drapeau and Tremblay11,Reference Drapeau, Blundell and Gallant13,Reference Polugrudov, Popov and Smirnov20,Reference Bligh, Godsland and Frost21,Reference Schmidt, Gregersen and Pedersen24,Reference Martini, Brusamolino and Del Bo27–Reference McNeil, Drapeau and Gallant29,Reference McNeil, Forest and Hintze31,Reference Kendall, Esfahani and Sanders34,Reference Felix, Tuano and Mallillin36,Reference Thivel, Fillon and Genin37,Reference Arguin, Gagnon-Sweeney and Pigeon40,Reference Harrington, Martin and Ravussin43) and fifteen for ‘Desire To Eat’(Reference Dubé, Tremblay and Lavoie7,Reference Drapeau, Blundell and Therrien8,Reference Salama, Drapeau and Tremblay11,Reference Drapeau, Blundell and Gallant13,Reference Bligh, Godsland and Frost21,Reference Martini, Brusamolino and Del Bo27–Reference McNeil, Forest and Hintze31,Reference Kendall, Esfahani and Sanders34,Reference Felix, Tuano and Mallillin36,Reference Thivel, Fillon and Genin37,Reference Arguin, Gagnon-Sweeney and Pigeon40,Reference Harrington, Martin and Ravussin43) and ‘Prospective Food Consumption’(Reference Dubé, Tremblay and Lavoie7,Reference Drapeau, Blundell and Therrien8,Reference Salama, Drapeau and Tremblay11,Reference Drapeau, Blundell and Gallant13,Reference Polugrudov, Popov and Smirnov20,Reference Schmidt, Gregersen and Pedersen24,Reference Blanchet, Lemieux and Couture28–Reference McNeil, Forest and Hintze31,Reference Kendall, Esfahani and Sanders34,Reference Felix, Tuano and Mallillin36,Reference Thivel, Fillon and Genin37,Reference Arguin, Gagnon-Sweeney and Pigeon40,Reference Harrington, Martin and Ravussin43) . Drapeau et al. (Reference Drapeau, Blundell and Gallant13) also calculated a mean SQ with the SQ results corresponding to the four previous appetite sensations. In three of the acute studies, an SQ for ‘Satiety’ was calculated(Reference Polugrudov, Popov and Smirnov20,Reference Schmidt, Gregersen and Pedersen24,Reference Martini, Brusamolino and Del Bo27) . Hansen et al. (Reference Hansen, Sjodin and Ritz18) calculated what they named an Appetite Quotient (similar to SQ), based on composite appetite scores (with Hunger, Satiety, Fullness, Prospective Food Consumption and Desire To Eat). Gonzalez et al. (Reference Gonzalez, Frampton and Deighton33) also produced a composite SQ, whose equation is, however, not detailed. In their work, Hollingworth et al. (Reference Hollingworth, Dalton and Blundell15) did not detail in the publication which appetite sensation was used to calculate the SQ.
Timing of the sensations used
For the SQ calculation, out of the twenty-nine studies, twenty-three chose to define as ‘pre-meal sensations’, the sensations recorded immediately before the tested meal(Reference Dubé, Tremblay and Lavoie7,Reference Drapeau, Blundell and Therrien8,Reference Salama, Drapeau and Tremblay11,Reference Drapeau, Blundell and Gallant13,Reference Dalton, Hollingworth and Blundell14,Reference Hansen, Sjodin and Ritz18–Reference Polugrudov, Popov and Smirnov20,Reference Defries, Petkau and Gregor22,Reference Beaulieu, Hopkins and Blundell25,Reference Martini, Brusamolino and Del Bo27–Reference Kendall, Esfahani and Sanders34,Reference Felix, Tuano and Mallillin36,Reference Thivel, Fillon and Genin37,Reference Arguin, Gagnon-Sweeney and Pigeon40,Reference Harrington, Martin and Ravussin43) . The remaining six studies assessed pre-lunch sensations 1 h before the meal(Reference Chapman, Parker and Doran26), 20 min before the meal(Reference Bligh, Godsland and Frost21) or 5 min before the meal(Reference Schmidt, Gregersen and Pedersen24). Three studies did not specify the timing of the VAS(Reference Hollingworth, Dalton and Blundell15,Reference Thomas, Dourish and Tomlinson23,Reference Finlayson, Bordes and Griffioen-Roose35) . Two studies also assessed appetite feelings during the meal(Reference Thomas, Dourish and Tomlinson23,Reference Schmidt, Gregersen and Pedersen24) . Regarding the use of post-meal appetite sensations for calculating SQ, eight studies evaluated them up to 60 min after the end of food intake(Reference Dubé, Tremblay and Lavoie7,Reference Drapeau, Blundell and Therrien8,Reference Drapeau, Blundell and Gallant13,Reference Thomas, Dourish and Tomlinson23,Reference Blanchet, Lemieux and Couture28,Reference McNeil, Drapeau and Gallant29,Reference Gonzalez, Frampton and Deighton33,Reference Thivel, Fillon and Genin37) , five studies up to 120 min after the end of food intake(Reference Polugrudov, Popov and Smirnov20,Reference Martini, Brusamolino and Del Bo27,Reference Felix, Trinidad and Tuano32,Reference Kendall, Esfahani and Sanders34,Reference Felix, Tuano and Mallillin36) , 4 up to 180 min after the end of food intake(Reference Hansen, Sjodin and Ritz18,Reference Defries, Petkau and Gregor22,Reference Beaulieu, Hopkins and Blundell25,Reference McNeil, Forest and Hintze31) and 3 up to 240 min after the end of food intake(Reference Green, Delargy and Joanes6,Reference Salama, Drapeau and Tremblay11,Reference Arguin, Gagnon-Sweeney and Pigeon40) . Hopkins et al. (Reference Hopkins, Gibbons and Caudwell19) reported appetite sensations every hour after the end of the meal until the next meal, while Chapman et al. (Reference Chapman, Parker and Doran26) assessed appetite sensations up to 5 h after the end of the meal. Green et al. (Reference Green, Delargy and Joanes6) measured appetite sensations up to 75 min after food intake, Schmidt et al. (Reference Schmidt, Gregersen and Pedersen24) reported post-meal appetite sensations up to 25 min after the meal and finally, Harrington et al. (Reference Harrington, Martin and Ravussin43) reported post-meal appetite sensations immediately after the end of the meal. The study from Bligh et al. (Reference Bligh, Godsland and Frost21) reported appetite sensations up to 175 min after the start of food intake, while Dalton et al. (Reference Dalton, Hollingworth and Blundell14) reported these sensations up to 90 min after the start of the meal. The timing of VAS is summarised in detail in Table 3.
Type of meal
Finally, SQ was also calculated in response to different meals. Among the included acute studies, thirteen used a standardised fixed meal to calculate SQ(Reference Dubé, Tremblay and Lavoie7,Reference Drapeau, Blundell and Therrien8,Reference Drapeau, Blundell and Gallant13,Reference Bligh, Godsland and Frost21,Reference Defries, Petkau and Gregor22,Reference Blanchet, Lemieux and Couture28–Reference Au-Yeung, Jovanovski and Jenkins30,Reference Felix, Trinidad and Tuano32–Reference Kendall, Esfahani and Sanders34,Reference Felix, Tuano and Mallillin36,Reference Thivel, Fillon and Genin37) , while three used an individualised meal based on percentage of energy needs(Reference Dalton, Hollingworth and Blundell14,Reference McNeil, Forest and Hintze31,Reference Finlayson, Bordes and Griffioen-Roose35) and six used an ad libitum meal(Reference Polugrudov, Popov and Smirnov20,Reference Thomas, Dourish and Tomlinson23–Reference Chapman, Parker and Doran26,Reference Harrington, Martin and Ravussin43) . Six studies calculated the SQ on both types of meals: standardised and ad libitum (Reference Green, Delargy and Joanes6,Reference Salama, Drapeau and Tremblay11,Reference Hansen, Sjodin and Ritz18,Reference Hopkins, Gibbons and Caudwell19,Reference Martini, Brusamolino and Del Bo27,Reference Arguin, Gagnon-Sweeney and Pigeon40) . One study did not specify the type of meal used to calculate the SQ(Reference Hollingworth, Dalton and Blundell15). Table 3 details the different meals used in the included studies.
Acute studies conducted in children and adolescents
Main aim, population and design
The main aims, populations and used designs are presented in Table 4 and fully detailed in the Supplementary materials.
Table 4. Data detailed for children and adolescents acute studies
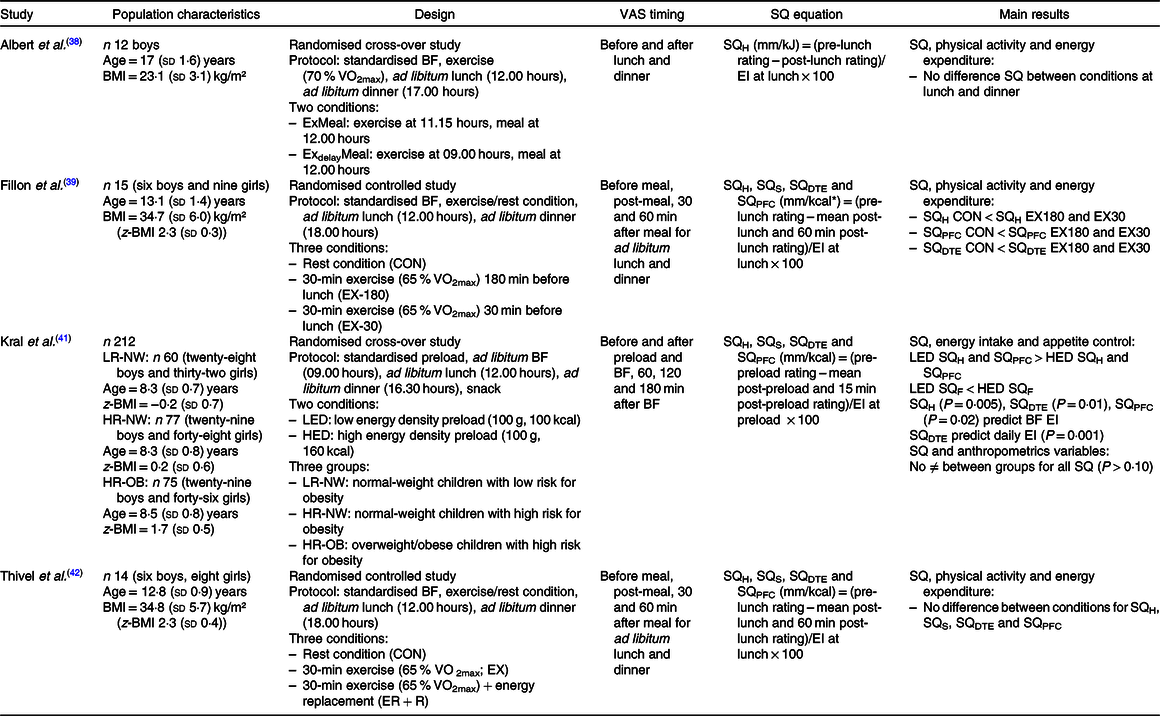
VAS, visual analogue scale; SQ, Satiety Quotient; BF, breakfast; H, hunger; EI, energy intake; S, satiety; DTE, desire to eat; F, fullness; PFC, prospective food consumption; LED, low energy density; HED, high energy density.
* To convert energy values from kcal to kJ, multiply by 4·184.
Methods
Calculation of Satiety Quotient
Three of the included studies used pen and paper VAS(Reference Albert, Drapeau and Mathieu38,Reference Fillon, Mathieu and Masurier39,Reference Thivel, Roche and Miguet42) , and Kral et al. did not specify the type of scale used(Reference Kral, Moore and Chittams41). In their studies, Thivel et al. and Fillon et al. used 150 mm scales(Reference Fillon, Mathieu and Masurier39,Reference Thivel, Roche and Miguet42) and Albert et al. and Kral et al. used 100 mm scales(Reference Albert, Drapeau and Mathieu38,Reference Kral, Moore and Chittams41) . Albert et al. (Reference Albert, Drapeau and Mathieu38) assessed ‘Desire To Eat ’, ‘Hunger’, ‘Fullness’, ‘Anticipated Food Consumption’, ‘Desire for specific food types’, ‘Palatability’, ‘Appreciation’ and ‘Visual appeal’. The others assessed ‘Desire To Eat ’, ‘Hunger’, ‘Fullness’ and ‘Prospective Food Consumption’(Reference Fillon, Mathieu and Masurier39,Reference Kral, Moore and Chittams41,Reference Thivel, Roche and Miguet42) .
Regarding the calculation of SQ, all of the included studies used the equation proposed by Drapeau et al. (Reference Drapeau, King and Hetherington10) (appetite sensation pre-meal – appetite sensation post-meal)/EI of eating episode × 100. While Albert et al. only used the immediate post-meal sensation in the equation(Reference Albert, Drapeau and Mathieu38), the three other studies used a mean of post-meal sensations assessed: immediately post-meal, 30 min and 60 min post-meal in Thivel et al. and Fillon et al.’s studies(Reference Fillon, Mathieu and Masurier39,Reference Thivel, Roche and Miguet42) and immediately post-meal and 15 min post-meal in Kral et al. (Reference Kral, Moore and Chittams41).
Although Albert et al. (Reference Albert, Drapeau and Mathieu38) assessed different appetite sensations, they only calculated the SQH, while the three other studies calculated the SQ for each of the appetite sensations assessed: Desire To Eat, Hunger, Fullness and Satiety(Reference Fillon, Mathieu and Masurier39,Reference Kral, Moore and Chittams41,Reference Thivel, Roche and Miguet42) . All studies calculated their SQ using an ad libitum lunch meal.
Chronic studies conducted in adults
Main aim, population and design
The main aims, populations and used designs are presented in Table 4 and fully detailed in the Supplementary materials.
Methods
Topics
Eighty-four percentage of the included chronic studies investigated the SQ in response to lifestyle changes (e.g. changing from inactive to active) or physiological modifications (e.g. pre- v. post-menopause in women)(Reference McNeil, Prud’homme and Strychar9,Reference Drapeau, King and Hetherington10,Reference Jönsson, Granfeldt and Erlanson-Albertsson44–Reference Carbonneau, Perron and Drapeau52,Reference Hintze, Goldfield and Seguin54–Reference Caudwell, Gibbons and Hopkins57,Reference Beaulieu, Casanova and Oustric59) , while three of these nineteen studies used SQ as a tool to classify the population as low and high satiety phenotype(Reference Arguin, Tremblay and Blundell12,Reference Drapeau, Jacob and Panahi53,Reference Buckland, Camidge and Croden58) .
Two observational studies were included and examined the association between SQ and the change of EI, BW and body composition over time(Reference McNeil, Prud’homme and Strychar9,Reference Drapeau, King and Hetherington10) .
Among the included interventional studies, seven assessed the effect of different dietary prescriptions on SQ(Reference Arguin, Tremblay and Blundell12,Reference Jönsson, Granfeldt and Erlanson-Albertsson44–Reference Golloso-Gubat, Magtibay and Nacis46,Reference Jönsson, Granfeldt and Lindeberg55,Reference Buckland, Camidge and Croden58,Reference Beaulieu, Casanova and Oustric59) , while two assessed the effect of different physical activity prescriptions on SQ(Reference King, Caudwell and Hopkins50,Reference Caudwell, Gibbons and Hopkins57) . One study investigated the effect of a prescription combining physical activity and dietary interventions on SQ(Reference Chaput, Pelletier and Despres47). One assessed the effect of weight change on SQ(Reference Gilbert, Drapeau and Astrup48) and three others more specifically on the effect of different energy restrictions on SQ change(Reference Drapeau, Jacob and Panahi53,Reference Hintze, Goldfield and Seguin54,Reference Beaulieu, Casanova and Oustric59) . Bédard and colleagues investigated the effect of sex on SQ(Reference Bédard, Hudon and Drapeau49) and Carbonneau et al. (Reference Carbonneau, Perron and Drapeau52) the effect of different nutritional labelling. Finally, the effect of probiotic(Reference Sanchez, Darimont and Panahi51) or pharmaceutical(Reference Halford, Boyland and Cooper56) compounds on the change of SQ was also tested.
Visual analogue scale
Fifteen studies used pen and paper VAS(Reference McNeil, Prud’homme and Strychar9,Reference Drapeau, King and Hetherington10,Reference Arguin, Tremblay and Blundell12,Reference Rodríguez-Rodríguez, Aparicio and Bermejo45–Reference Bédard, Hudon and Drapeau49,Reference Sanchez, Darimont and Panahi51–Reference Hintze, Goldfield and Seguin54,Reference Halford, Boyland and Cooper56,Reference Buckland, Camidge and Croden58,Reference Beaulieu, Casanova and Oustric59) , while the other four used electronic VAS. Of the fifteen that used the pen and paper method, six used 100 mm scales(Reference Rodríguez-Rodríguez, Aparicio and Bermejo45,Reference Golloso-Gubat, Magtibay and Nacis46,Reference Hintze, Goldfield and Seguin54,Reference Halford, Boyland and Cooper56,Reference Buckland, Camidge and Croden58,Reference Beaulieu, Casanova and Oustric59) , while the others used 150 mm scales(Reference McNeil, Prud’homme and Strychar9,Reference Drapeau, King and Hetherington10,Reference Arguin, Tremblay and Blundell12,Reference Chaput, Pelletier and Despres47–Reference Bédard, Hudon and Drapeau49,Reference Sanchez, Darimont and Panahi51–Reference Drapeau, Jacob and Panahi53) . With regard to electronic VAS, one study used a seven-point scale(Reference Jönsson, Granfeldt and Erlanson-Albertsson44), another used a scale ranging from –3 to 3(Reference Jönsson, Granfeldt and Lindeberg55) and finally, two studies did not specify the length of the scales used(Reference King, Caudwell and Hopkins50,Reference Caudwell, Gibbons and Hopkins57) .
Sixteen of the nineteen studies analysed ‘Hunger’(Reference McNeil, Prud’homme and Strychar9,Reference Drapeau, King and Hetherington10,Reference Arguin, Tremblay and Blundell12,Reference Rodríguez-Rodríguez, Aparicio and Bermejo45–Reference Hintze, Goldfield and Seguin54,Reference Halford, Boyland and Cooper56,Reference Caudwell, Gibbons and Hopkins57,Reference Beaulieu, Casanova and Oustric59) and fifteen assessed ‘Fullness’(Reference McNeil, Prud’homme and Strychar9,Reference Drapeau, King and Hetherington10,Reference Arguin, Tremblay and Blundell12,Reference Chaput, Pelletier and Despres47–Reference Hintze, Goldfield and Seguin54,Reference Halford, Boyland and Cooper56–Reference Beaulieu, Casanova and Oustric59) . Thirteen studies investigated ‘Desire To Eat’(Reference McNeil, Prud’homme and Strychar9,Reference Drapeau, King and Hetherington10,Reference Arguin, Tremblay and Blundell12,Reference Chaput, Pelletier and Despres47–Reference Sanchez, Darimont and Panahi51,Reference Drapeau, Jacob and Panahi53,Reference Hintze, Goldfield and Seguin54,Reference Halford, Boyland and Cooper56,Reference Caudwell, Gibbons and Hopkins57,Reference Beaulieu, Casanova and Oustric59) and twelve assessed ‘Prospective Food Consumption’(Reference McNeil, Prud’homme and Strychar9,Reference Drapeau, King and Hetherington10,Reference Arguin, Tremblay and Blundell12,Reference Chaput, Pelletier and Despres47–Reference Sanchez, Darimont and Panahi51,Reference Drapeau, Jacob and Panahi53,Reference Hintze, Goldfield and Seguin54,Reference Halford, Boyland and Cooper56,Reference Beaulieu, Casanova and Oustric59) . Two studies used a single scale with ‘Hunger’ and ‘Fullness’ as extremes(Reference Jönsson, Granfeldt and Erlanson-Albertsson44,Reference Jönsson, Granfeldt and Lindeberg55) .
Calculation of Satiety Quotient
Equations used
Seventy-four percentage of the included studies used the following equation proposed by Drapeau et al. (Reference Drapeau, King and Hetherington10,Reference Drapeau, Blundell and Gallant13) : (appetite sensation pre-meal – appetite sensation post-meal)/EI of eating episode × 100(Reference McNeil, Prud’homme and Strychar9,Reference Drapeau, King and Hetherington10,Reference Arguin, Tremblay and Blundell12,Reference Rodríguez-Rodríguez, Aparicio and Bermejo45,Reference Golloso-Gubat, Magtibay and Nacis46,Reference Gilbert, Drapeau and Astrup48–Reference Hintze, Goldfield and Seguin54,Reference Caudwell, Gibbons and Hopkins57,Reference Beaulieu, Casanova and Oustric59) . Buckland et al. (Reference Buckland, Camidge and Croden58) used the same equation, but they subtracted post-meal sensation from pre-meal sensation, because they evaluated just ‘Fullness’. Hintze et al. (Reference Hintze, Goldfield and Seguin54) reversed also the order of subtraction between appetite sensations contrary to what was done by Drapeau, subtracting pre-meal sensations from post-meal sensations, for SQF. Three studies used the same equation without multiplying the result by 100(Reference Jönsson, Granfeldt and Erlanson-Albertsson44,Reference Chaput, Pelletier and Despres47,Reference Halford, Boyland and Cooper56) , and one study did not clearly specify the equation used(Reference Jönsson, Granfeldt and Lindeberg55).
Appetite sensations used
On the nineteen chronic studies, fifteen calculated SQH(Reference McNeil, Prud’homme and Strychar9,Reference Drapeau, King and Hetherington10,Reference Arguin, Tremblay and Blundell12,Reference Rodríguez-Rodríguez, Aparicio and Bermejo45–Reference Gilbert, Drapeau and Astrup48,Reference King, Caudwell and Hopkins50–Reference Hintze, Goldfield and Seguin54,Reference Halford, Boyland and Cooper56,Reference Caudwell, Gibbons and Hopkins57,Reference Beaulieu, Casanova and Oustric59) , fourteen SQF(Reference McNeil, Prud’homme and Strychar9,Reference Drapeau, King and Hetherington10,Reference Arguin, Tremblay and Blundell12,Reference Jönsson, Granfeldt and Erlanson-Albertsson44,Reference Chaput, Pelletier and Despres47–Reference Bédard, Hudon and Drapeau49,Reference Sanchez, Darimont and Panahi51–Reference Halford, Boyland and Cooper56,Reference Buckland, Camidge and Croden58) and nine SQDTE(Reference McNeil, Prud’homme and Strychar9,Reference Drapeau, King and Hetherington10,Reference Arguin, Tremblay and Blundell12,Reference Chaput, Pelletier and Despres47,Reference Gilbert, Drapeau and Astrup48,Reference Sanchez, Darimont and Panahi51,Reference Drapeau, Jacob and Panahi53,Reference Hintze, Goldfield and Seguin54,Reference Halford, Boyland and Cooper56) and SQPFC(Reference McNeil, Prud’homme and Strychar9,Reference Drapeau, King and Hetherington10,Reference Arguin, Tremblay and Blundell12,Reference Chaput, Pelletier and Despres47,Reference Gilbert, Drapeau and Astrup48,Reference Sanchez, Darimont and Panahi51,Reference Drapeau, Jacob and Panahi53,Reference Hintze, Goldfield and Seguin54,Reference Halford, Boyland and Cooper56) (see Table 5).
Table 5. Population, design, methods and main results of adult chronic studies*
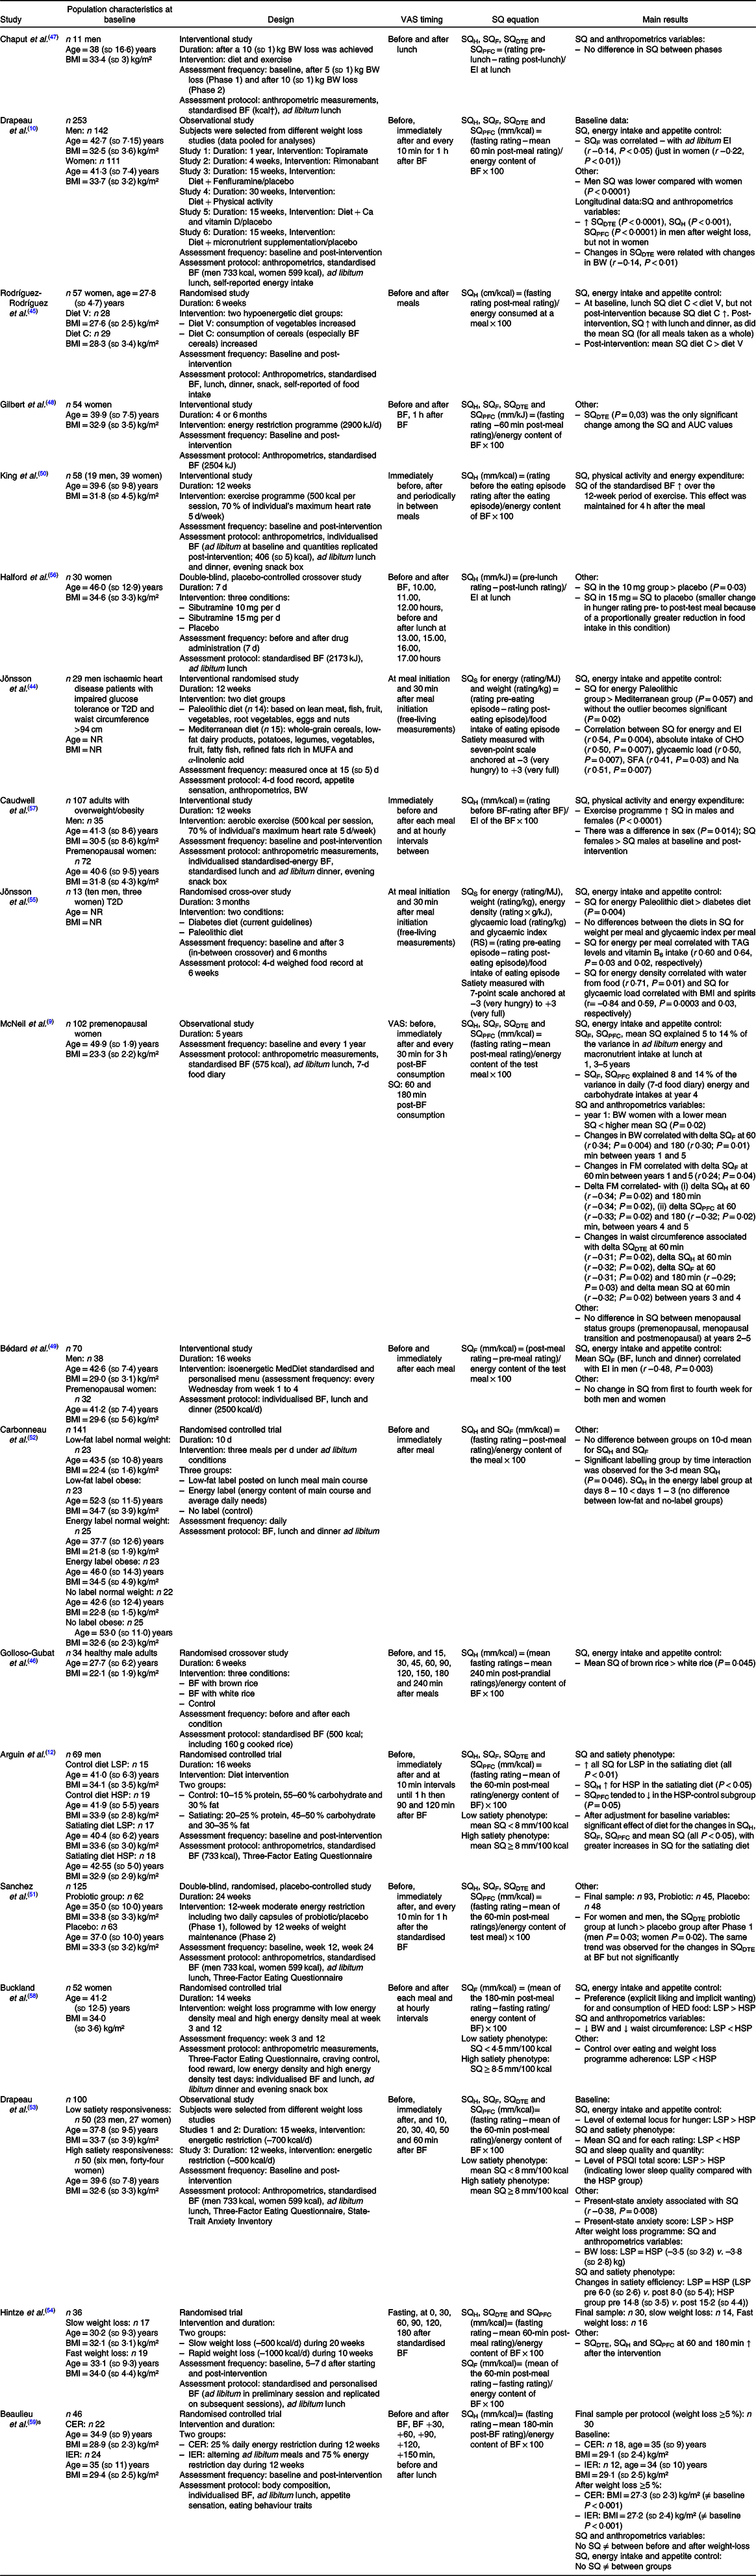
VAS, visual analogue scale; SQ, Satiety Quotient; BW, body weight; BF, breakfast; H, hunger; F, fullness; DTE, desire to eat; PFC, prospective food consumption; EI, energy intake; T2D, type 2 diabetes; NR, not reported; S, satiety; RS, resistant starch; LSP, low satiety phenotype; HSP, high satiety phenotype; CER, continuous energy restriction; IER, intermittent energy restriction.
* Only protocol is detailed that is relevant to SQ.
† To convert energy values from kcal to kJ, multiply by 4·184.
Timing of the sensations used
More specifically, all studies considered as ‘pre-meal appetite sensation’ the sensations given immediately before the meal. With regard to ‘post-meal appetite sensation’, five studies used only the sensations immediately after the meal(Reference Rodríguez-Rodríguez, Aparicio and Bermejo45,Reference Chaput, Pelletier and Despres47–Reference Bédard, Hudon and Drapeau49,Reference Carbonneau, Perron and Drapeau52) , and two studies considered the post-meal sensations as the sensations recorded 30 min after the start of ingestion(Reference Jönsson, Granfeldt and Erlanson-Albertsson44,Reference Jönsson, Granfeldt and Lindeberg55) . Others averaged appetite sensations immediately after eating with appetite sensations 1 h after eating(Reference Caudwell, Gibbons and Hopkins57), or every 10 min for 1 h(Reference Drapeau, King and Hetherington10,Reference Sanchez, Darimont and Panahi51,Reference Drapeau, Jacob and Panahi53) , or every 10 min for 1 h plus 90 min and 120 min after eating(Reference Arguin, Tremblay and Blundell12). Three studies used the average appetite sensation immediately after eating with the sensations reported every 30 min for 3 h(Reference McNeil, Prud’homme and Strychar9,Reference Hintze, Goldfield and Seguin54,Reference Beaulieu, Casanova and Oustric59) , while Halford et al. (Reference Halford, Boyland and Cooper56) and Buckland et al. (Reference Buckland, Camidge and Croden58) used the same protocol but with appetite sensation evaluations every hour for 3 h and not every 30 min. Finally, Golloso-Gubat et al. (Reference Golloso-Gubat, Magtibay and Nacis46) used the average of appetite sensation at 15, 30, 45, 60, 90, 120, 150, 180 and 240 min after the meal to calculate ‘post-meal appetite sensation’. One study(Reference King, Caudwell and Hopkins50) indicated that it had integrated in the calculation of the post-meal sensations the sensations of appetite immediately after the meal as well as sensations assessed periodically between the two meals (Table 5).
Type of meal
Out of the nineteen included studies, seventeen calculated the SQ in response to a standardised fixed meal(Reference McNeil, Prud’homme and Strychar9,Reference Drapeau, King and Hetherington10,Reference Arguin, Tremblay and Blundell12,Reference Golloso-Gubat, Magtibay and Nacis46,Reference Gilbert, Drapeau and Astrup48,Reference Sanchez, Darimont and Panahi51,Reference Drapeau, Jacob and Panahi53) , while five used an ad libitum meal(Reference Jönsson, Granfeldt and Erlanson-Albertsson44,Reference Rodríguez-Rodríguez, Aparicio and Bermejo45,Reference Chaput, Pelletier and Despres47,Reference Carbonneau, Perron and Drapeau52,Reference Jönsson, Granfeldt and Lindeberg55) with one study using both type of meals(Reference Halford, Boyland and Cooper56). Six studies(Reference Bédard, Hudon and Drapeau49,Reference King, Caudwell and Hopkins50,Reference Hintze, Goldfield and Seguin54,Reference Caudwell, Gibbons and Hopkins57–Reference Beaulieu, Casanova and Oustric59) calculated the SQ on an individualised meal based on a percentage of energy needs.
Main results
By adopting a systematic overview of all the included studies, a large heterogeneity is observed when it comes to the purpose of using SQ. While all details are presented in Tables 3–5, five main methodological uses of the SQ can be identified: (i) the association between SQ and EI(Reference Dubé, Tremblay and Lavoie7–Reference McNeil, Prud’homme and Strychar9,Reference Arguin, Tremblay and Blundell12,Reference Hollingworth, Dalton and Blundell15,Reference Hansen, Sjodin and Ritz18,Reference Hopkins, Gibbons and Caudwell19,Reference Bligh, Godsland and Frost21,Reference Defries, Petkau and Gregor22,Reference Beaulieu, Hopkins and Blundell25,Reference Martini, Brusamolino and Del Bo27,Reference Felix, Trinidad and Tuano32,Reference Felix, Tuano and Mallillin36,Reference Arguin, Gagnon-Sweeney and Pigeon40,Reference Jönsson, Granfeldt and Erlanson-Albertsson44–Reference Golloso-Gubat, Magtibay and Nacis46,Reference Bédard, Hudon and Drapeau49,Reference Hintze, Goldfield and Seguin54,Reference Jönsson, Granfeldt and Lindeberg55,Reference Buckland, Camidge and Croden58,Reference Beaulieu, Casanova and Oustric59) ; (ii) the association between the SQ and anthropometric variables(Reference Drapeau, Blundell and Therrien8–Reference Salama, Drapeau and Tremblay11,Reference Chaput, Pelletier and Despres47,Reference Gilbert, Drapeau and Astrup48,Reference Drapeau, Jacob and Panahi53,Reference Beaulieu, Casanova and Oustric59) ; (iii) the association between SQ and energy expenditure/physical activity(Reference Dubé, Tremblay and Lavoie7,Reference Dalton, Hollingworth and Blundell14,Reference Thivel, Fillon and Genin37,Reference Harrington, Martin and Ravussin43,Reference King, Caudwell and Hopkins50,Reference Caudwell, Gibbons and Hopkins57) ; (iv) the association between SQ and sleep quality and quantity(Reference Polugrudov, Popov and Smirnov20,Reference McNeil, Drapeau and Gallant29,Reference McNeil, Forest and Hintze31) and (v) SQ to classify individuals into low and high satiety phenotypes(Reference Drapeau, Blundell and Gallant13–Reference Hollingworth, Dalton and Blundell15,Reference Arguin, Gagnon-Sweeney and Pigeon40,Reference Drapeau, Jacob and Panahi53,Reference Buckland, Camidge and Croden58) .
The following sections present and categorise the main results observed in the included studies. While only the main methodological aspects and results related to the use of the SQ are detailed in this section, the Tables 3–5 present the full details of the included studies.
Association between Satiety Quotient and energy and macronutrient intake
First, four of the included studies demonstrate that SQ is a predictor of food intake(Reference Dubé, Tremblay and Lavoie7–Reference Drapeau, King and Hetherington10). The systematic analysis of these studies shows that SQF(Reference Drapeau, Blundell and Therrien8–Reference Drapeau, King and Hetherington10), SQH(Reference Dubé, Tremblay and Lavoie7), SQPFC(Reference McNeil, Prud’homme and Strychar9) and mean SQ(Reference McNeil, Prud’homme and Strychar9) predict EI and SQF predicts relative EI too (subtracting RMR from total EI)(Reference Drapeau, Blundell and Therrien8). A distinction is made in the studies between objectively measured EI and self-reported EI using food diaries, with SQDTE, SQH, SQF(Reference Dubé, Tremblay and Lavoie7) and SQPFC(Reference McNeil, Prud’homme and Strychar9) predicting reported EI only. More specifically, according to these studies, macronutrient intake could be predicted by SQF, SQPFC and mean SQ(Reference McNeil, Prud’homme and Strychar9), and SQF could also predict CHO intake in food diaries(Reference McNeil, Prud’homme and Strychar9). In children, Kral et al. (Reference Kral, Moore and Chittams41) suggest that energy density may influence satiety responsiveness and that SQ may predict IE.
Association between Satiety Quotient and anthropometric variables
Five of the included studies show associations between the SQ and anthropometric or body composition variables(Reference Drapeau, Blundell and Therrien8,Reference McNeil, Prud’homme and Strychar9,Reference Salama, Drapeau and Tremblay11,Reference Drapeau, Jacob and Panahi53,Reference Buckland, Camidge and Croden58,Reference Beaulieu, Casanova and Oustric59) . In regard to BW, we observe that individuals with high satiety phenotype lost more BW than those with a low satiety phenotype(Reference Arguin, Tremblay and Blundell12,Reference Drapeau, Jacob and Panahi53,Reference Buckland, Camidge and Croden58) , and we find the same conclusions regarding waist circumference in women with obesity(Reference Buckland, Camidge and Croden58). In fact, individuals with a high waist circumference had lower satiating effect determined by the SQF(Reference Salama, Drapeau and Tremblay11), and McNeil et al. (Reference McNeil, Prud’homme and Strychar9) showed in their 5-year study that changes in SQ were negatively correlated with the change in waist circumference. With regard to the relationship between SQ and fat mass, Salama et al. (Reference Salama, Drapeau and Tremblay11) found a positive relationship between % fat mass and SQF. In their longitudinal study, McNeil et al. (Reference McNeil, Prud’homme and Strychar9) found a positive correlation between the SQ and fat mass changes (delta) over the entire study, although they found a negative correlation between year 4 and year 5.
Association between Satiety Quotient and energy expenditure/physical activity
Three of the included studies show contradictory associations between SQ and exercise or the level of physical activity(Reference Beaulieu, Hopkins and Blundell25,Reference Harrington, Martin and Ravussin43,Reference King, Caudwell and Hopkins50,Reference Caudwell, Gibbons and Hopkins57) . Some cross-sectional results suggest a decrease in SQ, indicating a lower satiety responsiveness, in lean individuals with high activity-related energy expenditure(Reference Harrington, Martin and Ravussin43), while others show no effect of habitual physical activity level on SQ in non-obese individuals(Reference Beaulieu, Hopkins and Blundell25). In individuals with overweight and obesity, a 12-week exercise intervention led to increased satiety responsiveness to a fixed meal(Reference King, Caudwell and Hopkins50,Reference Caudwell, Gibbons and Hopkins57) .
With regard to studies in children, it can be observed that the timing between exercise and a meal(Reference Thivel, Fillon and Genin37,Reference Harrington, Martin and Ravussin43) or the use of an energy replacement strategy(Reference McNeil, Prud’homme and Strychar9) has no effect on SQ and that no particular association was found with SQ. However, a better satiety responsiveness (higher SQ) was observed when exercise is performed just before a meal v. a rest condition(Reference Harrington, Martin and Ravussin43).
Satiety Quotient to classify individuals into low and high satiety phenotypes
Six of the included studies support the SQ as a reliable tool to phenotype individuals based on their satiety responsiveness(Reference Arguin, Tremblay and Blundell12–Reference Hollingworth, Dalton and Blundell15,Reference Drapeau, Jacob and Panahi53,Reference Buckland, Camidge and Croden58) . Indeed, compared with individuals with a high satiety phenotype, individuals with a low satiety phenotype have higher EI, greater cravings for sweet foods, lower craving control, higher disinhibition and fasting Hunger, Desire To Eat and Prospective Food Consumption and exhibit a higher wanting for high-fat food(Reference Dalton, Hollingworth and Blundell14,Reference Hollingworth, Dalton and Blundell15,Reference Buckland, Camidge and Croden58) . The behavioural and psychological characteristics of the low satiety phenotype are associated with a greater susceptibility to overconsumption(Reference Dalton, Hollingworth and Blundell14,Reference Hollingworth, Dalton and Blundell15) . These results are also corroborated by another study, where Drapeau et al. indicate that the higher increase in cognitive restraint and a lower decrease in disinhibition in response to a weight loss intervention could increase the susceptibility of these individuals to weight gain(Reference Drapeau, Jacob and Panahi53), these results being in agreement with another work from Drapeau et al. (Reference Drapeau, Blundell and Gallant13) showing that SQ negatively correlated with the external locus for Hunger measured by the Three-Factor Eating Questionnaire. Moreover, Buckland et al. (Reference Buckland, Camidge and Croden58) found a weaker control over eating and weight loss programme adherence in people with a low satiety phenotype, as well as a lower weight loss compared with people with a high satiety phenotypes.
Discussion
While there has been a growing use of the SQ in clinical studies since its development by Green and colleagues in 1997(Reference Green, Delargy and Joanes6), little attention has been paid regarding its use since then and a high methodological heterogeneity can be observed between studies. A better understanding of the SQ and its clinical implication is of particular interest since, as shown by several studies, by including both pre-meal sensation and the energy content of the meal in its calculation, it seems to provide different information than appetite sensations alone. Indeed, some studies have observed different results for appetite sensations and SQ in response to various stimuli (such as exercise or sleep for instance)(Reference McNeil, Forest and Hintze31,Reference Thivel, Fillon and Genin37) . In that context, the present review aimed to systematically analyse the available evidence regarding the scientific and clinical use of the SQ. Fifty-two studies were included after our database search, thirty-three of them being cross-sectional/acute(Reference Green, Delargy and Joanes6–Reference Drapeau, Blundell and Therrien8,Reference Salama, Drapeau and Tremblay11,Reference Drapeau, Blundell and Gallant13–Reference Hollingworth, Dalton and Blundell15,Reference Hansen, Sjodin and Ritz18–Reference Thivel, Roche and Miguet42) and nineteen being longitudinal(Reference McNeil, Prud’homme and Strychar9,Reference Drapeau, King and Hetherington10,Reference Arguin, Tremblay and Blundell12,Reference Harrington, Martin and Ravussin43–Reference Beaulieu, Casanova and Oustric59) . The large majority of the included studies enrolled adults participants with only four enrolling children and adolescents(Reference Albert, Drapeau and Mathieu38,Reference Fillon, Mathieu and Masurier39,Reference Kral, Moore and Chittams41,Reference Thivel, Roche and Miguet42) .
According to our analysis, acute studies mainly used the SQ to compare the satiating effect of different kinds of meals varying in texture (liquid and solid)(Reference Green, Delargy and Joanes6,Reference Dalton, Hollingworth and Blundell14,Reference Hollingworth, Dalton and Blundell15,Reference Hansen, Sjodin and Ritz18,Reference Hopkins, Gibbons and Caudwell19,Reference Bligh, Godsland and Frost21,Reference Defries, Petkau and Gregor22,Reference Beaulieu, Hopkins and Blundell25,Reference Martini, Brusamolino and Del Bo27,Reference Blanchet, Lemieux and Couture28,Reference Au-Yeung, Jovanovski and Jenkins30,Reference Felix, Trinidad and Tuano32–Reference Felix, Tuano and Mallillin36,Reference Arguin, Gagnon-Sweeney and Pigeon40) , energy content(Reference Dalton, Hollingworth and Blundell14,Reference Blanchet, Lemieux and Couture28,Reference Gonzalez, Frampton and Deighton33,Reference Kral, Moore and Chittams41) or composition(Reference Green, Delargy and Joanes6,Reference Hollingworth, Dalton and Blundell15,Reference Hansen, Sjodin and Ritz18,Reference Hopkins, Gibbons and Caudwell19,Reference Bligh, Godsland and Frost21,Reference Beaulieu, Hopkins and Blundell25,Reference Martini, Brusamolino and Del Bo27,Reference Au-Yeung, Jovanovski and Jenkins30,Reference Kendall, Esfahani and Sanders34,Reference Felix, Tuano and Mallillin36,Reference Arguin, Gagnon-Sweeney and Pigeon40) . Some of these acute investigations also assessed the effect of sleep characteristics (i.e. timing, quality or duration)(Reference Polugrudov, Popov and Smirnov20,Reference McNeil, Drapeau and Gallant29,Reference McNeil, Forest and Hintze31) , exercise(Reference Dubé, Tremblay and Lavoie7,Reference Thivel, Fillon and Genin37) , mental work(Reference Salama, Drapeau and Tremblay11), sex(Reference Drapeau, Blundell and Therrien8) or pharmaceuticals(Reference Thomas, Dourish and Tomlinson23,Reference Schmidt, Gregersen and Pedersen24,Reference Chapman, Parker and Doran26) on the SQ. Regarding the interventional studies included in our analysis, they mainly used the SQ to evaluate the effect of different dietary and/or exercise interventions(Reference Arguin, Tremblay and Blundell12,Reference Jönsson, Granfeldt and Erlanson-Albertsson44–Reference Chaput, Pelletier and Despres47,Reference King, Caudwell and Hopkins50,Reference Sanchez, Darimont and Panahi51,Reference Drapeau, Jacob and Panahi53–Reference Jönsson, Granfeldt and Lindeberg55,Reference Caudwell, Gibbons and Hopkins57,Reference Beaulieu, Casanova and Oustric59) on the SQ. Finally, some studies (acute and chronic) used the SQ to classify individuals as low or high satiety phenotypes(Reference Drapeau, Blundell and Gallant13–Reference Hollingworth, Dalton and Blundell15,Reference Arguin, Gagnon-Sweeney and Pigeon40,Reference Drapeau, Jacob and Panahi53,Reference Buckland, Camidge and Croden58) .
Clinical utility and reliability of the Satiety Quotient
According to the present systematic approach, the use of the SQ might be a reliable predictor of both measured(Reference Dubé, Tremblay and Lavoie7–Reference Drapeau, King and Hetherington10,Reference Buckland, Camidge and Croden58) and reported(Reference Dubé, Tremblay and Lavoie7,Reference McNeil, Prud’homme and Strychar9,Reference Drapeau, King and Hetherington10) EI, as well as macronutrient intake(Reference McNeil, Prud’homme and Strychar9). Studies effectively highlight higher food consumption with lower satiety responsiveness to a meal (lower SQ) in type 1 diabetes(Reference Dubé, Tremblay and Lavoie7), healthy women(Reference Hollingworth, Dalton and Blundell15), men and women with overweight(Reference Drapeau, Blundell and Therrien8), premenopausal women(Reference McNeil, Prud’homme and Strychar9) and women with obesity(Reference Hintze, Goldfield and Seguin54,Reference Buckland, Camidge and Croden58) . This is reinforced by other results demonstrating negative associations between SQ and BW, waist circumference as well as fat mass(Reference McNeil, Prud’homme and Strychar9,Reference Salama, Drapeau and Tremblay11,Reference Drapeau, Jacob and Panahi53,Reference Buckland, Camidge and Croden58) . Importantly, Drapeau et al. (Reference Drapeau, Jacob and Panahi53) found a positive association between SQ and weight loss in response to an energy restriction intervention in men and women with obesity, like Buckland et al. (Reference Buckland, Camidge and Croden58) in women with obesity. The SQ has been used as a clinical tool to categorise people depending on their level of satiety responsiveness to a standardised fixed meal; a low phenotype characterising people who report difficulties in appropriately recognising their appetite sensations before or after a meal(Reference Drapeau, Blundell and Therrien8). These results are supplemented by those of Buckland et al. (Reference Buckland, Camidge and Croden58), which have shown that people with low satiety phenotype have a weaker control over eating and weight loss programme adherence compared with people with high satiety phenotype. Moreover, people with low satiety phenotype prefer and consume more of high energy density food than people with high satiety phenotype(Reference Buckland, Camidge and Croden58). While most studies use a median split to categorise low and high satiety phenotypes, in a clinical context, a low satiety phenotype might be observed in about 10 % of patients with obesity who declare themselves as unable to detect changes in their appetite, report a weak satiety response to a meal and even show an increase in appetite after a meal for some of them(Reference Drapeau, Hetherington, Tremblay, Preedy, Watson and Martin60). Altogether, these results suggest that the SQ is an interesting clinical indicator to identify adults at risk of overeating and thus could be used in preventive strategies and weight loss interventions. Moreover, while the literature seems to suggest the SQ and the SQ phenotype as complementary tools to already existing subjective methods (such as the evaluation of disinhibition using the Three-Factor Eating Questionnaire); providing additional information regarding the risk of overeating for instance; comparison studies are still missing and should be conducted.
Interestingly, while the SQ has been studied in the context of nutritional manipulations, some studies also examined its relationship and response to physical activity and exercise. According to these studies, moderate physical activity levels in lean individuals and exercise training in individuals with overweight and obesity are associated with a higher SQ, suggesting an improved satiety responsiveness(Reference Harrington, Martin and Ravussin43,Reference King, Caudwell and Hopkins50,Reference Caudwell, Gibbons and Hopkins57) . However, this was not the case in studies measuring SQ at an ad libitum meal in lean individuals with very high physical activity levels, one of which showing lower SQ(Reference Harrington, Martin and Ravussin43) and another showing similar SQ(Reference Beaulieu, Hopkins and Blundell25) than their less active counterparts. Using a different methodology to assess the satiety response to food (preload-test meal protocol), other studies have shown that physically active individuals have better ability to adjust subsequent EI following preloads differing in energy content(Reference Beaulieu, Hopkins and Blundell61,Reference Beaulieu, Hopkins and Long62) . These results, whether using the SQ or energy compensation following a preload as an indicator of satiety responsiveness, illustrate a relationship between physical activity, food intake and appetite control(Reference Beaulieu, Hopkins and Blundell63). Here again, it suggests the clinical interest of the SQ as part of multidisciplinary approaches developed to prevent and treat obesity in adults.
According to our systematic approach, only few (n 4 out of 52) studies very recently used the SQ among children and adolescents. Three of them investigated the effect of acute exercise on the subsequent satiating effect of a meal(Reference Albert, Drapeau and Mathieu38,Reference Fillon, Mathieu and Masurier39,Reference Thivel, Roche and Miguet42) and the last, the effect of different preload energy density on satiety responsiveness. While two of these studies did not observe any effect of an acute exercise bout on the SQ calculated on the following ad libitum meal(Reference Albert, Drapeau and Mathieu38,Reference Thivel, Roche and Miguet42) , Fillon et al. (Reference Fillon, Mathieu and Masurier39) found increased SQ for Hunger, Prospective Food Consumption and Desire To Eat after acute moderate intensity exercise in adolescents with obesity. Kral et al. (Reference Kral, Moore and Chittams41)and coworkers suggested a beneficial effect of a low energy density preload on satiety responsiveness in children. In addition to the lack of available evidence regarding the use of the SQ in youth, the absence of any validation study in his population must be highlighted. Indeed, it remains unknown whether the SQ is a clinically valid and reliable tool to be used in children and adolescents. Based on the increasing interest in the appetite control of children and adolescents, particularly in those with obesity, our research group recently conducted a methodological study assessing the reproducibility of SQ and its validity as an indicator of body corpulence and composition as well as of EI in adolescents with obesity(Reference Fillon, Masurier and Pereira64). Although SQH showed a relatively modest reproducibility, none of the other SQ variables were found reproducible, and no association was found with anthropometric variables, body composition or EI(Reference Fillon, Masurier and Pereira64). This clearly calls for caution when interpreting existing results and for further studies developing reliable tools to measure the satiating effect of food in this population.
Methodological considerations
Our systematic analysis reveals a high level of heterogeneity regarding the methods used (equation used, type of meal, timing of the measurements of appetite sensations, etc.). While the SQ has been suggested as reliable and reproducible in adults, especially men with obesity (ICC for the SQ mean of 0·67)(Reference Drapeau, Blundell and Gallant13,Reference Dalton, Hollingworth and Blundell14) , more studies are needed to assess its validity and reproducibility in various contexts and populations.
While forty-three out of the forty-eight adults studies included(Reference Green, Delargy and Joanes6–Reference Dalton, Hollingworth and Blundell14,Reference Hansen, Sjodin and Ritz18–Reference Polugrudov, Popov and Smirnov20,Reference Defries, Petkau and Gregor22–Reference Thivel, Fillon and Genin37,Reference Arguin, Gagnon-Sweeney and Pigeon40,Reference Harrington, Martin and Ravussin43–Reference Hintze, Goldfield and Seguin54,Reference Halford, Boyland and Cooper56–Reference Beaulieu, Casanova and Oustric59) used the equation initially developed by Green et al. (Reference Green, Delargy and Joanes6), others used derived equations(Reference Salama, Drapeau and Tremblay11,Reference Thomas, Dourish and Tomlinson23,Reference Chapman, Parker and Doran26,Reference Martini, Brusamolino and Del Bo27) or did not specify the equation used(Reference Hollingworth, Dalton and Blundell15,Reference Bligh, Godsland and Frost21,Reference Jönsson, Granfeldt and Lindeberg55) . Similarly, as detailed in the tables and results section, the VAS used (e.g. 100 v. 150 mm) and the timing of the measurements of appetite sensations, with some studies only using the post-meal appetite sensation while others using the mean of the appetite sensations for up to several hours post-meal, vary between studies making any comparisons difficult. Since appetite sensations are dynamic and postprandial effects might be detected and integrated by individuals at different post-meal intervals, it would be of interest to better examine the best postprandial timing to use when calculating SQ. Importantly, while the SQ has been validated under standardised conditions and mainly using a fixed meal(Reference Drapeau, Blundell and Therrien8,Reference Dalton, Hollingworth and Blundell14) , 37·5 % (n 18) of the included studies used an ad libitum meal to calculate the SQ(Reference Green, Delargy and Joanes6,Reference Salama, Drapeau and Tremblay11,Reference Hansen, Sjodin and Ritz18–Reference Polugrudov, Popov and Smirnov20,Reference Thomas, Dourish and Tomlinson23–Reference Martini, Brusamolino and Del Bo27,Reference Au-Yeung, Jovanovski and Jenkins30,Reference Arguin, Gagnon-Sweeney and Pigeon40,Reference Harrington, Martin and Ravussin43,Reference Jönsson, Granfeldt and Erlanson-Albertsson44,Reference Chaput, Pelletier and Despres47,Reference Carbonneau, Perron and Drapeau52,Reference Jönsson, Granfeldt and Lindeberg55,Reference Halford, Boyland and Cooper56) . Gonzalez et al. examined the accuracy of the SQ depending on the energy content of the ingested meal and observed a better reproducibility and reliability of SQ (mean SQ as well as SQH, SQF, SQPFC, SQS) in response to higher energy content compared with meals of lower energy content(Reference Gonzalez, Frampton and Deighton33). Finally, while the validity of the SQ among men(Reference Drapeau, Blundell and Gallant13) and women(Reference Dalton, Hollingworth and Blundell14) was suggested, it has been widely used among specific populations such as individuals with diabetes(Reference Dubé, Tremblay and Lavoie7,Reference Chapman, Parker and Doran26) , premenopausal women(Reference McNeil, Prud’homme and Strychar9,Reference Blanchet, Lemieux and Couture28) , people with different levels of physical activity(Reference Beaulieu, Hopkins and Blundell25), people with overweight and obesity(Reference Drapeau, Blundell and Therrien8,Reference Drapeau, King and Hetherington10,Reference Arguin, Tremblay and Blundell12,Reference Drapeau, Blundell and Gallant13,Reference Hopkins, Gibbons and Caudwell19,Reference Schmidt, Gregersen and Pedersen24,Reference Chapman, Parker and Doran26,Reference McNeil, Drapeau and Gallant29,Reference Rodríguez-Rodríguez, Aparicio and Bermejo45,Reference Chaput, Pelletier and Despres47,Reference Caudwell, Gibbons and Hopkins57,Reference Beaulieu, Casanova and Oustric59) and shows a highly variable degree of correlations between studies (as detailed in Tables 3 and 5). Once more, this must lead us to interpret these results with caution and calls for more methodological validations.
Conclusion
While the current systematic review suggests the reliability of the SQ in adults and encourages its use as an interesting clinical tool regarding the satiety responsiveness to a meal and its changes in response to weight loss, we also encourage the adoption of a more standardised use of the SQ as well as the development of additional studies assessing its validity in several contexts and populations, especially among children and adolescents. Further studies should also be conducted to identify the potential biological markers associated with this SQ. Based on the present systematic analysis, we encourage future studies to assess SQ for Hunger, Fullness, Desire To Eat and Prospective Food Consumption after an overnight fast in response to a standardised fixed meal, without intense physical activity, and to consistently use a validated equation (such as the one initially proposed by Drapeau et al. (Reference Drapeau, King and Hetherington10,Reference Drapeau, Blundell and Gallant13) ). This would allow for more reliable outcomes and better comparisons across studies.
Acknowledgements
The authors would particularly like to thank Mr Denis Arvisais, documentalist at the University of Montreal, who helped them during the collection of the studies. They also thank the Mitacs Globalink grant, which supported this work.
This research received no specific grant from any funding agency, commercial or not-for-profit sectors.A. F., D. T., V. D. and A. T. conceived the idea and conceptualised the review. A. F. and D. T. conducted the study selection, data extraction and methodological quality assessment. A. F. drafted the initial manuscript. A. F., D. T., K. B. and V. D. contributed to writing the manuscript. All authors read and approved the final manuscript.
The authors have no conflicts of interest to disclose. The authors have no financial relationships relevant to this article to disclose.
Supplementary material
For supplementary material referred to in this article, please visit https://doi.org/10.1017/S0007114520002457


