


Adequate EPA (20:5n-3) and DHA (22:6n-3), exerting important effects on neurological and immunological systems, have been linked to longer gestation, improved perinatal outcomes and better neuro-/visual development in offspring(Reference Oken and Belfort1–Reference Bernard, Agostini and Forhan4). EPA and DHA depletion likely happen to pregnant or lactating women, due to increased demands for maternal deposition and fetal or infant development(Reference Otto, Houwelingen and Antal5,Reference Kawabata, Kagawa and Kimura6) . EPA and DHA predominantly depend on dietary intake, since they are not sufficiently converted in vivo. For example, the conversion rate from α-linolenic acid (ALA, 18:3n-3) to EPA is approximately 21 % and 9 % to DHA(Reference Burdge and Wootton7). EPA and DHA are abundant in aquatic products, especially in marine fish oils and flesh of oily fish, with per 100 g containing approximately 133 mg of EPA plus DHA(Reference Tvrzicka, Kremmyda and Stankova8). WHO and FAO of the United Nations recommended a minimum intake of 300 mg EPA plus DHA per day for pregnant and lactating women(9,10) .
However, the maternal EPA plus DHA intakes in most countries were lower than the recommendation and differed significantly across countries(Reference Otto, van Houwelingen and Badart-Smook11–Reference Friesen and Innis14). The intakes in American and Canadian pregnant women were 98 mg/d and 160 mg/d, respectively(Reference Zhang, Fulgoni and Kris-Etherton13,Reference Friesen and Innis14) and were 220 mg/d and 135 mg/d for Dutch women in early pregnancy and lactation, respectively(Reference Otto, van Houwelingen and Badart-Smook11,Reference Otto, Houwelingen and van Badart-Smook12) . Maternal intakes were even less in developing countries(Reference Mani, Dwarkanath and Thomas15,Reference Nishimura, Barbieiri and de Castro16) . Insufficient dietary intake can lead to poor DHA and EPA status. The concentrations of a combination of DHA plus EPA in erythrocytes, also called n-3 index, were 5·5 % for early/mid-pregnant women in Belgium(Reference Hoge, Bernardy and Donneau17), 7·1 % for late pregnant women in Italy(Reference Massari, Novielli and Mando18) and 6·4 % and 5·5 % for late pregnant and lactating women in Germany, respectively(Reference Gellert, Schuchardt and Hahn19), all lower than the optimal range 8–11 %(Reference Von Schacky20).
The concentration varied with physiological stages. Studies from Germany, Japan and the USA consistently showed a decreasing trend of DHA plus EPA concentration from pregnancy to postpartum(Reference Gellert, Schuchardt and Hahn19,Reference Kitamura, Kogomori and Hamano21,Reference Stark, Beblo and Murthy22) , but not for EPA alone. The EPA concentration decreased in British, Spanish and Japanese women(Reference Kitamura, Kogomori and Hamano21,Reference Miles, Noakes and Lefkothea-Stella23,Reference Matorras, Ruiz and Perteagudo24) , but increased in African-American women or Dutch women, from mid- or late pregnancy to postpartum(Reference Otto, Houwelingen and van Badart-Smook12,Reference Stark, Beblo and Murthy22) , suggesting disparities of EPA status in different population and geographic regions. For Chinese women, especially for lactating women, little is known about the EPA or EPA plus DHA status. To our knowledge, besides our previous study on DHA status in pregnant and lactating women(Reference You, Hong-Tian and Leonardo25), only one Chinese study has examined the DHA and EPA status in 138 pregnant women(Reference Zhang, Wang and Meng26).
Therefore, the purposes of the present study were to (1) investigate the concentrations and trends of EPA plus DHA and EPA alone in pregnant and lactating women living distinct regions of China and (2) evaluate potential factors that could influence the concentrations.
Subjects and methods
Subjects
In this cross-sectional study, women during mid-pregnancy (17 ± 2 gestational weeks), late pregnancy (39 ± 2 gestational weeks) or lactation (42 ± 7 d postpartum) were recruited while attending a prenatal or postnatal care visit between May and July of 2014 in hospitals in three cities of China: Weihai (coastland), Yueyang (lakeland) and Baotou (inland), which has been described in detail elsewhere(Reference You, Hong-Tian and Leonardo25,Reference Liu, Li and Yu27,Reference Zhou, Li and Leonardo28) . The eligibility criteria of study participants were (1) generally healthy women aged 18–35 years who have not been diagnosed with cardiovascular, metabolic, renal diseases or mental disorder; (2) having a singleton pregnancy or delivering a healthy singleton who was currently breastfed and (3) local residents of one of the three cities. Women were excluded if they were (1) suffering from severe vomiting after 16 weeks of gestation; (2) being allergic to fish, shrimp, shellfish or other foods enriched with DHA; (3) having severe heart, liver, kidney or lung disorders or serious mental health problems or (4) participating in another research study within previous 30 d. A total of 1254 women during pregnancy or lactation were initially enrolled, forty-three women were excluded due to failure to meet inclusion criteria. For this present analysis, women with EPA below the limit of detection (0·01 % for EPA weight percentage of total fatty acids, n 196)(29,30) were further excluded and 1015 were finally included in the analysis (online Supplementary Fig. 1).
The study protocol was approved by the Institutional Review Board/Human Subjects Committee at Peking University Health Science Center (IRB00001052–14 012). All women were informed about the study procedures and gave signed informed consent.
Baseline data and blood sample collection
During enrollment, each woman completed a self-administered questionnaire containing information on characteristics related to birthdate, ethnicity, education, height, pre-pregnancy weight and parity. For pregnant women, gestational age at enrolment was calculated by subtracting the date of last menstrual period from date of enrolment. For lactating women, self-reported information on gestational age at delivery, delivery mode and breast-feeding mode was collected and checked against medical records by trained obstetricians or nurses.
Dietary information over the past month was collected using a newly designed, electronic, DHA-specific, semi-quantitative FFQ, as described previously(Reference Liu, Li and Yu27,Reference Zhou, Li and Leonardo28,Reference Zhou, Yan and Li31) . The FFQ was developed originally to capture all DHA-containing foods mentioned in China Food Composition Table (Version 2009)(Reference Yang, Wang and Pan32), including marine aquatic products (seventy-five items such as mackerel, lobster and crab), freshwater aquatic products (thirty-eight items such as carp, shrimp and river crab) and mutton. For each food item, the standard portion size with nine options ranging from 25 g to 250 g and the frequency of consumption with twelve options ranging from ‘once per month’ to ‘three times per day’ were categorised. The average daily dietary intake was calculated as converting the reported frequency of consumption to per day, and then multiplying by the average amount of that food per time. Additional dietary information on the formula containing DHA was also collected.
A fasting venous blood sample (about 5 ml) was taken from each woman and collected into EDTA-containing tubes. Detailed methods for blood processing, storage and transportation have been described in our previous studies(Reference You, Hong-Tian and Leonardo25,Reference Liu, Li and Yu27,Reference Zhou, Li and Leonardo28) . In brief, all blood samples were kept in a refrigerator at 5°C for approximately 30 min before plasma, erythrocyte were separated by centrifugation at 3000 g for 10 min and the erythrocytes were further washed out with 0·9 % (w/v) saline. Then the plasma and erythrocyte specimens were immediately stored at –20°C in the local hospitals for about 10 d before being transferred on dry ice to the central laboratory and stored at –80°C until analysis.
Fatty acid analysis
The fatty acid analysis has been described in detail previously(Reference You, Hong-Tian and Leonardo25). The total lipids were extracted from plasma and erythrocyte specimens according to a modified method described by Folch et al. (Reference Folch, Lees and Sloane Stanley33) and were analysed to determine fatty acids concentrations using Agilent 6890N capillary gas chromatography (Agilent Technologies). The specimens were mixed with internal standard solution containing methyl undecanoate (C11:0), then with boron trifluoride and methanol. The mixture was heated at 115°C for 20 min, subsequently cooled to room temperature and extracted with n-hexane. Finally, the n-hexane-containing methyl esters of total lipids were analysed by capillary GC equipped with a capillary column (CP-Sil 88, 50 m, 0·25 mm i.d., 0·20 μm film) and a flame ionisation detector at 280°C. The injector temperature was held at 250°C (split ratio of 1:5). The oven temperature was programmed 2°C /min from 120°C to 166°C, held there for 10 min, then temperature-programmed 2°C/min to 200°C and held there for 10 min. Fatty acids were individually identified by comparing with reference standards, and related data were collected by the Agilent Open LAB software (Agilent Technologies). The relative concentrations of EPA and DHA were expressed as their percentages of total fatty acids.
Statistical analysis
Categorical variables were expressed as frequency (percentage) and continuous variables as mean (standard deviation). χ 2 test or ANOVA was used to compare maternal characteristics among physiological period and geographic region. Logarithmic transformations were applied to normalise skewed distributions in concentrations of EPA plus DHA and EPA alone. Values were back-transformed by exponentiating and presented as geometric mean (GM) with 95 % CI. Multivariable linear regression models were used to test the differences in adjusted GM of EPA plus DHA and EPA concentrations across categories of physiological period, geographic region and other socio-demographic characteristics, and post hoc Bonferroni tests were further used for multiple comparisons.
Multivariable linear regression models were also used to explore potential influencing factors for EPA plus DHA and EPA concentrations. The variables in multivariable models included maternal age (18·0–24·9, 25·0–29·9 and 30·0–34·9 years), education (middle school or less, high school and college or above), ethnicity (Han and others), annual family income per capita (< 30 000, 30 000–50 000 and ≥ 50 000 Yuan), parity (nulliparous and multiparous), pre-pregnancy BMI (< 18·5, 18·5–23·9 and ≥ 24·0 kg/m2), physiological period (mid-pregnancy, late pregnancy and lactation), geographic region (coastland, lakeland and inland) and dietary intake (low and high) of aquatic products, mutton and formula (yes and no); delivery mode (vaginal delivery and cesarean delivery) and breast-feeding mode (exclusive breast-feeding and partial breast-feeding) were additionally included in the models for lactating women. A sensitivity analysis where EPA concentrations below the limit of detection were imputed using the value of the half limit of detection (0·005 %) was performed(29,30) , and the results were similar to those in the available data analysis (online Supplementary Table 1). To explore the coherence of the results, stratified analyses were performed according to physiological period and geographic region, respectively.
To reveal the relationships of logarithmic plasma with erythrocyte EPA plus DHA and EPA alone, multivariable fractional polynomial models with generalised linear regression were performed(Reference Shewhart and Wilks34,Reference Royston, Ambler and Sauerbrei35) . Because the nonlinear relationships and multivariable fractional polynomial-algorithm-based inflection points were observed, separate linear regression with knot values of 1·3 % for logarithmic EPA plus DHA and 0·3 % for EPA in erythrocytes that were then conducted.
All analyses were performed using SPSS version 24.0 (IBM; Corp), and a two-side P < 0·05 was considered as statistically significant.
Results
Maternal characteristics
The mean age of the 1015 pregnant and lactating women was 27·7 ± 3·0 (range, 18·8 to 35·0) years. Women residing in lakeland v. those in coastland and inland areas were more likely to be younger, to have lower education, higher annual family income per capita and lower pre-pregnancy BMI (P < 0·01). Women in inland v. those in coastland and lakeland areas were more likely to be ethnic minority and to have had a cesarean section (P < 0·01). Details of maternal characteristics according to geographic region and physiological period are presented in Table 1.
Table 1. Maternal characteristics by geographic region and physiological period*
(Numbers and percentages; mean values and standard deviations)

* The en dash in subgroups of delivery mode and feeding mode represents unavailable information.
Concentrations of EPA plus DHA and EPA alone
Overall, the GM (95 % CI) of EPA plus DHA and EPA concentrations were 2·56 % (1·39, 4·72 %) and 0·31 % (0·08, 1·29 %) in plasma and 6·63 % (4·23, 10·39 %) and 0·40 % (0·18, 0·90 %) in erythrocytes, respectively. The concentrations significantly varied by geographic regions (Table 2). The adjusted GM of EPA plus DHA concentrations in both plasma and erythrocytes were highest in coastland area (2·87 %, 2·70, 3·05 %; 7·40 %, 7·07, 7·75 %), followed by lakeland (2·39 %, 2·25, 2·54 %; 6·62 %, 6·34, 6·92 %) and lowest in inland (2·25 %, 2·13, 2·38 %; 5·72 %, 5·49, 5·96 %) (P trend < 0·001), whereas the adjusted GM for EPA concentrations in plasma and erythrocytes were higher in inland (0·33 %, 0·29, 0·38 %; 0·43 %, 0·40, 0·47 %) and coastland areas (0·30 %, 0·26, 0·35 %; 0·42 %, 0·39, 0·46 %), as compared with those in lakeland (0·23 %, 0·20, 0·27 %; 0·36 %, 0·33, 0·39 %) (P < 0·001).
Table 2. Geometric mean (95 % CI) of EPA plus DHA and EPA concentrations (%) by maternal characteristics*
(Mean values and 95 % confidence intervals)
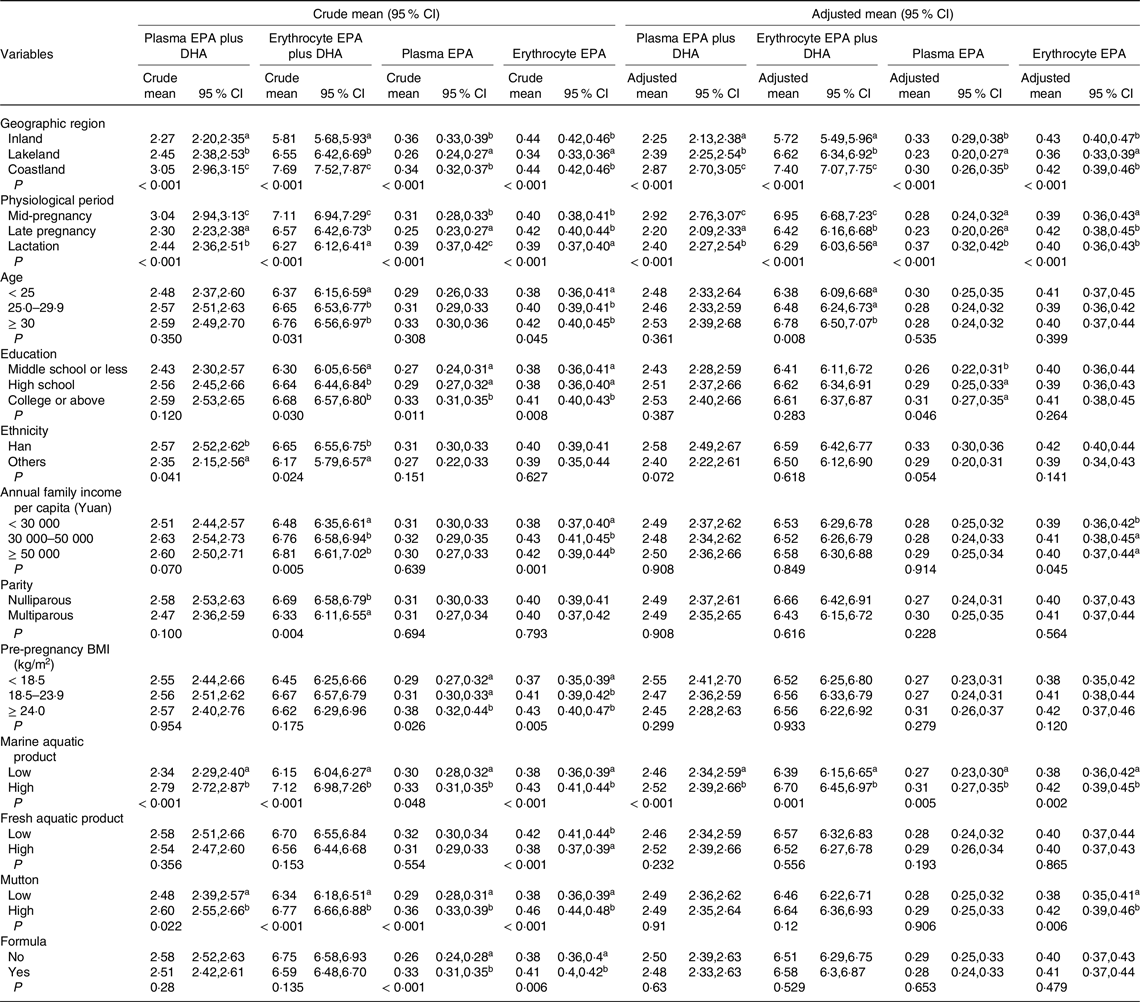
* Values in a column that do not share a common superscript letter differed with the use of Bonferroni-correction procedures for multiple comparisons: a < b < c, P < 0·05. P values for crude and adjusted geometric means are from univariate and multivariable linear regression, respectively, adjusted for maternal age, education, ethnicity, annual family income per capita, parity, pre-pregnancy BMI, physiological period, geographic region and dietary intakes of aquatic product, mutton and formula.
The concentrations also differed by physiological periods (Table 2). The adjusted GM (95 % CI) of EPA plus DHA concentrations in plasma and erythrocytes decreased from mid-pregnancy (2·92 %, 2·76, 3·07 %; 6·95 %, 6·68, 7·23 %) to late pregnancy (2·20 %, 2·09, 2·33 %; 6·42 %, 6·16, 6·68 %) and lactation (2·40 %, 2·27, 2·54 %; 6·29 %, 6·03, 6·56 %) (P trend < 0·001). In contrast, the EPA concentrations did not show significantly linear trends from pregnancy through lactation, with a higher plasma concentration in lactating women and a higher erythrocyte concentration in late-pregnant women. The patterns of EPA plus DHA and EPA concentrations by physiological periods were consistently observed in strata of geographic regions (Fig. 1). The multivariable linear regression models on the associations of EPA plus DHA and EPA with geographic region and physiological period showed similar results (Table 3).

Fig. 1. Geometric mean (95 % CI) of EPA plus DHA and EPA concentrations (%) by geographic region across physiological periods. ![]() , Mid-pregnancy;
, Mid-pregnancy; ![]() , late pregnancy;
, late pregnancy; ![]() , lactation
, lactation
Table 3. Regression coefficient (β) and 95 % confidence interval (95 % CI) of EPA plus DHA and EPA concentrations by maternal characteristics*
(Regression coefficient and 95 % confidence interval)

* P values for crude and adjusted β coefficients are from univariate and multivariable linear regression, respectively, adjusted for maternal age, education, ethnicity, annual family income per capita, parity, pre-pregnancy BMI, physiological period, geographic region and dietary intakes of aquatic product, mutton and formula.
† The values represents P < 0·05.
The adjusted GM of EPA plus DHA and EPA concentrations were higher in women with older age, higher educational status, higher annual family income per capita, higher dietary intakes of marine aquatic product and higher dietary intakes of mutton (Table 2). Consistently, the multivariable linear regression models showed positive associations of the concentrations with maternal age, educational status, annual family income per capita, dietary intakes of marine aquatic product and mutton (Table 3). Most of the associations persisted across pregnancy and lactation (online Supplemental Table 2). During lactation, maternal EPA concentration in erythrocytes appeared lower in women who exclusively breastfed their infants as compared with those who partially breastfed (online Supplemental Table 2).
Relationship of plasma with erythrocyte EPA plus DHA and EPA alone
The relationship between logarithmic plasma and erythrocyte concentrations of EPA plus DHA was J-shaped (P < 0·01 for nonlinearity, power p = 1 and q = 2), with a nadir at 1·3 % of erythrocyte EPA plus DHA, whereas the relationship for EPA concentrations was inversely J-shaped (P < 0·01 for nonlinearity, power p = 1 and q = 3), with an apex at 0·3 % of erythrocyte EPA (Fig. 2). In the segmented analysis based on inflection point, a significant linear relationship was observed in women with erythrocyte EPA plus DHA concentration ≥ 1·3 % (n 999; β = 1·01, P < 0·001) but not in those with the concentration < 1·3 % (n 16; adjusted β = –0·14, P = 0·71), and observed in women with erythrocyte EPA concentration < 0·3 % (n 1002; β = 1·08, P < 0·001), but not in those with the concentration ≥ 0·3 % (n 13; adjusted β = –1·84, P = 0·62). Similar linear pattern persisted in most subgroups stratified by physiological periods and geographic regions (online Supplementary Table S3).

Fig. 2. The relationships between logarithmic plasma and erythrocyte concentrations of EPA plus DHA and EPA alone. The relationships were assessed using multivariable fractional polynomial models with generalised linear regression, adjusted for maternal age, education, ethnicity, annual family income per capita, parity, pre-pregnancy BMI, physiological period and geographic region.
Discussion
In this large cross-sectional study in China, maternal EPA plus DHA concentrations in both plasma and erythrocytes were higher in the coastland/lakeland than in the inland and decreasing from mid-pregnancy to late pregnancy and lactation. Maternal EPA concentrations also varied by physiological periods but with different trends in plasma and erythrocytes, as concentration in plasma was higher in lactating women, while concentration in erythrocytes was higher in late-pregnant women. Regarding geographic variations, the EPA concentrations in both plasma and erythrocytes were higher in the inland and coastland v. in the lakeland. In addition, maternal age, education, annual family income per capita and breast-feeding mode were also related to the concentrations of EPA plus DHA or EPA alone.
The decreasing trends in EPA plus DHA concentrations from mid-pregnancy to lactation in our Chinese population were consistent to the findings from German, Japanese and the American women(Reference Gellert, Schuchardt and Hahn19,Reference Kitamura, Kogomori and Hamano21,Reference Stark, Beblo and Murthy22) , which was probably attributed to the change in DHA status(Reference Miles, Noakes and Lefkothea-Stella23,Reference You, Hong-Tian and Leonardo25) , a dominant contributor to the sum of EPA plus DHA. This decline in maternal DHA concentrations has been suggested to be due to the transfer from the mother to fetus via placenta during pregnancy or to infants via breast milk during lactation, to meet offspring demands for development(Reference Otto, Houwelingen and van Badart-Smook12,Reference Larque, Demmelmair and Gil-Sanchez36,Reference Hornstra37) . An alternate possibility is that the decline might be related to lipolysis of hepatic de novo lipogenesis and adipose tissue that accompanies the diminished insulin sensitivity during pregnancy, which might cause a lower concentration of EPA plus DHA(Reference Kuipers, Luxwolda and Sang38). Unlike the sum of EPA plus DHA, the concentration of EPA alone in plasma was higher in lactation while the concentration in erythrocytes was higher in late pregnancy in the study. The inconsistent pattern in plasma and erythrocytes was possibly because EPA in erythrocytes reflects intakes aggregated over the lifespan of ∼120 d(Reference Arab39). Several studies reported a decreasing trend of plasma EPA concentration throughout pregnancy in British and Japanese women(Reference Kitamura, Kogomori and Hamano21,Reference Miles, Noakes and Lefkothea-Stella23) and for erythrocyte EPA concentrations in Spanish women(Reference Matorras, Ruiz and Perteagudo24). Nevertheless, some previous studies reported that the maternal EPA concentrations both in plasma and erythrocytes significantly increased from mid- or late pregnancy to postpartum in African-American women and Dutch women, similar to our findings(Reference Otto, Houwelingen and van Badart-Smook12,Reference Stark, Beblo and Murthy22) . These results suggested that the synthesis and metabolism of EPA and DHA in vivo might follow different mechanisms from pregnancy to lactation(Reference Otto, Houwelingen and van Badart-Smook12). As pregnancy progresses, the efficiency at converting ALA to EPA was 12- to 29-fold higher than that at ALA to DHA(Reference Vermunt, Mensink and Hornstra40,Reference Salem, Pawlosky and Wegher41) . Given that the metabolic pathway of ALA-to-DHA was mediated by EPA, the limited capacity for EPA conversion might be constrained severely for DHA conversion(Reference Burdge and Wootton7).
The erythrocyte EPA plus DHA concentrations in our population (6·63 %) was higher than African-American (< 4·23 %)(Reference Stark, Beblo and Murthy22), Chilean (< 6·0 %)(Reference Barrera, Valenzuela and Chamorro42) and German women (6·23 %)(Reference Gellert, Schuchardt and Hahn19), whereas lower than Norwegian (> 6·8 %)(Reference Markhus, Rasinger and Malde43) and Japanese women (> 7·53 %)(Reference Kawabata, Kagawa and Kimura6). The erythrocyte EPA concentration in our population (0·40 %) was substantially lower than those aforementioned women (0·55 % to 1·03 %) except for African-American women (< 0·35 %). The inconsistent results were likely due to different population or region.
A recent review included 298 original studies from fifty-four countries/regions found that the EPA plus DHA concentration in healthy adults was > 8 % in coastal countries surrounding Sea of Japan or adjoining Scandinavia, but < 4 % in countries like USA, Brazil or Africa(Reference Stark, Van Elswyk and Higgins44). Similarly, we found higher EPA plus DHA concentrations in coastland and lakeland areas v. inland. We also found that maternal EPA concentration in inland area was similar to coastland but higher than those in lakeland, inconsistent with a European study that reported higher maternal EPA concentration in coastal countries than in land countries(Reference Otto, Houwelingen and Antal5). The different patterns in EPA by geographic regions was possibly due to different dietary habits. In our study, higher intake of mutton was linked to higher erythrocyte EPA concentration, and the inland women was recruited from Inner Mongolia where mutton was commonly consumed(Reference Liu, Li and Yu27), likely increasing the exogenous intake of EPA. The EPA content in mutton is approximately 100 mg per 100 g, higher than those in aquatic products even in some marine aquatic products (e.g. mantis shrimp, 66 mg/100 g, shrimp, 39·6 mg/100 g and clam, 22 mg/100 g). In addition, mutton is also rich in ALA (39·6 mg per 100 g of mutton), possibly enhancing the endogenous conversion of EPA(Reference Urwin, Zhang and Gao45). In addition, our study was conducted during the fish close season (from 1 May to 1 September), which might limit acquisition of aquatic products and EPA intake for coastland/lakeland women.
Our study also showed that EPA plus DHA and EPA concentrations were associated with maternal age and education, which was consistent with previous studies(Reference Wilson, Mantzioris and Middleton46,Reference Minda, Molnar and Burus47) . A recent review indicated that older maternal age and higher educational level were related to higher n-3 long-chain PUFA concentrations(Reference Wilson, Mantzioris and Middleton46). The associations of DHA and EPA with maternal socio-demographic characteristics could be partly explained by the difference in consumption profiles of foods enriched with fatty acids or supplements. A large birth cohort study on Chinese, Malay, and Indian pregnant women showed that the n-3 long-chain PUFA concentrations were positively correlated to maternal age(Reference Lim, Chong and Calder48), presumably because the women who chose to deliver children later v. earlier in life were more likely to have a higher socioeconomic status and have healthier dietary habits. A nationwide study comprising 15 407 American adults also indicated that higher education level was associated with better overall dietary profiles and higher consumption of sea foods enriched with fatty acids(Reference Lisa, Susan and Luann49). Our study also found that maternal EPA concentration in erythrocytes appeared lower in lactating women having breastfeeding exclusively v. partially, possibly due to more secretion of EPA into breast milk. Although no study has examined the association of breastfeeding mode with maternal n-3 long-chain PUFA status, a cross-sectional study in Hungary showed that erythrocyte EPA concentration was lower in infants breastfed exclusively v. partially(Reference Minda, Molnar and Burus47).
Non-linear relationships were observed between plasma and erythrocyte EPA plus DHA and EPA concentrations, with inflection points of erythrocyte concentrations at 1·3 % for EPA plus DHA and 0·3 % for EPA alone. When erythrocyte EPA plus DHA ≥ 1·3 % (adjusted β = 1·01) or erythrocyte EPA < 0·3 % (adjusted β = 1·08), the relations between plasma and erythrocyte concentrations were linear; whereas no significant relation observed when erythrocyte EPA plus DHA < 1·3 % (n 16) or EPA ≥ 0·3 % (n 13), possibly due to the small samples in these strata. One interpretation of inflection points was that erythrocytes could serve as a reservoir for fatty acids, likely transporting them through dynamic interaction with plasma when maternal fatty acids levels were lower or higher(Reference Ghebremeskel, Min and Crawford50). On the other hand, the sample storage at –20°C might cause degradation of fatty acids, in particular in those with lower concentrations (such as EPA), thus leading to a flawed estimate deviated from the true linear relation(Reference Pottala, Espeland and Polreis51,Reference Metherel, Henao and Stark52) . Caution is needed when interpreting these results.
The present cross-sectional study in China, to the best of our knowledge, firstly investigated the concentrations of EPA alone and in combination with DHA and explored their potential determinants including geographic regions, periods of pregnancy and lactation, and maternal socio-demographic characteristics. The data collection and fatty acids measurements were performed by trained research personnel, following a standard protocol. The relatively large sample size provided accurate estimates for discrepancy and allowed for subgroup analyses. Several limitations of this study should be considered. First, potential selection bias may have occurred because the women were recruited in hospitals that were responsible for antenatal visit in urban areas. Second, because of the cross-sectional nature of the study design, casual inferences could not be made. Third, the mean EPA and DHA concentrations might be somewhat underestimated due to temporary storage of blood samples at –20°C. Finally, data on other potential confounders such as duration of living in the current residence were not collected.
Conclusion
In summary, maternal plasma and erythrocyte concentrations of EPA plus DHA and EPA alone differed with geographic regions, physiological periods and maternal characteristics, indicating a need of population-specific health strategies to improve fatty acids status in pregnant and lactating women. Further studies are warranted to elucidate the mechanisms underlying the aforementioned variations in EPA and DHA.
Acknowledgements
We thank all health professionals at Weihai Maternal and Child Health Hospital, Yueyang Maternal and Child Health Hospital, The First Affiliated Hospital of Baotou Medical School and The Third Hospital of Baogang Group for their valuable assistance during field work. We thank Ya-li Zhang, Lin-lin Wang and Zhao-xia Xiong from Institute of Reproductive and Child Health of Peking University for their contribution to data collection. Finally, we thank all women for their dedication to this study.
This study was supported by the National Natural Science Foundation of China (YBZ, grant numbers 81801542) and the Wyeth Nutrition Science Center (JML, project number 14·10.CN.INF).
The authors’ contributions were as follows – J. M. L.: designed the research; J. M. L. and H. T. L. and Y. B. Z.: conducted the research; S. H. Y.: analysed data and performed statistical analysis; S. H. Y. and Y. B. Z.: wrote the manuscript; Y. M.: made critical reviews and and revisions. J. M. L.: had primary responsibility for final content; and all authors: reviewed and approved the final manuscript.
There are no conflicts of interest.
Supplementary material
For supplementary material/s referred to in this article, please visit https://doi.org/10.1017/S0007114521003731


