The n-3 long-chain (LC) PUFA, EPA (20 : 5n-3) and DHA (22 : 6n-3) are recognised as being key essential nutrients in the human diet, providing a range of health benefits through their molecular, cellular and physiological actions(Reference Calder1,Reference Calder2) . While n-3 LC-PUFA have physiological functions in their own right as key components of cellular membranes(Reference Sherratta and Mason3) and regulators of gene expression(Reference Schmuth, Moosbrugger-Martinz and Blunder4), many effects are dependent upon their antagonism of n-6 PUFA, especially arachidonic acid (ARA, 20 : 4n-6), metabolism(Reference Lands5). Specifically, both EPA and DHA are precursors of eicosanoids and other highly biologically active derivatives that have important roles in blood homeostasis and the regulation of inflammation, which help to mitigate the pro-inflammatory effects of the high and imbalanced dietary n-6 PUFA content of the Western-type, industrialised diet(Reference Simopoulos6–Reference Weylandt, Chiu and Gomolka9). Thus, dietary n-3 LC-PUFA are critical in promoting neural development and function(Reference Innis10,Reference Campoy, Escolano-Margarit and Anjos11) and have beneficial impacts on several pathological conditions including CVD, certain inflammatory diseases and some cancers(Reference Delgado-Lista, Perez-Martinez and Lopez-Miranda12–Reference Calder15).
Fish and seafood are the major dietary sources of n-3 LC-PUFA with the so-called ‘oily’ fish such as Atlantic salmon (Salmo salar), which being the best in delivering a physiologically effective dose to human consumers(Reference Tur, Bibiloni and Sureda16–Reference Sprague, Dick and Tocher18). This is largely due to the primary production of n-3 LC-PUFA, and it being almost exclusively of aquatic origin and thus marine food chains are rich in EPA and DHA with fish accumulating them from their diet(Reference Bell, Tocher, Arts, Brett and Kainz19–Reference Kabeya, Fonseca and Ferrier21). However, global fisheries are at maximum levels of exploitation, and production has stagnated for almost a quarter of a century, with the increasing demand of the burgeoning human population for fish and seafood being met by aquaculture(22). While over 50 % of all fish and seafood is derived from aquaculture(22), the n-3 LC-PUFA content of farmed produce could only be guaranteed by basing feeds on fishmeal (FM) and fish oil (FO), which are derived from marine fisheries that are also at sustainable limits(Reference Tocher23). Therefore, FO and FM are finite resources on an annual basis, and their supply would limit aquaculture growth if they were not increasingly replaced in aqua feeds by plant meals and vegetable oils (VO) derived from agriculture(Reference Gatlin, Barrows and Brown24–Reference Turchini, Ng and Tocher26). However, terrestrial plants do not produce LC-PUFA and, consequently, the use of VO in aquaculture has reduced the level of n-3 LC-PUFA in feeds with subsequent impacts on the levels of these nutrients in farmed fish(Reference Sprague, Dick and Tocher18,Reference Tocher23) .
In contrast, VO can be rich sources of C18 PUFA including both α-linolenic acid (ALA; 18 : 3n-3) and linoleic acid (LA; 18 : 2n-6)(Reference Gunstone, Harwood, Gunstone, Harwood and Dijkstra27). Atlantic salmon possesses all the genes/enzymes required for the endogenous biosynthesis of both EPA and DHA from ALA(Reference Tocher28,Reference Castro, Tocher and Monroig29) . Specifically, salmon have been shown to have fads2 genes, coding for distinct desaturase proteins with separate Δ6 and Δ5 activities, and fatty acyl elongase 5 (elovl5) that are necessary for the production of EPA from ALA(Reference Hastings, Agaba and Tocher30–Reference Monroig, Zheng and Morais32). Δ-6 fatty acyl desaturase (fads2d6) along with fatty acyl elongase 2 (elovl2) and/or fatty acyl elongase 4 (elovl4) that are also present enables the production of DHA from EPA(Reference Morais, Monroig and Zheng33,Reference Carmona-Antoñanzas, Monroig and Dick34) . LA competes with ALA for the LC-PUFA biosynthesis pathway enzymes leading to the production n-6 LC-PUFA, particularly ARA(Reference Bell, Tocher, Arts, Brett and Kainz19). Although several studies have measured LC-PUFA biosynthesis in salmon fed diets with varying ALA and LA levels(Reference Ruyter, Røsjø and Grisdale-Helland35–Reference Torstensen, Tocher, Turchini, Ng and Tocher38), the precise impact of competing dietary LA and the dietary ALA:LA ratio on the endogenous production of EPA and/or DHA has not been quantified in Atlantic salmon. The primary aims of the present study were to quantify the endogenous production of EPA and DHA from ALA in salmon fed from first feeding on diets that contain no EPA and DHA and to determine the influence of dietary LA and ALA:LA ratio on LC-PUFA production.
Materials and methods
Ethics statement
All animal experimentation was conducted in compliance with the Animals Scientific Procedures Act 1986 (Home Office Code of Practice. HMSO: London January 1997) and in accordance with European Union (EU) regulation (EC Directive 86/609/EEC). The feeding trial was carried out in accordance with Norwegian national legislation via the Norwegian Animal Welfare Act (LOV-2015-06-09-19-65) Regulations on the Use of Animals in Experiments (FOR-2017-04-05-451) that was amended to implement the requirements contained in the EU regulations for the use of animals in scientific experimentation (Directive 2010/63/EU). Norway fully implemented the EU Directive within its legislature on 1 August 2016 via the European Economic Area Agreement. In addition, all experimentation performed by the Institute of Aquaculture, University of Stirling (UoS), is subjected to thorough ethical review carried out by the UoS Animal Welfare and Ethical Review Board (AWERB) prior to any work being approved. This involves all projects, irrespective of where they are carried out, to be submitted to AWERB for approval using detailed ethical approval forms that require all aspects of the experimentation to be described including all animal health and welfare issues as well as other ethical considerations. The present research was assessed by the UoS AWERB and passed the ethical review process of the UoS.
Fish, diets and feeding trial
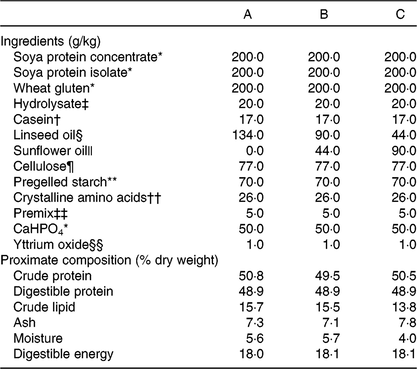
A triplicated feeding trial was run in Atlantic salmon (Salmo salar) from first feeding (initial weight approximately 0·18 g) for 22 weeks at the Institute of Marine Research (IMR, Matre Research Station). About 3000 Atlantic salmon eggs were sourced (Aquagen) and transferred to IMR, Matre, where the eggs were hatched and alevins maintained under standard rearing conditions. A series of three isoenergetic (digestible energy, DE = 18 MJ·kg) and isoproteic (digestible protein, DP = 49 %; DP:DE, 27) diets were formulated and manufactured at the UoS (Table 1). The FM and FO-free diets (diets A – C) contained 15 % lipid that was supplied by linseed and sunflower oils to provide three different ALA:LA ratios of approximately 3:1 (A), 1:1 (B) and 1:3 (C). The dry ingredients were ground, mixed with oil and water and pelleted using a screw press cold extruder (DollyTM; Imperia & Monferrina S.p.A). Each diet was prepared as two batches of the same formulation, processed through either a 1 or 2 mm die. After drying overnight at 40°C, the feeds were ground and sieved to produce pellet sizes of 0·5 – 0·8, 0·8 – 1·0, 1·0 – 1·5 and 1·5 – 2·0 mm. A further feed (REF) was included in the feeding trial as a reference to provide commercial context. The REF feed was a standard commercial feed used in the facility for rearing Atlantic salmon parr and contained primarily FM and FO. The analysed fatty acid compositions of all four feeds used in the trial are shown in Fig. 1. Analysed ALA:LA ratios were 2·61, 0·95 and 0·36 in diets A, B and C, respectively. Prior to first feeding the alevins/fry were distributed into four tanks (1 × 1 m) supplied with aerated freshwater with 750 fish per tank. In consideration of the fact that the experimental diets were FM and FO-free, first feeding was performed in the single replicate tanks with higher fish density to ensure a good feeding response. During this initial 3-week phase, feeds were provided by hand, so that the feeding behaviour could be observed. At approximately 0·5 g, fish from each single tank were redistributed into 3 × 1 m diameter tanks (500 litres volume; twelve tanks in total) in a freshwater through flow system with 200 alevins/fry per tank at a water temperature of 13°C and 24:0 light:dark. Fish were fed to excess by automatic feeders with pellet size increasing as the fish size increased.
Table 1. Formulations and analysed proximate compositions of experimental feeds
* BioMar Ltd.
† Bulk Powders Ltd.
‡ HP1 from Aquativ.
§ Cold-pressed, AniForte UK Ltd.
|| Sainsbury’s Supermarkets Ltd.
¶ Microcrystalline cellulose, Blackburn Distributions Ltd.
** Sigma Pharmaceuticals.
†† Includes methionine (10), lysine (10), taurine (5) and also choline (1).
‡‡ OVN Salmonid from DSM Nutritional Products.
§§ Stanford Materials.
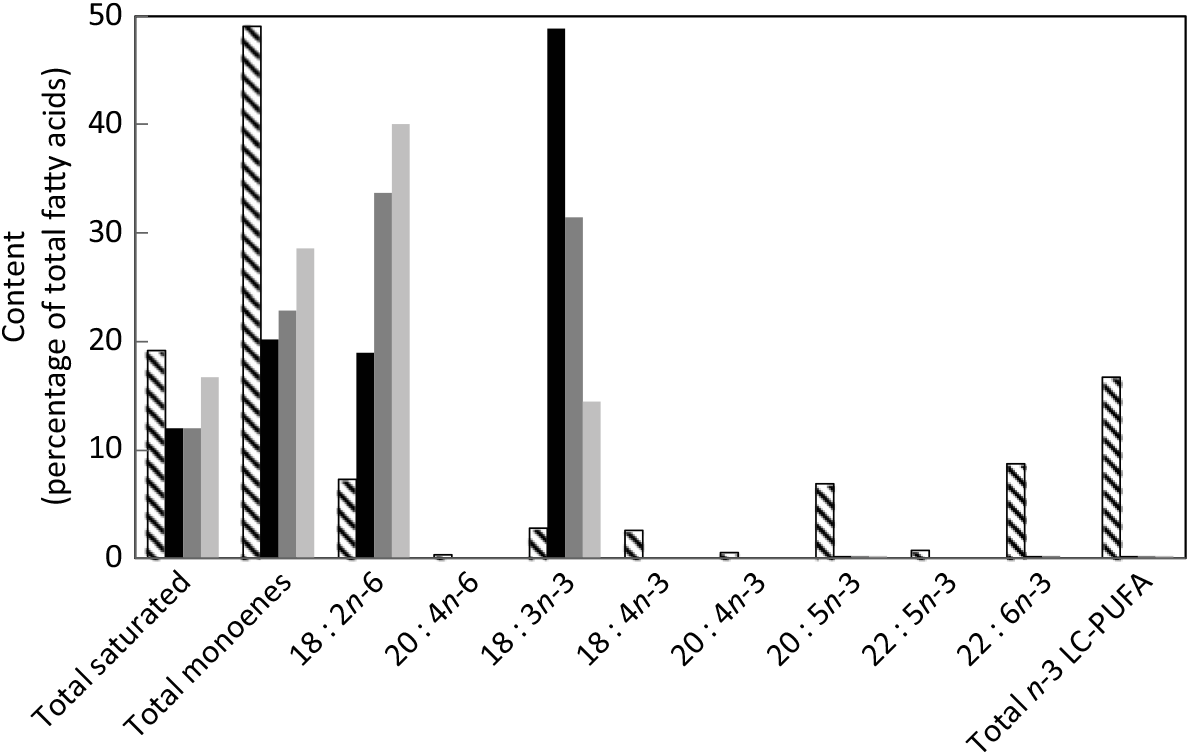
Fig. 1. Fatty acid composition (percentage of total fatty acids) of experimental feeds (A (
Sampling
At distribution of fish into tanks prior to first feeding, a triplicate sample of 50–60 alevins (approximately 10 g wet weight) were killed by anaesthetic overdose (tricaine methanesulfonate, MS-222; 400 mg/l in hydrogen carbonate-buffered solution) prior to being bulk weighed on an electronic top-loading balance to 0·1 g accuracy. The initial samples for compositional analyses were immediately frozen in liquid N2 and stored at –70°C prior to analyses. At the end of the trial after 22 weeks feeding, forty fish per tank were killed by anaesthetic overdose as above prior to being individually weighed on an electronic top-loading balance to 0·1 g accuracy. Twenty whole fish per tank were collected as two pooled samples of ten fish and immediately frozen in liquid N2 and stored at –70°C prior to analyses. Another ten fish per tank were sampled for tissues as two pooled samples of five fish with samples immediately frozen in liquid N2. Tissues collected were liver, intestine, flesh, gill, brain and eye. A further ten fish per tank were killed as above and liver collected into RNAlaterTM as 120 individual samples. These samples were stored overnight at 4°C before freezing at –70°C prior to RNA extraction and analysis of gene expression.
Lipid and fatty acid analyses
Total lipid was extracted from feeds, whole fish and fish tissues by homogenising in chloroform–methanol (2:1, v/v) using an Ultra-Turrax tissue disrupter (Fisher Scientific) and content determined gravimetrically(Reference Folch, Lees and Sloane-Stanley39). Total lipids were resuspended in chloroform–methanol (2:1, v/v) at a concentration of 10 mg/ml. Total phospholipids (PL) and TAG were prepared from total lipid by TLC on silica gel sixty plates (20 × 20 cm; Merck KgaA) and developed to full distance with isohexane–diethyl ether–acetic acid (85:15:1, by vol.)(Reference Henderson, Tocher, Hamilton and Hamilton40). Lipid classes were visualised by spraying with 0·1 % (w/v) 2-7-dichlorofluorescein in 97 % aqueous methanol (v/v) and viewing under UV light at 240 nm (UVP® Mineralight® R-52G; UVP Inc.). Identified classes (TAG and total PL/origin) were scraped into glass tubes and lipids eluted with isohexane–diethyl ether (1:1, v/v). Fatty acid methyl esters (FAME) were prepared from total lipid, total PL and TAG by acid-catalysed transesterification at 50°C for 16 h(Reference Christie41), and FAME extracted and purified as described previously(Reference Tocher and Harvie42). FAME were separated and quantified by GLC using a Fisons GC-8160 (Thermo Scientific) equipped with a 30 m × 0·32 mm internal diameter × 0·25 μm ZB-wax column (Phenomenex), on-column injector and a flame ionisation detector. H2 was used as carrier gas with the initial oven thermal gradient from 50°C to 150°C at 40°C/min to a final temperature of 230°C at 2°C/min. Individual FAME were identified by comparison with known standards (Restek 20-FAME Marine Oil Standard; Thames Restek UK Ltd) and published data(Reference Tocher and Harvie42). The data were collected and processed using Chromcard for Windows (version 1.19; Thermoquest Italia S.p.A.).
The within-assay precision of this test is based on six replicates of the same sample, prepared and analysed at the same time on the same instrumentation, and found to be no greater than 5 % relative standard deviation (RSD) across the twelve main fatty acids of interest. In case of a difference of >5 % RSD between the within-assay replicates, the analysis is repeated. Between-assay precision is based on six separate analyses of the same sample at separate time points and the difference across twelve fatty acids found to be no greater than 5 % RSD.
Liver gene expression
Total RNA was extracted from individual liver samples of ten fish per tank by homogenising in 1 ml of TriReagent® following the producer’s protocol (Sigma-Aldrich). The quantity and quality of RNA were determined by spectrophotometry (Nanodrop ND-1000; Labtech Int.) and RNA integrity assessed by agarose gel electrophoresis. Complementary DNA (cDNA) was synthesised using a high-capacity reverse transcription (RT) kit utilising 2 μg of total RNA and random primers in a total reaction volume of 20 μl following the manufacturer’s protocol (Applied Biosystems). The samples were pooled (two samples of five fish per tank) to obtain n 6 per dietary treatment. A dilution of 1:20 was applied to the resulting cDNA using milliQ water.
Expression levels of key genes involved in LC-PUFA biosynthesis pathways (fads2d6; fads2d5, Δ-5 fatty acyl desaturase; elovl2, fatty acyl elongase 2; elovl5a, fatty acyl elongase 5 isoform a; elovl5b, fatty acyl elongase 5 isoform b), lipid biosynthesis (srebp1, sterol regulatory element-binding protein 1; srebp2, sterol regulatory element-binding protein 2; lxr, liver X receptor; fas, fatty acid synthase; hmgcr, 3-hydroxy-3-methyl-glutaryl-coenzyme A (HMGCoA) reductase) and lipid catabolism (ppara, peroxisome proliferator-activated receptor α; pparg, peroxisome proliferator-activated receptor γ; aco, acyl CoA oxidase; cpt1, carnitine palmitoyl transferase 1) were determined by real-time quantitative RT-PCR in liver, as described in detail previously( Reference Betancor, Sprague and Usher43 ) (primers as detailed in online Supplementary Table S1). Results were normalised using reference genes, hypoxanthine guanine phosphoribosyl transferase (hprt), elongation factor 1 α (ef1α) and TATA box binding protein (tbp) that were shown as the most stable according to GeNorm(Reference Vandesompele, De Preter and Pattyn44) stability number (M = 0·239 for ef1α and 0·213 for both hprt and tbp). Primers were designed using primer 3 and were previously tested for efficiency, which was always over 0·80(Reference Betancor, Li and Bucerzan45). Quantitative PCR was performed using a Biometra TOptical Thermocycler (Analytik Jena) in ninety-six well plates in duplicate 20 μl reaction volumes containing 10 μl of Luminaris Color HiGreen quantitative PCR (qPCR) Master Mix (Thermo Scientific), 1 μl of primer corresponding to the analysed gene (10 pmol), 3 μl of molecular biology grade water and 5 μl of cDNA, with the exception of the reference genes, which were determined using 2 μl of cDNA. In addition, amplifications were carried out with a systematic negative control (no template control) containing no cDNA. Standard amplification parameters contained a DNase pre-treatment at 50°C for 2 min, an initial activation step at 95°C for 10 min, followed by thirty-five cycles: 15 s at 95°C, 30 s at the annealing Tm and 30 s at 72°C.
Statistical analyses
Based on extensive prior experience, the hypothesised effect sizes of phenomic and transcriptomic responses were expected to be >1·5 × sd. Using this basis, the experimental power of the design was calculated post hoc using the ‘ANOVA fixed effects’ test within the G-Power software (http://www.gpower.hhu.de/). Using an α value of 0·05, an average effect size of approximately 1·5 × sd was applied for key response variables (e.g. growth, net LC-PUFA gain and Log2FC). As an example, a power level (1 – β) of 0·618 was determined for growth among diets A, B and C, whereas the effect sizes of other parameters were larger (e.g. net LC-PUFA gain had a power level (1 – β) of 0·999).
For biochemical analyses, mean values were calculated for each tank prior to statistical analyses (n 3). Significance of differences was determined by one-way ANOVA followed when appropriate by Tukey’s post hoc test using GraphPad InStat, version 3.01 32 bit for Win95/NT (GraphPad Software Inc.). For gene expression (n 6), the relative expression levels (gene expression fold change) of the target genes, normalised to the three housekeeping genes, were calculated following the method described by Pfaffl( Reference Pfaffl46 ). Data were tested for normality and homogeneity of variances with Levene’s test prior to one-way ANOVA followed by Tukey’s post hoc test. The statistical analyses were performed using SPSS software (IBM SPSS Statistics 23; SPSS Inc.).
Results
After 22 weeks, salmon fed the diets with essentially no EPA and DHA were less than half the weight of fish fed the reference diet containing FO (Fig. 2). Although the fish fed the highest content of LA had the lowest weight, there was no significant effect of ALA:LA ratio on growth after 22 weeks. Mortality after the initial feeding phase was very low throughout the trial and unrelated to feed.
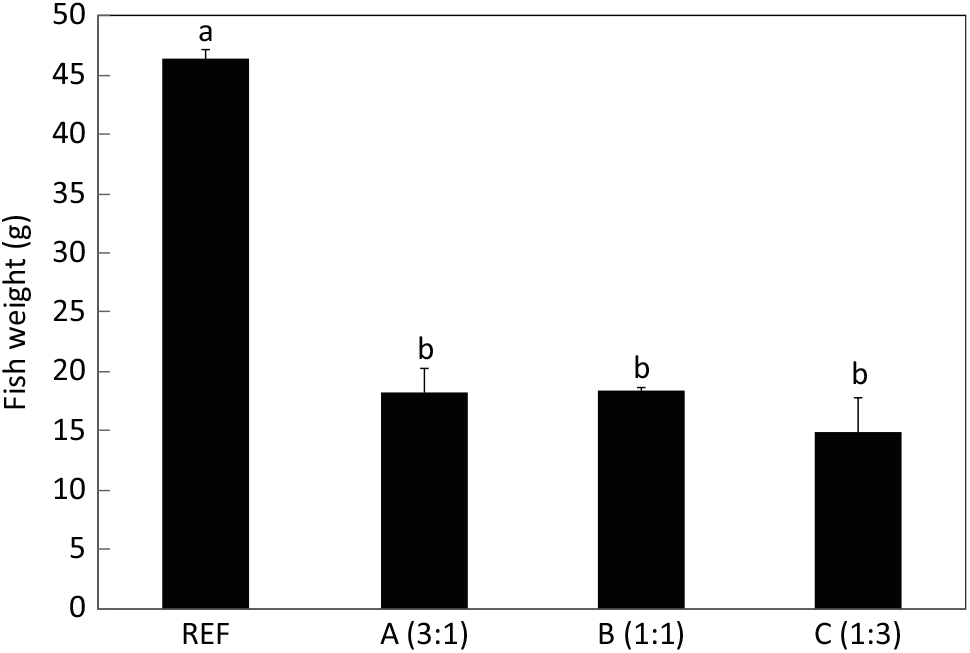
Fig. 2. Final weights (g) of salmon after feeding the experimental and reference (REF) diets for 22 weeks (154 d). Data are means (n 3), with standard deviations represented by vertical bars. a,b Mean values with unlike letters were significantly different between diets (determined by ANOVA followed by Tukey’s multiple comparison test).
The aim of the present study was to very specifically quantify endogenous production of EPA and DHA and not to quantify the overall desaturation of ALA (and LA). Although 20 : 4n-3 satisfies our definition of LC-PUFA (≥C20 and ≥3 double bonds), it was not included in the calculations for total LC-PUFA production in the present study. Similarly, 18 : 3n-6 and 20 : 3n-6 were not included in the data for total n-6 LC-PUFA production. However, docosapentaenoic acid (DPA, 22 : 5n-3) was included along with EPA and DHA in total n-3 LC-PUFA, and 22 : 4n-6 and 22 : 5n-6 were included along with ARA in total n-6 PUFA (Fig. 3 and 4). Full fatty acid compositions of whole fish after 22 weeks of being fed diets containing essentially no EPA and DHA are presented in online Supplementary Table S2.
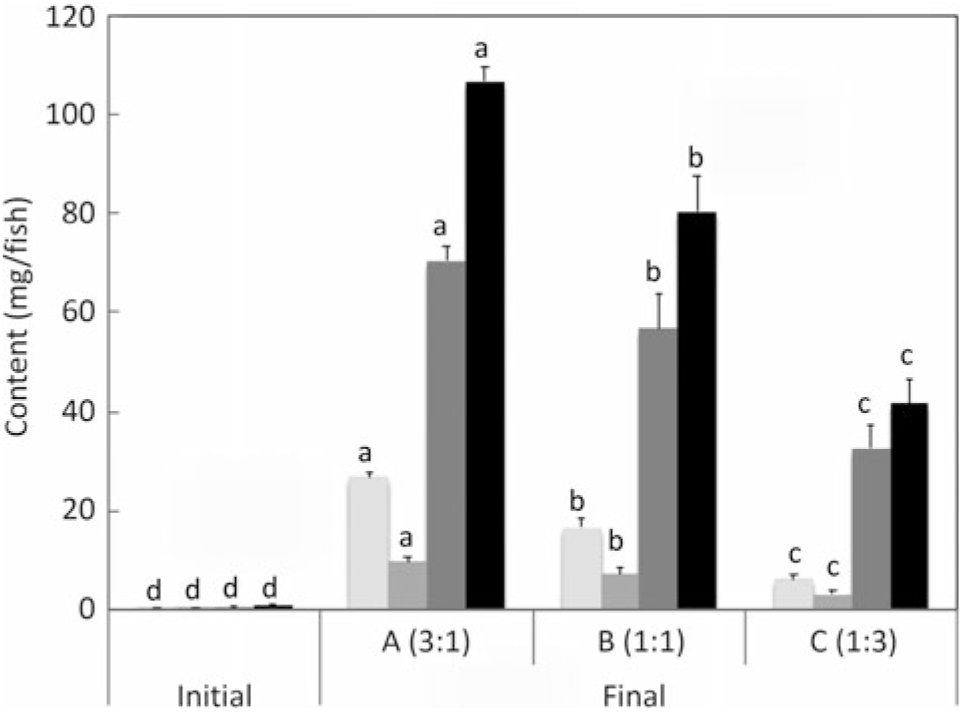
Fig. 3. n-3 Long-chain PUFA (LC-PUFA) contents (mg/fish) of fry at first feeding/initiation of the trial (Initial) and whole fish after feeding the experimental diets for 22 weeks (Final). Data are means (n 3), with standard deviations represented by vertical bars. a,b,c,d Mean values for each fatty acid with unlike letters were significantly different between diets (determined by ANOVA followed by Tukey’s multiple comparison test).
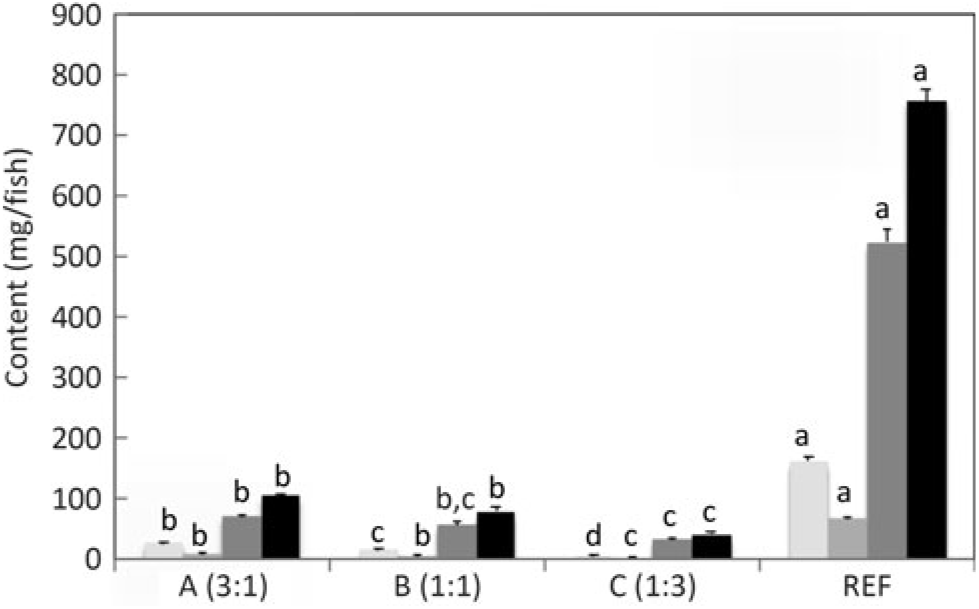
Fig. 4. n-3 Long-chain PUFA (LC-PUFA) contents (mg/fish) of whole fish fed the experimental diets (A, B and C) in comparison with fish fed the reference diet (REF) for 22 weeks. Data are means (n 3), with standard deviations represented by vertical bars. a,b,c,d Mean values for each fatty acid with unlike letters were significantly different between diets (determined by ANOVA followed by Tukey’s multiple comparison test).
Salmon fed diets with ALA:LA ratios of 3:1, 1:1 and 1:3 contained 107, 80 and 41 mg of total n-3 LC-PUFA (EPA + DPA + DHA) per fish, almost all of which were the result of endogenous production as initial first feeding fry contained just under 1 mg total n-3 LC-PUFA per fish (Fig. 3). In the initial fry, DHA and EPA were present with a ratio of 2:1, whereas in fry fed an ALA:LA ratio of 3:1 DHA and EPA were in a ratio of over 2·6:1. This contrasted with the fish fed a standard commercial feed containing EPA and DHA, where they accumulated 757 mg of total n-3 LC-PUFA, with DHA and EPA in a ratio of 3·2:1 (Fig. 4). Fry fed the highest amount of LA (ALA:LA of 1:3) accumulated 21 mg n-6 LC-PUFA, which compared with just over 28 mg in fish fed standard commercial feed, while initial fry contained only 0·07 mg of ARA (Fig. 5).
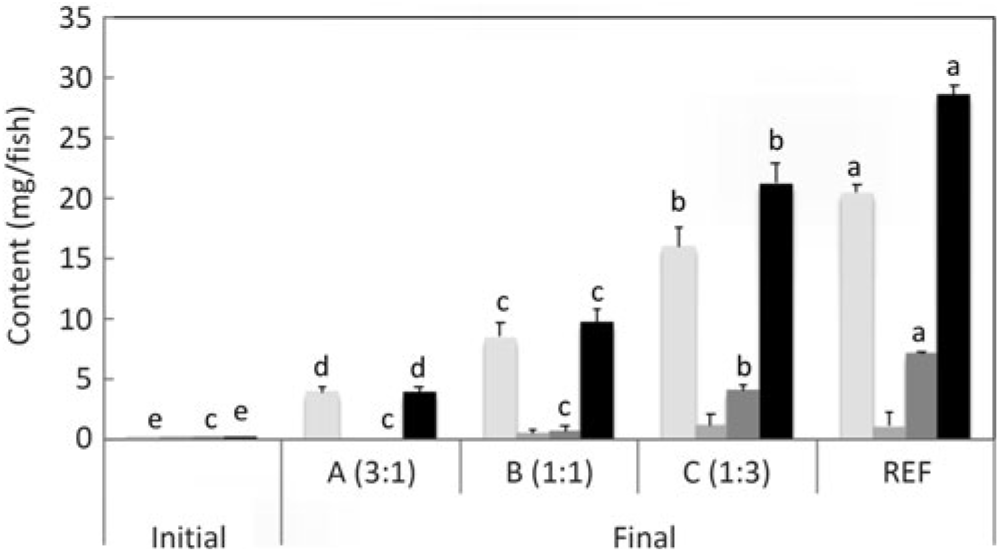
Fig. 5. n-6 Long-chain PUFA (LC-PUFA) contents (mg/fish) of fry at first feeding/initiation of the trial (Initial) and whole fish after feeding the experimental diets for 22 weeks (Final). a,b,c,d,e Mean values for each fatty acid with unlike letters were significantly different between diets (determined by ANOVA followed by Tukey’s multiple comparison test).
On a per fish basis, endogenous production of n-3 LC-PUFA was at least 5·9, 4·4 and 2·8 mg/g fish, and that of n-6 LC-PUFA was at least 0·2, 0·5 and 1·4 mg/g fish in salmon fed diets with ALA:LA ratios of 3:1, 1:1 and 1:3, respectively (Fig. 6). As daily (154 d trial) rates of production, these data corresponded to at least 38·1, 28·4 and 18·2 μg/g fish per d for endogenous production of n-3 LC-PUFA, and at least 1·4, 3·4 and 9·3 μg/g fish per d for n-6 LC-PUFA production in salmon fed diets with ALA:LA ratios of 3:1, 1:1 and 1:3, respectively. The ratio of n-3 LC-PUFA production to n-6 LC-PUFA production decreased from 27·4 to 2·0 as dietary ALA:LA ratio decreased and, similarly, EPA:ARA and DHA:ARA ratios decreased as the dietary ratio of ALA:LA decreased. Less obviously, and more interestingly, the DHA:EPA ratio increased from 2·6 to 5·3 as the dietary ratio of ALA:LA decreased (Fig. 6).
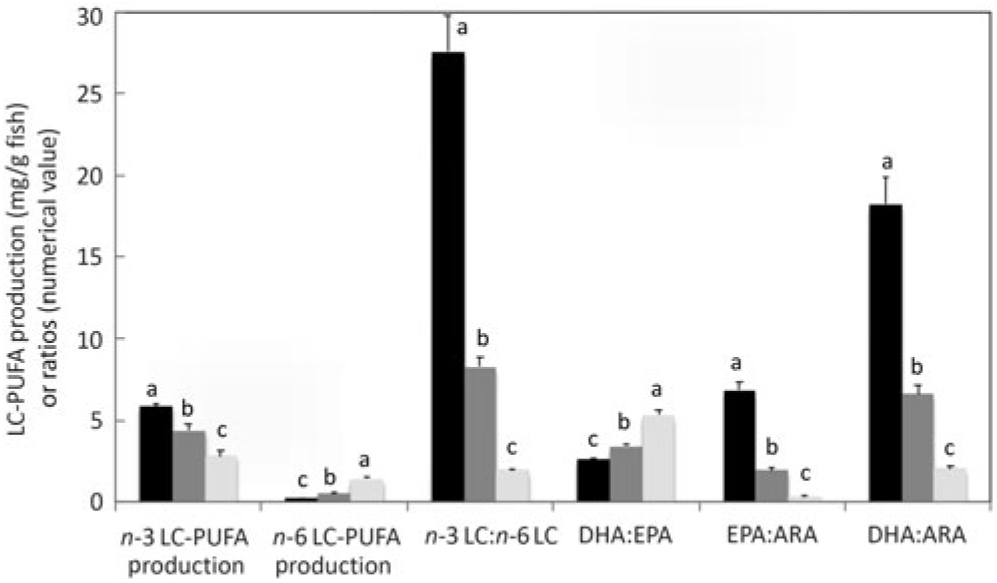
Fig. 6. Production of n-3 and n-6 long-chain PUFA (LC-PUFA) (mg/g fish) and n-3 LC-PUFA:n-6 LC-PUFA, DHA:EPA, EPA:arachidonic acid (ARA) and DHA:ARA ratios in whole fish after feeding the experimental diets (A (
The distribution of the endogenously produced LC-PUFA in specific lipid classes and tissues was also investigated. Comparing the proportion of fatty acids in total lipid and lipid classes, the percentages of n-3 LC-PUFA and n-6 PUFA were higher in total PL than in TAG (Fig. 7). To compare the distribution among tissues, the level of the particular fatty acid (DHA, EPA and ARA) in whole fish was compared with the levels in individual tissues. Setting the reference level as the amount of n-3 LC-PUFA in whole fish fed the diet containing ALA:LA at 3:1 (highest production), DHA was present at far higher levels in brain and also, to a lesser extent, in liver (Fig. 8). In contrast, EPA was present in higher amounts in liver and, to a lesser extent, in brain. With ARA, only liver showed a higher level than the reference, which was set as the level in whole fish fed the diet containing ALA:LA at 1:3 (highest ARA production) (Fig. 8).
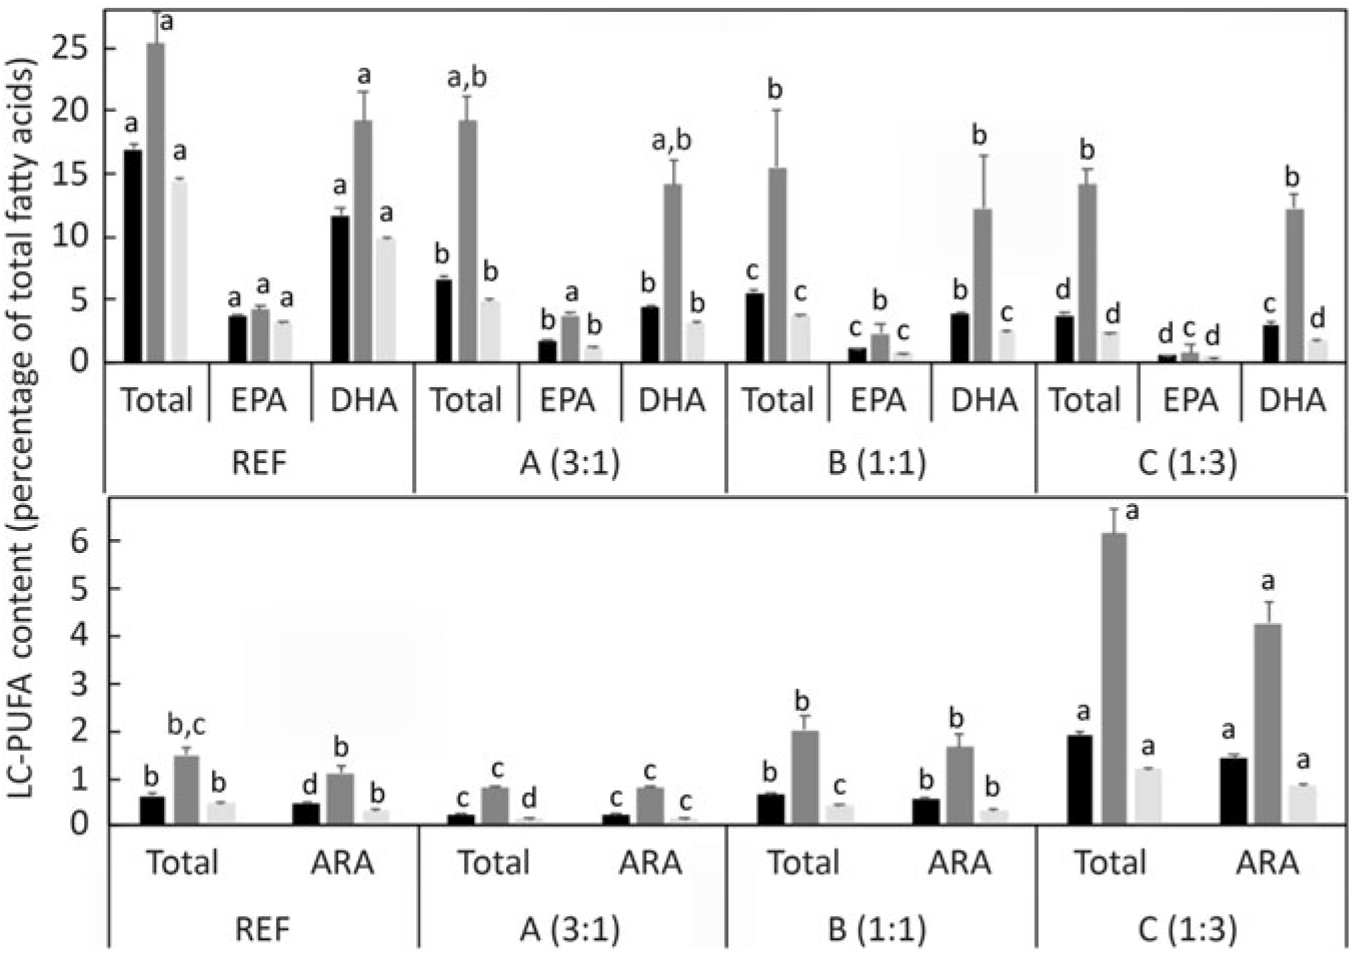
Fig. 7. Long-chain PUFA (LC-PUFA) composition (percentage of total fatty acids) of whole fish total lipid (TL;
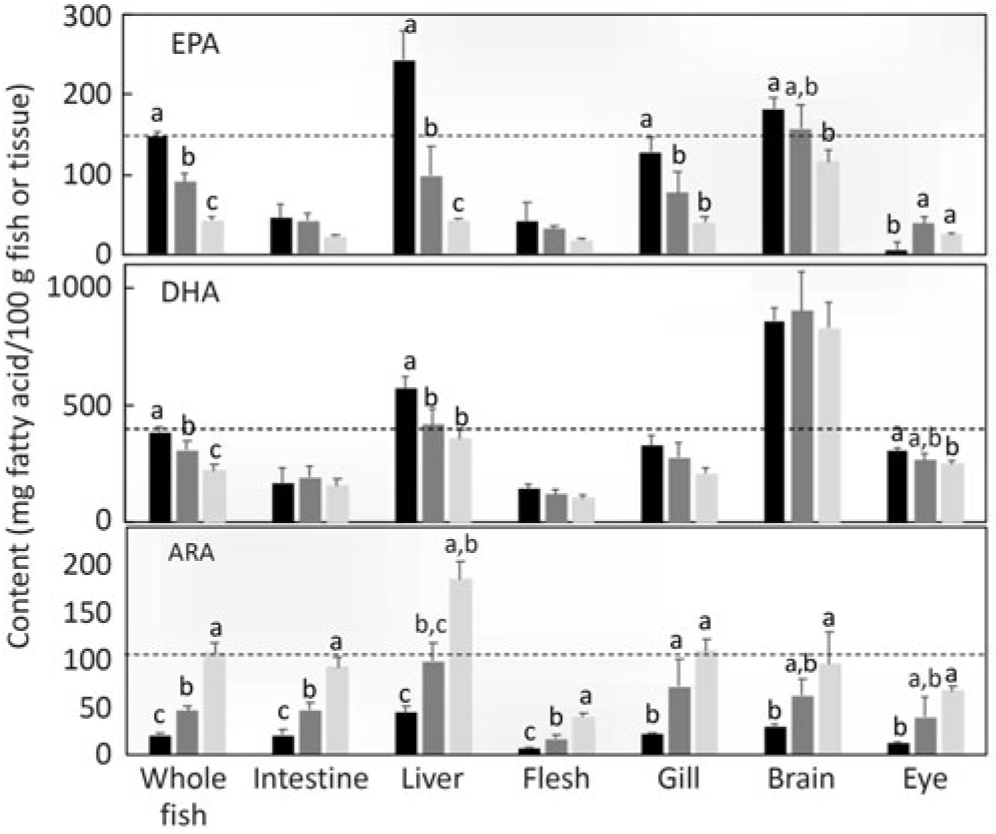
Fig. 8. Tissue contents (mg fatty acid/100 g of whole fish or tissue) of EPA, DHA and arachidonic acid (ARA) after feeding the experimental diets (A (
Determination of the expression of key genes of LC-PUFA biosynthesis in liver by quantitative RT-PCR showed that transcript abundances of fads2d6 and fads2d5 and elovl2 were all significantly higher in fish fed the experimental feeds lacking LC-PUFA (Fig. 8). Although the differences were not statistically significant, expression levels of these genes were numerically lower in fish fed the diet balanced (equal proportions) with ALA and LA. In contrast, diet did not affect the expression of elovl5a and slightly reduced the expression of elovl5b (Fig. 9). The expression of some genes related to lipid anabolic pathways, srebp1, srebp2 and fas showed increasing expression with increasing dietary LA (i.e. as ALA:LA decreased), while some genes related to lipid catabolism, ppara, pparg and aco, showed the same pattern of expression among the three experimental feeds, with the lowest expression in fish fed the diet with an ALA:LA ratio of 1 (Fig. 9).
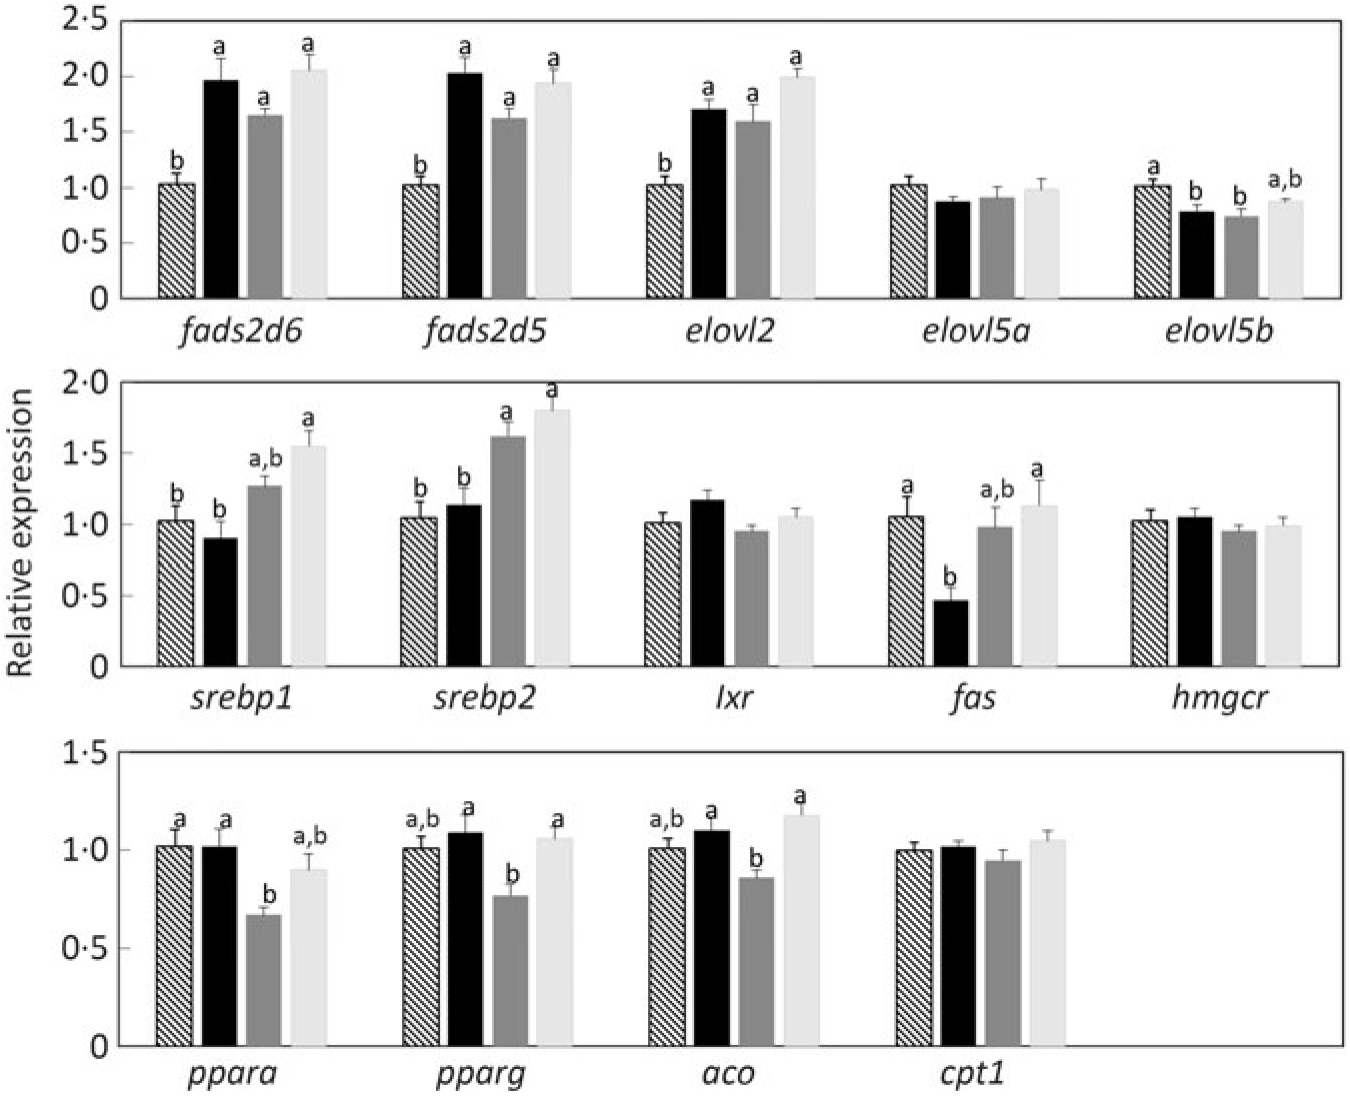
Fig. 9. Relative expression of genes of long-chain PUFA biosynthesis (upper panel), lipid anabolism (middle panel) and lipid catabolism (bottom panel) in liver of Atlantic salmon as determined by quantitative PCR. Results are normalised expression ratios. Data are means (n 6), with standard errors represented by vertical bars. a,b Mean values with unlike letters for each gene were significantly different between diets (one-way ANOVA). aco, Acyl coA oxidase; cpt1, carnitine palmitoyl transferase 1; elovl2, fatty acyl elongase 2; elovl5a, fatty acyl elongase 5 isoform a; elovl5b, fatty acyl elongase 5 isoform b; fads2d5, Δ-5 fatty acyl desaturase; fads2d6, Δ-6 fatty acyl desaturase; fas, fatty acid synthase; hmgcr, 3-hydroxy-3-methyl-glutaryl-coenzyme A (HMGCoA) reductase; lxr, liver X receptor; ppara, peroxisome proliferator-activated receptor α; pparg, peroxisome proliferator activated receptor γ; srebp1, sterol regulatory element-binding protein 1; srebp2, sterol regulatory element-binding protein 2.
Discussion
Although the fish fed the low ALA:LA ratio had the numerically lowest final weight, no significant differences were found between fish fed the experimental diets, indicating that the dietary n-3 PUFA:n-6 PUFA ratio had little impact on growth. Of course, the fish fed the FM- and FO-free feeds were significantly smaller than fish fed the REF feed, which was entirely expected. The REF feed was not a control feed in the present study, but simply a reference to place some of the data obtained into context. It has already been demonstrated that salmon post-smolts can be grown on essentially FM and FO-free feeds without major impacts on growth using highly optimised feeds( Reference Crampton, Nanton and Ruohonen47 , Reference Bendiksen, Johnsen and Olsen48 ). This was not the aim of the present trial, which was not a nutritional trial in terms of growth and feed efficiency and was not testing ingredients but was focused entirely on nutrients and, specifically, LC-PUFA. The experimental feeds were therefore formulated to supply nutrients at currently reported requirement levels for Atlantic salmon(49). In this respect, it is also important to clarify that the experimental feeds were not essential fatty acid (EFA)-deficient despite containing no EPA, DHA or ARA, as ALA and LA are reported to satisfy EFA requirements in salmonids (with complete LC-PUFA biosynthesis pathways) and the feeds contained ALA and LA at levels far above the reported requirement levels(49). Certainly, the fish fed the experimental feeds showed none of the classical EFA-deficiency signs(Reference Tocher, Glencross, Lee, Lim, Webster and Gatlin50). However, it is also known that LC-PUFA can supply EFA requirements at lower levels and so the lack of LC-PUFA may indeed be part of the reason for the lower growth obtained(Reference Ruyter, Røsjø and Einen51,Reference Ruyter, Røsjø and Einen52) . However, the commercial start feed, as with the feeds used in the FM- and FO-free studies above, would undoubtedly be supplying many nutrients in excess of the minimal levels reported by the National Research Council(49). Thus, it was expected that the experimental feeds would impact growth and, hence, the reason to include the commercial feed (REF) to provide some context. Growth rate is linked to metabolic activity including intermediary metabolism and key anabolic pathways such as LC-PUFA biosynthesis and, therefore, differences in growth rate could affect production rates per fish. However, growth rate is less likely to affect production per gram of fish, and so data presented this way should be unaffected by the differences in growth rate.
It had been shown previously that salmonids, Atlantic salmon and rainbow trout (Oncorhynchus mykiss) can be net producers of n-3 LC-PUFA by feeding diets with only low levels of FO(Reference Sanden, Stubhaug and Berntssen53,Reference Turchini, Francis and Keast54) . While no method for assessing in vivo production of LC-PUFA is perfect(Reference Brown55), production of EPA and DHA in these studies was calculated from total fatty acid intakes and final fatty acid contents in whole fish using ‘fatty acid production value, FAVP’(Reference Stubhaug, Lie and Torstensen56) or the whole body mass balance method(Reference Turchini, Francis and De Silva57). The present study used essentially similar methodology to these earlier studies except that the feeds were fed from first feeding and contained essentially no LC-PUFA. This simplified the calculations as, other than the very small amount of EPA, DHA and ARA in the alevins at first feeding, all the LC-PUFA present in the fish at the end of the trial were derived from endogenous biosynthesis. Feeding diets with no EPA and DHA from first feeding had been done previously with rainbow trout, but quantitative LC-PUFA production was not reported(Reference Lazzarotto, Corraze and Leprevost58).
The present study showed that in the trial period Atlantic salmon produced almost 6 mg n-3 LC-PUFA from ALA per gram of fish (approximately 40 μg/g fish per d). There are some caveats to this figure. First, it should be regarded as a minimum amount and cannot be lower, as it is highly likely that some LC-PUFA produced will be oxidised as demonstrated previously(Reference Turchini, Francis and Keast54,Reference Turchini, Francis and De Silva57,Reference Emery, Norambuena and Trushenski59) . While endogenously produced LC-PUFA may be less oxidised than dietary fatty acids, there is no biochemical/physiological mechanism to prevent this oxidation(Reference Tocher60). Second, the data are limited to fry and the first half of the parr (freshwater) stage and this could change over the entire life cycle. Biosynthesis of LC-PUFA from 14C-ALA was increased in hepatocytes of salmon undergoing parr–smolt transformation(Reference Bell, Tocher and Farndale61,Reference Tocher, Bell and Henderson62) and, therefore, this could increase the capacity for endogenous production. Therefore, existing data suggest 6 mg/g fish is minimum for production during the freshwater stage, which may increase prior to seawater transfer. There are few data on how the capacity for LC-PUFA biosynthesis is affected by age per se and, indeed, this is identified as a gap in the knowledge for humans(Reference Baker, Miles and Burdge63). However, there is evidence that the capacity for conversion of ALA to DHA is higher in human infants than in adults(Reference Brenna, Salem and Sinclair64). In salmon, based on assays of LC-PUFA production in hepatocytes, it has been speculated that activity may be lower in post-smolts in seawater(Reference Bell, Tocher and Farndale61,Reference Tocher, Bell and Henderson62) , but there are no in vivo studies to directly support this.
In humans, in vivo conversion of ALA to n-3 LC-PUFA has been estimated in a number of studies including stable isotope studies and is generally very modest, with some low conversion to EPA with conversion to DHA being even lower or not at all(Reference Baker, Miles and Burdge63,Reference Burdge and Calder65,Reference Wood, Mantzioris and Gibson66) . In fish, there are no previous studies that provide equivalent data with which to directly compare the present results. However, in an in vivo stable isotope study using 4–15 g rainbow trout fed 5 % FM and 11 % VO, the rate of DHA production was reported to be low at 0·54 μg/g fish per mg ALA consumed per d(Reference Bell, Dick and Porter67). This estimate is not directly comparable to the rate calculated in the present study. Extrapolating from data calculated via the whole body fatty acid mass balance method, total ALA conversion could be estimated at about 1·5 μg/g fish per d when the rainbow trout were fed a high ALA diet(Reference Emery, Hermon and Hamid68). While the methodology used in the earlier trout trial was somewhat similar to that used in the present study, the data are not directly comparable as the diets were formulated with FM and contained approximately 1·5 % n-3 LC-PUFA (EPA:DHA approximately 1), and the presence of dietary DHA would reduce Δ6 desaturation of ALA(Reference Thomassen, Berge and Gerd69,Reference Betancor, Sprague and Sayanova70) .
In humans, reducing dietary LA (increasing ALA:LA ratio) enabled increased conversion of ALA to EPA and, in some cases, also increased DHA(Reference Baker, Miles and Burdge63,Reference Wood, Mantzioris and Gibson66) . The present study demonstrated how the dietary ALA:LA ratio quantitatively impacted the overall production of both n-3 and n-6 LC-PUFA in salmon. Thus, irrespective of dietary ALA:LA ratio, n-3 LC-PUFA production always exceeded n-6 LC-PUFA production, being 27-fold greater when dietary ALA exceeded LA by 2·6-fold, and it was still 2-fold greater when fish were fed a diet with a 2·6-fold excess of LA. This demonstrates clearly the preferences of enzymes in the LC-PUFA biosynthesis pathway for n-3 compared with n-6 fatty acid substrates, confirming the results from studies on enzyme activities determined with radiolabelled tracers in hepatocytes(Reference Bell, Tocher and Farndale61), preferences of individual desaturase and elongase proteins in heterologous expression assays(Reference Monroig, Tocher, Castro and Burdge71), and by the whole-body mass balance method(Reference Senadheera, Turchini and Thanuthong72). While there are numerous studies investigating the effects of dietary ALA:LA ratio in fish, few have attempted to quantify impacts on LC-PUFA production. However, increasing dietary LA reduced n-3 LC-PUFA production and increased n-6 LC-PUFA production in Murray cod (Maccullochella peelii peelii)(Reference Senadheera, Turchini and Thanuthong72). In contrast, while increasing dietary LA had a significant impact on increasing n-6 LC-PUFA production in rainbow trout, it only marginally impacted n-3 LC-PUFA production(Reference Emery, Hermon and Hamid68), reducing EPA production but with little effect on DHA production(Reference Thanuthong, Francis and Senadheera73). A further noteworthy result in the present study was that increased dietary LA (reduced ALA:LA ratio) also resulted in a reduction in the overall LC-PUFA production. The overall rate of LC-PUFA production decreased from approximately 39·5 μg/g fish per d (38·1 n-3 + 1·4 n-6) in fish fed the high ALA:LA ratio to approximately 27·5 μg/g fish per d (18·2 + 9·3) in fish fed the low ALA:LA ratio; and therefore, high dietary LA in effect inhibited the pathway. In contrast, this was not observed in rainbow trout, where the total LC-PUFA production was largely unaffected by ALA:LA ratio(Reference Emery, Hermon and Hamid68). Extrapolating from whole-body fatty acid mass balance data, approximately 1·6 μg/g fish per d (1·5 ALA + 0·1 LA) to approximately 1·7 μg/g fish per d (1·4 + 0·3) of C18 PUFA were converted into fish fed diets with high and low ALA:LA ratio, respectively(Reference Emery, Hermon and Hamid68).
The optimal dietary DHA:EPA ratio and its relationship to tissue DHA:EPA ratios present a complicated situation and are poorly understood in salmon or, indeed, any species(Reference Emery, Norambuena and Trushenski59,Reference Codabaccus, Carter and Bridle74) . The present study aimed to provide some insight to the optimal dietary ratio of DHA:EPA by extrapolating from the ratio actually produced endogenously in salmon when receiving no dietary input of preformed EPA and DHA. One initial point to note is that the level of DHA in whole fish always exceeded that of EPA, so the DHA:EPA ratio was always >1 in the present study. This was also the case in the earlier study in rainbow trout fed a diet completely devoid of EPA and DHA (and an ALA:LA ratio of about 1), where DHA:EPA ratio in both polar and neutral lipids in carcass, liver and intestine varied between 1·3 in carcass neutral lipid and 4·1 in liver polar lipids(Reference Lazzarotto, Corraze and Leprevost58). However, interestingly, the present study demonstrated that the DHA:EPA ratio produced through endogenous production of EPA and DHA was not fixed but affected by the dietary ALA:LA ratio; and thus, as dietary LA increased, the DHA:EPA ratio also increased. While this is not something that had been highlighted previously, careful examination of existing literature has shown that increased dietary LA (i.e. reduced ALA:LA ratio) generally resulted in increased DHA:EPA ratios in whole fish and/or tissues of a range of freshwater and salmonid species(Reference Emery, Hermon and Hamid68,Reference Thanuthong, Francis and Senadheera73,Reference Tan, Luo and Xie75–Reference Xie, Liu and Wang81) , though not always(Reference Senadheera, Turchini and Thanuthong72,Reference Blanchard, Makombu and Kestemont82,Reference Chen, Chen and Wang83) . It must be stressed that the above results are not directly comparable with the present study as the fish in these earlier trials were all fed diets that also contained EPA and DHA, complicating interpretation of the data. However, a likely possible mechanism for the impact of dietary LA on DHA:EPA ratio is that increased LA would increase competition with ALA for the LC-PUFA pathway (Δ6 desaturase) and this could particularly impact the production of EPA, but not the production of DHA from EPA to the same extent. This explanation reflects the chemistry/biochemistry and enzyme kinetics of the biosynthesis pathways in salmon(Reference Tocher60,Reference Monroig, Tocher, Castro and Burdge71) , but an alternative explanation is that the result could possibly reflect a physiological driver with DHA being ‘more essential’ than EPA for membrane structure and function(Reference Emery, Norambuena and Trushenski59). In rats, the DHA:EPA ratio is highly dependent upon tissue with EPA > DHA in blood and liver, but DHA greatly exceeding EPA in heart and brain, and dietary ALA and ALA:LA ratio (no dietary EPA and DHA) had relatively little impact on tissue DHA:EPA ratios(Reference Talahalli, Vallikannan and Sambaiah84).
While the above discussed quantitative and semi-quantitative data were the primary focus, the present study also provided some additional insight into the fates of endogenously produced LC-PUFA. Irrespective of diet, the relative proportions of total LC-PUFA, EPA, DHA and ARA were all higher in total PL than in TAG as would be expected(Reference Tocher60). However, this pattern was greatly enhanced in fish fed the experimental feeds compared with fish fed the reference diet, clearly indicating that endogenously produced EPA, DHA and ARA were highly preferentially incorporated into membrane PL, whereas greater proportions of dietary LC-PUFA are deposited in storage lipid. To discriminate tissue preferences for the deposition of endogenously produced LC-PUFA, we compared the contents of individual tissues with the content in whole fish. Thus, tissues showing higher contents per unit mass than whole fish indicate preferential deposition. This was clearly observed in the high DHA content of brain, which reflected the known importance of DHA in that tissue(Reference Tocher60). The only other tissue that showed higher contents of LC-PUFA was liver, probably reflecting its key metabolic role in biosynthesis(Reference Tocher28,Reference Tocher60) . Gene expression confirmed the active role of liver in the biosynthesis of LC-PUFA with the expression of fads2d6 and fads2d5 and elovl2 all being up-regulated in fish fed the experimental feeds devoid of EPA and DHA, consistent with many previous studies in salmon(Reference Monroig, Zheng and Morais32,Reference Monroig, Tocher, Castro and Burdge71) . However, dietary ALA:LA ratio appeared to have little effect, suggesting that substrate levels were not a major driver of expression of these genes(Reference Torstensen, Tocher, Turchini, Ng and Tocher38). Similarly, there was no effect of dietary ALA:LA ratio on the expression of Δ6 desaturase and elovl5 in liver of rainbow trout(Reference Emery, Hermon and Hamid68). Dietary ALA:LA ratio affected the expression of Δ6 and Δ4 desaturases and elovl5 in the marine rabbit fish (Siganus canaliculatus), which has all the genes necessary for biosynthesis of EPA and DHA, but in a variable manner with no clear pattern(Reference Xie, Liu and Wang81). Interestingly, in the present study, brain showed relatively high contents of EPA in addition to DHA, which may indicate in situ production of DHA in brain. However, it is not possible to discriminate what proportion, if any, of brain DHA is actually the result of in-tissue production or simply deposition of DHA produced elsewhere, such as liver(Reference Tocher28,Reference Tocher60) . Furthermore, the fact that the high content of DHA in brain was not reflected in ARA content of brain was surprising(Reference Tocher60).
The increased expression of the lipid anabolic genes, sreb1, sreb2 and fas, as dietary ALA:LA decreased was also unexpected. It is worth noting that the effect of diet on gene expression can be looked at in two ways. Either that high dietary ALA and high ALA:LA ratio resulted in lower expression or that high dietary LA and low ALA:LA ratio increased expression. Irrespective, the dietary effect does not have an obvious biochemical or physiological explanation. Similarly, while it was also interesting that genes related to lipid catabolism, ppara, pparg and aco, all showed a similar pattern of expression among the three experimental feeds, with lowest expression at a dietary ALA:LA ratio of 1, the pattern was not readily explained. While it is perhaps noteworthy that the expression of the fads2d6 and fads2d5 and elovl2 also showed the same expression pattern as for the lipid catabolism genes, it does not offer an explanation. Therefore, the precise mechanism(s) underlying how dietary ALA:LA ratio affected the expression of lipid anabolic and catabolic genes was not clear and requires further study.
The data obtained in the present study have provided a better understanding of the capacity for LC-PUFA production in a vertebrate, Atlantic salmon, that has a complete biosynthetic pathway (via the Sprecher shunt), and how dietary ALA and LA interact and affect LC-PUFA production. Salmon farming is currently still largely dependent upon FO for provision of EPA and DHA, but levels of FO in feeds continue to decline(Reference Ytrestøyl, Aas and Åsgård85), resulting in reduced levels of EPA in DHA in farmed salmon products(Reference Sprague, Dick and Tocher18). Presently, about 70 % of oil in salmon feeds is supplied by VO that can only supply C18 PUFA, LA and ALA(Reference Gunstone, Harwood, Gunstone, Harwood and Dijkstra27) and, though there are potential new algal and GM-derived sources of EPA and DHA on the horizon, it is uncertain exactly how these will be used(Reference Tocher, Betancor and Sprague86). Currently, cost and availability restrict the use of these new sources, for the medium term at least, so that FO replacements maintain EPA and DHA at current levels, and not as VO replacements and, therefore, salmon feeds will continue to contain high levels of VO. However, there are many options with oils containing differing proportions of ALA and LA, and the data from the present study enable the possibility to more precisely control dietary ALA and LA to maximise endogenous production of EPA and DHA.
Conclusions
With a dietary n-3:n-6 PUFA ratio of 1:1, Atlantic salmon fry/parr can produce at least 4·4 mg n-3 LC-PUFA, with a DHA:EPA ratio of 3·4:1, per g fish. Production of n-3 LC-PUFA exceeded that of n-6 LC-PUFA by almost 9-fold. Reducing the dietary n-3:n-6 PUFA ratio reduced n-3 LC-PUFA production and EPA:ARA and DHA:ARA ratios, and increased n-6 LC-PUFA production, and DHA:EPA ratio. The data advance nutritional science by providing insight into and a clearer understanding of the quantitative capacity of the pathway in a vertebrate that has complete LC-PUFA biosynthesis pathways (via the Sprecher shunt), and how dietary ALA and LA interact and quantitatively affect LC-PUFA production.
Acknowledgements
The salmon feeding trial and sampling was supported by a European Commission Aquaexcel2020 Trans-National Access (TNA) grant (D. R. T. and M. B. B., grant no. AE040061). Biochemical and molecular analyses were supported by the UKRI Biotechnology and Biological Science Research Council Grant (D. R. T., grant no. BB/R018812/1). The European Commission and the Biotechnology and Biological Science Research Council had no role in the design, analysis or writing of this article.
D. R. T. conceived and designed the study and drafted the initial manuscript. B. D. G. formulated and manufactured the feeds. R. E. O. and O. T. managed and supervised the salmon feeding trial in Norway. M. B. B., B. D. G., M. S. and R. E. O. performed all sampling. M. S. and G. X. carried out all the lipid and fatty acid analyses. M. B. B. performed the liver gene expression analyses. All authors contributed to and edited the manuscript.
There are no conflicts of interest.
Supplementary material
For supplementary material/s referred to in this article, please visit https://doi.org/10.1017/S0007114519001946


