


The metabolic syndrome (Mets) is a cluster of risk factors for type 2 diabetes mellitus and CVD. These risk factors include elevated fasting plasma glucose, elevated blood pressure, elevated TAG, reduced HDL-cholesterol and elevated waist circumference(Reference Alberti, Eckel and Grundy1). Dietary factors have been implicated in the cause and prevention of the Mets. Plant-based dietary patterns have been recommended for the prevention and management of the Mets(Reference Pérez-Martínez, Mikhailidis and Athyros2). In contrast, Western-style dietary patterns, which are characterised by a high intake of fats, added sugars, animal-sourced foods and refined carbohydrates, have been suggested to contribute to the development of the Mets(Reference Pérez-Martínez, Mikhailidis and Athyros2).
The associations between red meat, fish and poultry consumption are inconclusive and difficult to interpret in aggregate. The associations between red meat(Reference Damião, Castro and Cardoso3–Reference Pasdar, Moradi and Esfahani16) and fish(Reference Mennen, Lafay and Feskens17–Reference Mirmiran, Asghari and Dizavi30) consumption, and the Mets have been inconsistent across different study populations. Some, but not all, studies have demonstrated a positive correlation with high red meat consumption(Reference Azadbakht and Esmaillzadeh4,Reference de Oliveira Otto, Alonso and Lee5,Reference Cocate, Natali and de Oliveira7–Reference Guo, Gao and Ma9,Reference Xu, Wu and Deng12,Reference Luan, Wang and Campos14,Reference Huang, Wang and Wang15) and a negative correlation with high fish consumption(Reference Ruidavets, Bongard and Dallongeville19,Reference Baik, Abbott and Curb21,Reference Zaribaf, Falahi and Barak24,Reference Kim, Xun and Iribarren25,Reference Tørris, Molin and Cvancarova27,Reference Karlsson, Rosendahl-Riise and Dierkes28,Reference Mirmiran, Asghari and Dizavi30) . Although the lack of an association between poultry consumption and the Mets has been consistently observed in a few studies(Reference Damião, Castro and Cardoso3,Reference Baik, Lee and Jun6,Reference Kim and Je11,Reference Li, Zhao, Yu and Wang29) , their findings need to be replicated and confirmed in different populations.
Evidence on the associations between red meat(Reference Guo, Gao and Ma9,Reference Xu, Wu and Deng12,Reference Huang, Wang and Wang15) , fish(Reference Li, Zhao, Yu and Wang29) and poultry(Reference Li, Zhao, Yu and Wang29) consumption, and the Mets in Chinese populations is limited. Moreover, nearly all previous studies(Reference Guo, Gao and Ma9,Reference Xu, Wu and Deng12,Reference Li, Zhao, Yu and Wang29) on the topic have investigated red meat, fish or poultry consumption as one of the variables that might be associated with the Mets but not as the main exposure of interest. Thus, variables adjusted in their multivariable analysis may not be appropriate to study the association of red meat, fish and poultry consumption with the Mets. Notably, dietary factors have rarely been adjusted(Reference Guo, Gao and Ma9,Reference Xu, Wu and Deng12,Reference Li, Zhao, Yu and Wang29) . Furthermore, no studies have investigated the influence of red meat, fish and poultry consumption on Mets components in Chinese populations. Red meat(Reference Becerra-Tomás, Babio and Martínez-González8,Reference Esfandiar, Hosseini-Esfahani and Mirmiran13) , fish(Reference Zaribaf, Falahi and Barak24) and poultry(Reference Becerra-Tomás, Babio and Martínez-González8) have been shown to have distinct associations with components of the Mets in non-Chinese populations.
To refine and expand upon the evidence of the associations between red meat, fish and poultry consumption, and the Mets in Chinese populations, we conducted a cross-sectional study to investigate the associations between red meat, fish and poultry consumption, and the prevalence of the Mets and its components among the residents of Suzhou Industrial Park, which represent Southeast Chinese populations. Furthermore, the availability of published observational studies on the associations between red meat, fish and poultry consumption, and the Mets offers an opportunity to facilitate a meta-analysis of observational studies that could help understand and interpret these inconclusive associations.
Methods
The present study
Study population
The participants of the present cross-sectional study were random samples of the residents of Suzhou Industrial Park (Suzhou City, Jiangsu Province) aged 18 years and older. They were recruited (on a volunteer basis) to undergo a physical examination, provide overnight fasting blood samples and complete a brief interview at hospitals and health examination centres throughout Suzhou Industrial Park between July 2013 and November 2014(Reference Hidayat, Yu and Yang31). A total of 7998 individuals agreed to participate. Of these 7998 participants, 1339 participants with missing information on red meat, fish and poultry consumption and 2235 participants with missing information on any component of the Mets were excluded. Finally, a total of 4424 participants were eligible for the present analysis. The study protocol was approved by the Ethics Committee of Soochow University. All participants signed an informed consent form.
Data collection
All participants underwent structured interviews, fasting venepuncture and measurement of blood pressure and anthropometrics at enrolment. All interviews, examinations, sample collections and measurements were performed by trained personnel. All study participants were individually interviewed from a structured questionnaire for information on demographic characteristics (age, sex and education level), behavioural characteristics (alcohol consumption, smoking status, physical activity, sleep duration and television watching duration), food group consumption (see section Dietary assessment) and the use of medications for diabetes, dyslipidaemia or hypertension.
Dietary assessment
Dietary information was obtained using an interviewer-administered FFQ(Reference Hidayat, Yu and Yang31). During the interview, the participants were questioned about the frequency and portion size of several food groups (red meat, fish, poultry, fruits, vegetables, soya, nuts, salted vegetables and milk) consumed in the past year. The red meat group included pork, beef, mutton, lamb and goat. The poultry group included chicken, goose and duck. The fish group included freshwater fish and saltwater fish. The FFQ was not designed to differentiate fresh red meat, fish and poultry from processed red meat, fish and poultry. Therefore, the current data did not allow further stratification according to the extent of processing (fresh v. processed).
Blood samples and anthropometric measurements
Overnight-fasted (10–12 h) blood samples were drawn by venepuncture for measurement. The concentrations of glucose, total cholesterol, TAG, HDL-cholesterol and LDL-cholesterol in serum were measured enzymatically using an autoanalyser (Olympus AU640). Seated blood pressure was measured three times using a manual mercury sphygmomanometer (Shanghai Zhangdong Med-Tech Ltd). Anthropometrics were measured by trained personnel according to standard protocols. Height and waist circumference were measured to the nearest 0·1 cm, while weight was taken to the nearest 0·1 kg. BMI was calculated by dividing weight in kg by height in metres squared.
Metabolic syndrome definition
The Mets was defined according to the joint interim statement (JIS) of the International Diabetes Federation, National Heart, Lung, and Blood Institute, American Heart Association, World Heart Federation, International Atherosclerosis Society and International Association for the Study of Obesity(Reference Alberti, Eckel and Grundy1). Participants were considered to have the Mets if they had three or more of the following components:
-
Elevated waist circumference for Asian populations (≥90 cm in men and ≥80 cm in women).
-
Elevated TAG (≥150 mg/dl (1·7 mmol/l) or on drug treatment for elevated TAG).
-
Reduced HDL-cholesterol (<40 mg/dl (1·04 mmol/l) in men and <50 mg/dl (1·3 mmol/l) in women or on drug treatment for reduced HDL-cholesterol).
-
Elevated blood pressure (≥130 mmHg systolic or ≥85 mmHg diastolic or taking antihypertensive medications).
-
Elevated fasting blood glucose (≥100 mg/dl (5·6 mmol/l) or taking glucose-lowering medications).
Data analysis
The frequency of food consumption was recorded as never, less than once/month, 1–3 times/month, 1–2 times/week, 3–4 times/week, 5–6 times/week, 1 time/d or ≥1 time/d. The portion size of food consumed was estimated using traditional Chinese weight units (i.e. 1 jin = 0·5 kg; 1 liang = 50 g). The average daily consumption (g/d) of each food group was estimated by multiplying the standard portion size (g) by the consumption frequency for each food to obtain daily consumption. The participants were categorised into quartiles according to the average daily consumption of red meat, fish and poultry. A χ 2 test (categorical variables) and one-way ANOVA (continuous variables) were used to assess the difference in participant characteristics across the quartiles of red meat, fish and poultry consumption. A multivariable logistic regression model was applied to estimate the OR and 95 % CI for the prevalence of the Mets and its components according to red meat, fish and poultry consumption. The first quartile of red meat, fish and poultry consumption was assigned as the reference category. The multivariable models were adjusted for age, sex, education, smoking, alcohol consumption, physical activity, sleep duration, television watching duration, BMI and consumption of fruits, vegetables, nuts, soya, milk and salted vegetables. All statistical analyses were performed using SPSS version 20.0 (SPSS Inc.). All P-values were two-sided, and the level of significance was set at <0·05.
Meta-analysis
We performed a meta-analysis that included data from the present study and published observational studies. The research question was defined by the participants, interventions, comparisons, outcomes and study design (online Supplementary Table S1). Briefly, observational studies (cross-sectional and cohort studies) that reported risk estimates (hazard ratios, relative risks (RR) or ORs) with their corresponding 95 % CI were performed to quantify the association between red meat, fish and poultry consumption, and the Mets and its components in adults. The PubMed and Web of Science databases were searched for relevant observational studies published in any language from their inception until 31 December 2020. The following search terms were employed to identify the relevant studies: (meat OR fish OR poultry) AND (metabolic syndrome OR insulin resistance syndrome). The maximally adjusted risk estimates were extracted from each eligible study. For greater statistical ease and simplicity, any risk estimate reported in the included studies was considered equivalent to the RR. The Newcastle Ottawa Scale(Reference Wells, Shea and O’connell32) was used to assess the quality of the included studies. A random effects model(Reference DerSimonian and Laird33) was used to estimate the summary RR with their corresponding CI for the associations between the highest v. lowest category of red meat, fish and poultry consumption, and the Mets and its components. Subgroup and meta-regression analyses were performed according to the predefined criteria (study design, geographic region, country, Mets criteria, sex, subtypes of exposure and adjustment for total energy intake, BMI, physical activity, alcohol intake, smoking and consumption of vegetables, fruits, milk/dairy, red meat or fish) to investigate the source of heterogeneity and potential effect modifiers. The statistical heterogeneity across studies was determined using the I 2 statistic, for which the degree of heterogeneity was classified using the following cut-off points: <25 % (low heterogeneity), 25–50 % (moderate heterogeneity) and >50 % (high heterogeneity)(Reference Higgins, Thompson and Deeks34). Publication bias was assessed using Begg’s rank correlation test and Egger’s linear regression test(Reference Egger, Davey Smith and Schneider35). If publication bias was evident, the trim and fill method was performed to adjust the bias(Reference Duval and Tweedie36). All statistical analyses were performed using STATA software, version 11.0 (STATA Corp.).
Results
The present study
The mean age of the study participants was 55 years. Among the study participants, 53 % were women, 95 % had less than a high school education, 77 % did not consume alcohol weekly and 78 % had never smoked. The characteristics of the study participants according to red meat, fish and poultry consumption are presented in Table 1. In general, the participants in higher quartiles of red meat, fish or poultry consumption were younger, consumed more alcohol, were more likely to be current smokers and had a lower BMI than those in the first quartile. Red meat consumption was inversely associated with vegetable consumption but positively associated with the consumption of fruits, soya, fish, poultry, salted vegetables and nuts. Fish consumption was inversely associated with salted vegetable consumption but positively associated with the consumption of fruits, vegetables, soya, red meat, poultry and nuts. Poultry consumption was positively associated with the consumption of fruits, vegetables, soya, red meat, fish, salted vegetables and nuts.
Table 1. Characteristics of the study participants according to red meat, fish and poultry consumption
(Mean values and standard deviations)

* The P values for differences between quartiles were calculated using χ 2 test (categorical variables) and one-way ANOVA (continuous variables).
The multivariable-adjusted OR (95 % CI) for the prevalence of the Mets according to red meat, fish and poultry consumption are presented in Table 2. After adjustment for demographic characteristics, behavioural characteristics and food group consumption, the associations between red meat or fish consumption and the prevalence of the Mets were statistically significant only in the highest quartile. The participants in the highest quartile of red meat consumption had higher odds of having the Mets than those in the lowest quartile (OR 1·23, 95 % CI 1·02, 1·48), whereas participants in the highest quartile of fish consumption had lower odds of having the Mets than those in the lowest quartile (OR 0·83, 95 % CI 0·72, 0·97). The associations between red meat or fish consumption and the prevalence of the Mets appeared to be largely driven by the strong associations between red meat or fish consumption and the prevalence of certain components of the Mets. A higher odds of having elevated waist circumference was observed among participants in the top three quartiles of red meat consumption, whereas a lower odds of having elevated TAG, reduced HDL-cholesterol and elevated fasting blood glucose was observed among participants in the top three quartiles of fish consumption. Poultry consumption was not associated with the odds of having the Mets and its components.
Table 2. Multivariable-adjusted OR (95 % CI)* for the prevalence of the metabolic syndrome and its components according to red meat, fish and poultry consumption
(Numbers and percentages; odds ratio and 95 % confidence intervals)
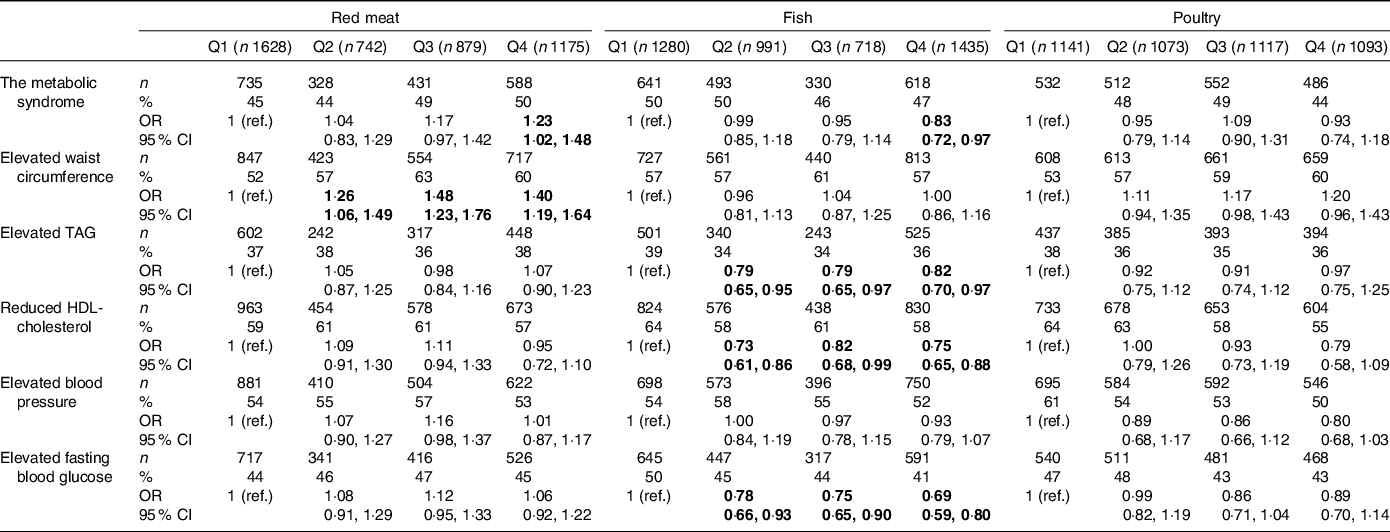
Bold numbers indicate statistical significance (P < 0·05).
* Adjusted for age, sex, education, smoking, alcohol, physical activity, sleep duration, television watching duration, BMI and consumption of fruits, vegetables, nuts, soya, milk and salted vegetables; in addition, red meat, fish and poultry consumption were adjusted for one another.
Meta-analysis
The flow chart of the study selection process with the reasons for exclusion is presented in Supplementary Fig. S1. The reference list of the excluded studies is reported in Supplementary Appendix S1. There was complete agreement between the investigators regarding the results of database searches. A prospective cohort study(Reference Baik, Lee and Jun6) that was conducted in the same study cohort as the included study(Reference Baik, Abbott and Curb21) was not selected owing to the lack of clarity regarding the exposure definition. A prospective cohort study(Reference Becerra-Tomás, Babio and Martínez-González8) that investigated the association between the consumption of poultry and rabbits and the Mets was excluded from the analysis of poultry consumption because rabbits are not considered poultry, which are domesticated birds kept by humans for their eggs, meat or feathers. A cross-sectional study(Reference Pasdar, Moradi and Esfahani16) on the association between poultry and fish consumption and the Mets was not included in the analysis of either fish or poultry because poultry and fish were combined as a single exposure.
In addition to the present cross-sectional study, twenty-eight other observational studies (nine cohort studies(Reference Damião, Castro and Cardoso3,Reference de Oliveira Otto, Alonso and Lee5,Reference Baik, Lee and Jun6,Reference Becerra-Tomás, Babio and Martínez-González8,Reference Esfandiar, Hosseini-Esfahani and Mirmiran13,Reference Huang, Wang and Wang15,Reference Baik, Abbott and Curb21,Reference Kim, Xun and Iribarren25,Reference Mirmiran, Asghari and Dizavi30) and nineteen cross-sectional studies(Reference Azadbakht and Esmaillzadeh4,Reference Cocate, Natali and de Oliveira7,Reference Guo, Gao and Ma9–Reference Xu, Wu and Deng12,Reference Luan, Wang and Campos14,Reference Pasdar, Moradi and Esfahani16–Reference Shin, Lim and Sung20,Reference Kouki, Schwab and Hassinen22–Reference Zaribaf, Falahi and Barak24,Reference Tørris, Molin and Cvancarova Småstuen26–Reference Li, Zhao, Yu and Wang29) ) were also included in the meta-analysis of the associations between the highest v. lowest categories of red meat(Reference Damião, Castro and Cardoso3–Reference Pasdar, Moradi and Esfahani16), fish(Reference Mennen, Lafay and Feskens17–Reference Mirmiran, Asghari and Dizavi30) and poultry(Reference Damião, Castro and Cardoso3,Reference Baik, Lee and Jun6,Reference Kim and Je11,Reference Li, Zhao, Yu and Wang29) consumption, and the Mets. The duration of follow-up in the cohort studies ranged from 3·6 to 25 years. Dietary information was assessed using an FFQ in all studies. Although all studies reported adjusted risk estimates, there was substantial variation in the selection and number of variables controlled across studies. The characteristics of the included studies are summarised in Supplementary Tables S2–S4. Nearly all the studies (26 of 28) were considered to be of good quality (The Newcastle Ottawa Scale ≥ 7) (online Supplementary Tables S5 and S6).
In the meta-analysis of the highest v. lowest categories of consumption, high red meat consumption was positively associated with the Mets (RR 1·20, 95 % CI 1·06, 1·35; Fig. 1), whereas high fish consumption was inversely associated with the Mets (RR 0·88, 95 % CI 0·81, 0·96; Fig. 2). No association was observed between high poultry consumption and the Mets (RR 0·97, 95 % CI 0·85, 1·10; Fig. 3). Moderate heterogeneity was observed in the analysis of poultry (I 2 = 42 %), while high heterogeneity was evident in the analyses of red meat and fish (I 2 ≥ 70 %). There was no evidence of publication bias (all P Begg’s ≥ 0·48; all P Egger’s ≥ 0·27).

Fig. 1. The association between the highest v. lowest categories of red meat consumption and the metabolic syndrome. Weights are from random effects analysis. The I-squared describes the percentage of variation across studies that is due to heterogeneity rather than chance. The P value for heterogeneity was calculated from the Q test. RR, relative risk.

Fig. 2. The association between the highest v. lowest categories of fish consumption and the metabolic syndrome. Weights are from random effects analysis. The I-squared describes the percentage of variation across studies that is due to heterogeneity rather than chance. The P value for heterogeneity was calculated from the Q test. RR, relative risk.

Fig. 3. The association between the highest v. lowest categories of poultry consumption and the metabolic syndrome. Weights are from random effects analysis. The I-squared describes the percentage of variation across studies that is due to heterogeneity rather than chance. The P value for heterogeneity was calculated from the Q test. RR, relative risk.
The subgroup and meta-regression analyses of the associations between the highest v. lowest categories of red meat, fish and poultry consumption, and the Mets are presented in Table 3. The lack of an association between high poultry consumption and the Mets was consistently observed across subgroups. A tendency towards positive and inverse associations was observed across subgroups with high red meat consumption and high fish consumption, respectively. Although meta-regression analyses revealed that the overall associations between high consumption of red meat or fish and the Mets did not appear to be modified by study design, region, Mets criteria, subtypes of exposure and adjustment for certain variables (all P meta-regression ≥ 0·10), these associations did not consistently reach statistical significance throughout the subgroups. Stratification by study design did not significantly alter the association between high consumption of red meat or fish and the Mets. The association between high consumption of red meat or fish and the Mets became statistically non-significant after stratification by sex. A significant association between high consumption of red meat or fish and the Mets was evident only in the studies that used the JIS criteria (but not the National Cholesterol Education Program Adult Treatment Panel III (NCEP-ATP III) criteria) and in the studies that were conducted in American and European countries (but not Asian countries). In the country-specific meta-analysis, a positive association between high red meat consumption and the Mets was observed in Chinese and Brazilian studies. The inverse association between high fish consumption and the Mets was observed in Norwegian studies. By subtype of exposure, high consumption of processed or unprocessed red meat was positively associated with the Mets; in addition, higher lean fish, but not fatty fish, consumption was inversely associated with the Mets. The association between red meat or fish consumption and the Mets was nullified in the studies that adjusted for certain variables (BMI for red meat and consumption of vegetables or fruits for fish).
Table 3. Subgroup and meta-regression analyses of the associations between the highest v. lowest categories of red meat, fish and poultry consumption and the metabolic syndrome
(Risk ratios (RR) and 95 % confidence intervals)
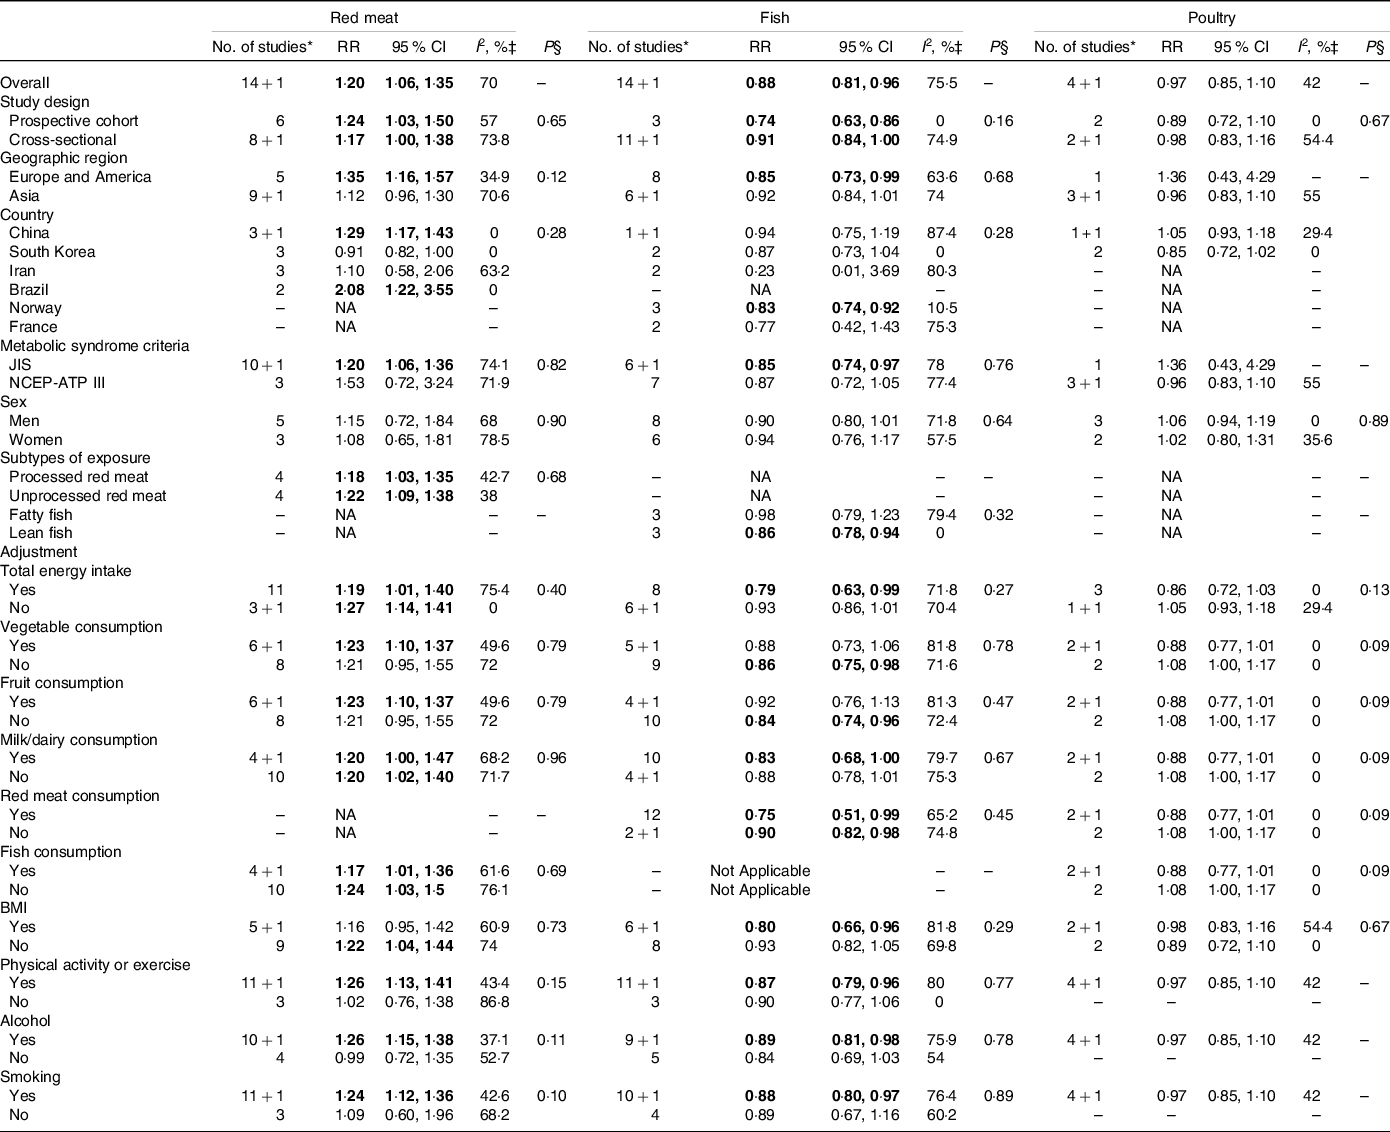
JIS, Joint Interim Statement; NA, Not applicable; NCEP-ATP III, National Cholesterol Education Program Adult Treatment Panel III; RR, relative risk.
Bold numbers indicate statistical significance (P < 0·05).
* +1 refers to the present cross-sectional study of the residents of Suzhou Industrial Park.
‡ I 2 describes the percentage of variation across studies that is due to heterogeneity rather than chance.
§ P value for heterogeneity between subgroups according to meta-regression analyses.
In the analyses of the components of the Mets, high red meat consumption was not associated with any components of the Mets (Fig. 4). High fish consumption was inversely associated with elevated TAG, reduced HDL-cholesterol and elevated fasting plasma glucose (Fig. 5). High poultry consumption was inversely associated with elevated blood pressure (Fig. 6).
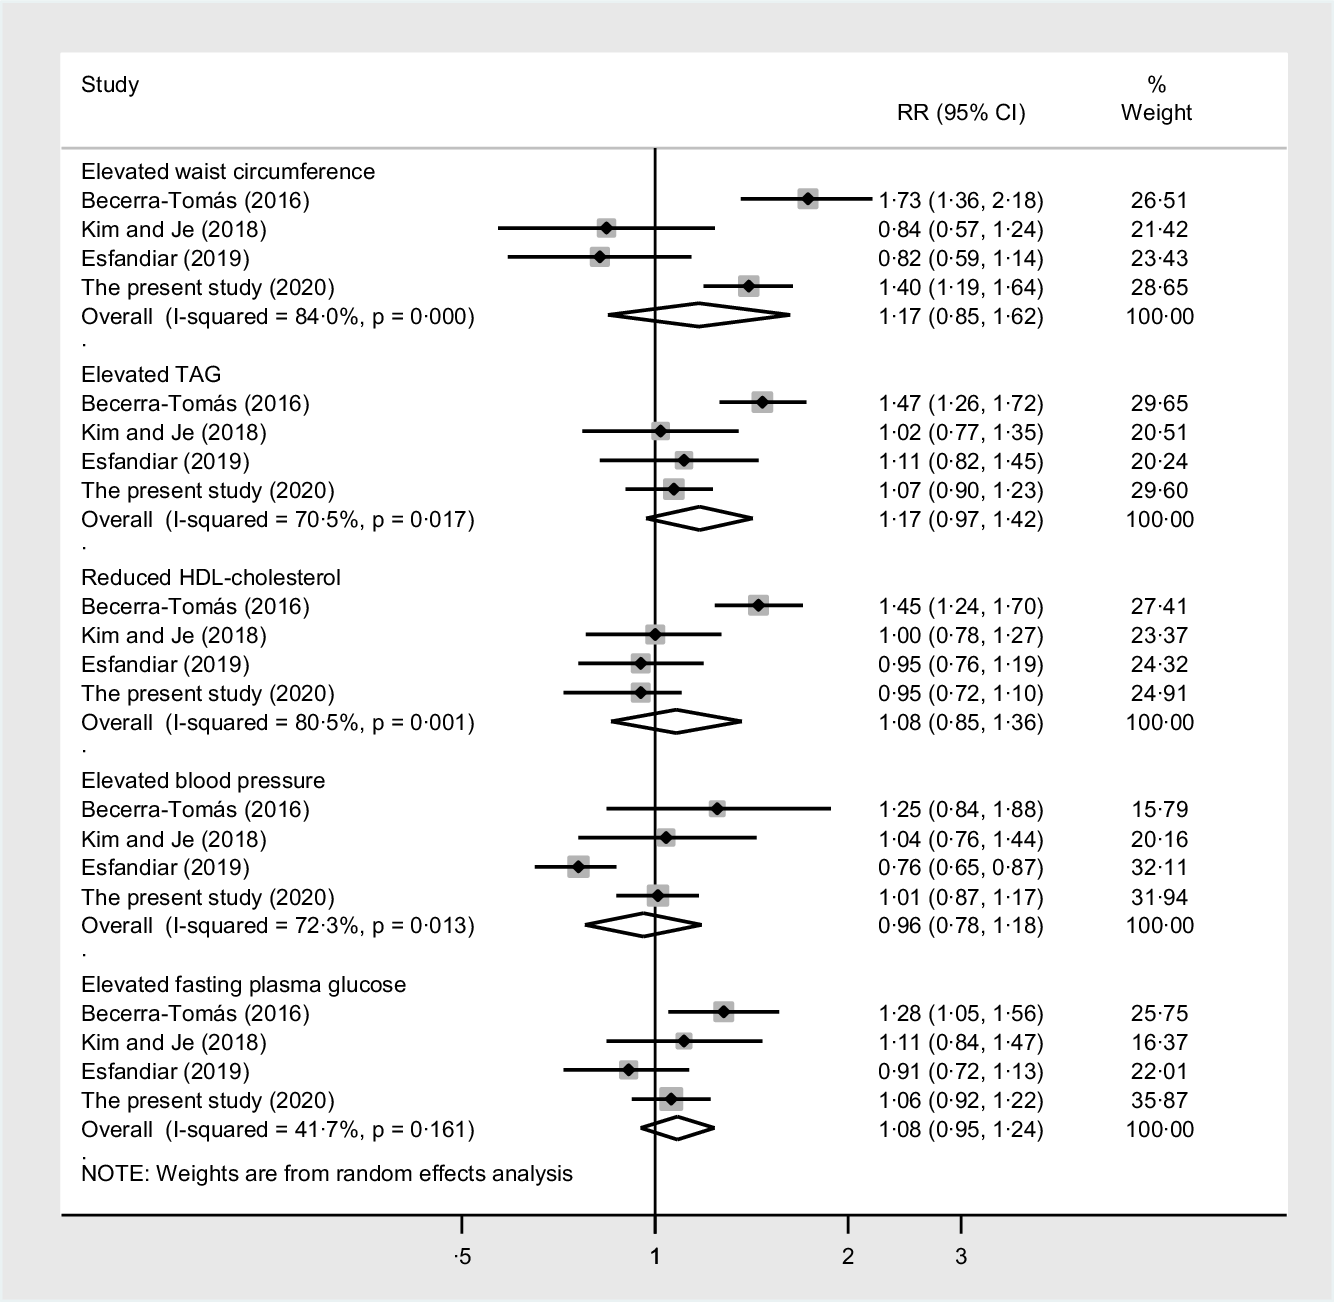
Fig. 4. The associations between the highest v. lowest categories of red meat consumption and the components of the metabolic syndrome. Weights are from random effects analysis. The I-squared describes the percentage of variation across studies that is due to heterogeneity rather than chance. The P value for heterogeneity was calculated from the Q test. RR, relative risk.

Fig. 5. The associations between the highest v. lowest categories of fish consumption and the components of the metabolic syndrome. Weights are from random effects analysis. The I-squared describes the percentage of variation across studies that is due to heterogeneity rather than chance. The P value for heterogeneity was calculated from the Q test. RR, relative risk.

Fig. 6. The associations between the highest v. lowest categories of poultry consumption and the components of the metabolic syndrome. Weights are from random effects analysis. The I-squared describes the percentage of variation across studies that is due to heterogeneity rather than chance. The P value for heterogeneity was calculated from the Q test. RR, relative risk.
Discussion
The present study
Our findings are in line with the majority of previous studies in non-Chinese populations and showed that the Mets was positively associated with red meat consumption(Reference Azadbakht and Esmaillzadeh4,Reference de Oliveira Otto, Alonso and Lee5,Reference Cocate, Natali and de Oliveira7,Reference Becerra-Tomás, Babio and Martínez-González8,Reference Luan, Wang and Campos14) , inversely associated with fish consumption(Reference Ruidavets, Bongard and Dallongeville19,Reference Baik, Abbott and Curb21,Reference Zaribaf, Falahi and Barak24,Reference Kim, Xun and Iribarren25,Reference Tørris, Molin and Cvancarova27,Reference Karlsson, Rosendahl-Riise and Dierkes28,Reference Mirmiran, Asghari and Dizavi30) and not associated with poultry consumption(Reference Damião, Castro and Cardoso3,Reference Baik, Lee and Jun6,Reference Kim and Je11) . Furthermore, the present cross-sectional study adds to the limited evidence available on the associations between red meat(Reference Guo, Gao and Ma9,Reference Xu, Wu and Deng12,Reference Huang, Wang and Wang15) , fish(Reference Li, Zhao, Yu and Wang29) and poultry(Reference Li, Zhao, Yu and Wang29) consumption, and the Mets in Chinese populations. The present data replicate and extend previous research findings that high red meat consumption (>100 g/d) is positively associated with the Mets in Chinese adults(Reference Guo, Gao and Ma9,Reference Xu, Wu and Deng12,Reference Huang, Wang and Wang15) . Only one study(Reference Li, Zhao, Yu and Wang29) has investigated the association between fish or poultry consumption and the Mets in Chinese adults. The lack of an association between poultry consumption and prevalent Mets was observed in our study and a previous cross-sectional study(Reference Li, Zhao, Yu and Wang29). However, our results of the reduced prevalence of the Mets among participants with the highest levels of fish consumption are in contrast with the null association between fish consumption and the prevalence of the Mets that was observed in a previous cross-sectional study(Reference Li, Zhao, Yu and Wang29). Since both studies used comparable study designs and cut-offs for the identification of Mets cases, the discrepancy in these findings could be partly explained by the lack of adjustment for dietary variables, particularly consumption of other food groups, in the previous cross-sectional study(Reference Li, Zhao, Yu and Wang29).
The associations between red meat(Reference Guo, Gao and Ma9,Reference Xu, Wu and Deng12,Reference Huang, Wang and Wang15) , fish(Reference Li, Zhao, Yu and Wang29) and poultry(Reference Li, Zhao, Yu and Wang29) consumption, and the components of the Mets have not been reported in previous Chinese studies. In the present study, the inverse association between fish consumption and the prevalence of the Mets appeared to be mainly driven by reduced prevalence of elevated TAG, reduced HDL-cholesterol and elevated fasting blood glucose. The positive association between red meat consumption and the prevalence of the Mets appeared to be largely driven by increased prevalence of elevated waist circumference. A relatively similar (but not identical) pattern of associations between red meat(Reference Becerra-Tomás, Babio and Martínez-González8,Reference Luan, Wang and Campos14) and fish(Reference Baik, Abbott and Curb21,Reference Zaribaf, Falahi and Barak24,Reference Kim, Xun and Iribarren25) consumption and certain components of the Mets was also seen in non-Chinese populations.
Several caveats need to be considered when interpreting the results of the present cross-sectional study. First, cross-sectional data cannot be used to infer a causal relationship between exposure and outcome. Second, dietary information was collected using an FFQ, which is prone to biases related to memory and sincerity. Third, although we adjusted for major lifestyle factors and major food groups related to the Mets(Reference Pérez-Martínez, Mikhailidis and Athyros2), the information on total energy intake and dietary nutrient intake was not assessed in the FFQ. Therefore, our inability to control potentially important dietary factors in our analyses may have led to an imprecise estimate of the true associations. Finally, the extent of processing, preparation methods and fat contents of the red meat, fish and poultry consumed could not be investigated in the present study. The influence of meat consumption on cardiometabolic health could vary depending on processing(Reference Micha, Michas and Mozaffarian37), preparation methods(Reference Liu, Zong and Hu38) and fat contents(Reference Kim, Xun and Iribarren25–Reference Tørris, Molin and Cvancarova27).
Meta-analysis
In the meta-analysis of the highest v. lowest categories of consumption, the Mets was positively associated with red meat and inversely associated with fish but was not associated with poultry. Similar findings were observed in both prospective cohort and cross-sectional studies. In the subgroup analyses, the lack of an association between poultry consumption and the Mets was observed across subgroups, while the association of red meat or fish consumption with the Mets did not reach significance in studies that used NCEP-ATP III criteria, in those that were conducted in Asian countries and in those that adjusted for certain variables (BMI for red meat and consumption of fruits or vegetables for fish).
The association between high red meat or fish consumption and the Mets was evident in the studies that used the JIS criteria but not in those that used the NCEP-ATP III criteria. The NCEP-ATP III criteria(39) have higher cut-offs for fasting blood glucose (≥6·1 mmol/l v. ≥5·6 mmol/l) and waist circumference (if not modified according to populations or ethnic groups) than the JIS criteria(Reference Alberti, Eckel and Grundy1). Therefore, fewer individuals could be diagnosed with the Mets if higher cut-offs were used (or vice versa), which may explain the weak association for the NCEP-ATP III criteria and strong association for the JIS criteria.
The association between high red meat or fish consumption and the Mets was only observed in the studies conducted in American and European countries but not in those conducted in Asian countries. The geographic discrepancies of the association between high red meat or fish consumption and the Mets could be partly explained by the differences in the amounts, frequency and species of red meat or fish consumed within and between populations.
The positive association between high red meat consumption and the Mets was not evident in the studies that adjusted for BMI, while the inverse association between high fish consumption and the Mets was not observed in the studies that adjusted for fruit or vegetable consumption. Cumulative epidemiological evidence suggests that red meat consumption is positively associated with adiposity measures (BMI and waist circumference) and obesity risk(Reference Rouhani, Salehi-Abargouei and Surkan40). Excess adiposity is a well-established risk factor for cardiometabolic conditions. Thus, the positive association between red meat consumption and the Mets could have been confounded by BMI. There is evidence that fish consumption is positively associated with the consumption of foods perceived as healthy, particularly fruits and vegetables(Reference Turunen, Männistö and Suominen41–Reference Barberger-Gateau, Jutand and Letenneur43), in certain populations. High fruit or vegetable consumption has been shown to be inversely associated with the Mets(Reference Lee, Lim and Kim44). Therefore, the inverse association between high fish consumption might be partly explained by the positive correlations of fish with fruits or vegetables.
No clear pattern of associations was observed between red meat or poultry consumption and Mets components. However, the association between high fish consumption and the Mets appeared to be partly driven by the inverse association of fish consumption with elevated TAG and reduced HDL-cholesterol and, to a lesser extent, fasting plasma glucose. Among individual studies investigating the association between fish consumption and the Mets, the inverse associations of high fish consumption with elevated TAG and reduced HDL-cholesterol were consistently observed in all studies(Reference Baik, Abbott and Curb21,Reference Zaribaf, Falahi and Barak24,Reference Kim, Xun and Iribarren25) , including our study; however, such associations were less consistently observed with other components of the Mets. The distinct influence of fish consumption on the components of the Mets could partly be explained by the differential effects of fish nutrients, such as marine n-3 fatty acids, on the components of the Mets. Fish, particularly fatty fish, are an important source of marine n-3 fatty acids, EPA and DHA(Reference Tørris, Småstuen and Molin45). Accumulating evidence from randomised controlled trials suggests that n-3 fatty acid supplementation(Reference Balk, Adams and Langberg46) may reduce TAG levels and increase HDL-cholesterol levels. However, marine n-3 fatty acid supplementation fails to convincingly improve other components of the Mets(Reference Balk, Adams and Langberg46–Reference Zhang, Liu and Zhao48).
There are several limitations to consider when interpreting the findings of the present meta-analysis of observational studies. First, the possibility that the observed findings might be due to residual or unmeasured confounders cannot be ruled out. Second, the limited number of available prospective cohort studies for each analysis limits the ability to draw more conclusive evidence. Third, the presence of heterogeneity in all analyses suggests that the results should be cautiously interpreted. Although we could not pinpoint the exact source of heterogeneity, the variations in the study and participant characteristics may contribute to differences in the strength and, in some cases, the direction of associations, leading to heterogeneity across studies. Fourth, the findings of the analyses of Mets components may not accurately represent the estimates because the majority of the included studies did not report the associations between the exposure of interest and the components of the Mets.
Conclusions
In summary, the findings from the present cross-sectional study and meta-analysis of observational studies add weight to the evidence that the Mets may be positively associated with red meat consumption, inversely associated with fish consumption and neutrally associated with poultry consumption. Additional data from prospective cohort studies investigating the associations between red meat, fish and poultry consumption, and the incidence of the Mets across different subpopulations are warranted to determine the nature of our findings.
Acknowledgements
The present study was financially supported by grants from the National Key R&D Program of China (2017YFC1310700 and 2017YFC1310701), National Natural Science Foundation of China (no. 81973024), key technologies of prevention and control of major diseases and infectious diseases in Suzhou City (GWZX201706, GWZX201804 and GWZX201907) and Priority Academic Program Development of Jiangsu Higher Education Institutions (PAPD).
Khemayanto Hidayat: Conceptualization, Methodology, Software, Formal analysis, Investigation, Data Curation, Writing - Original Draft; Wan-Zhan Zhu: Methodology, Software, Formal analysis, Investigation, Data Curation; Si-Min Peng: Methodology, Software, Investigation, Visualization; Jin-Jin Ren: Methodology, Software, Investigation, Visualization; Meng-Lan Lu: Resources; Hai-Peng Wang: Resources; Jia-Ying Xu: Resources; Hui Zhou: Resources; Lu-Gang Yu: Data Curation, Funding acquisition, Project Administration; Li-Qiang Qin: Data Curation, Supervision, Funding acquisition, Writing- Reviewing and Editing.
The authors report no conflicts of interest relevant to this article.
Supplementary material
For supplementary material accompanying this paper visit https://doi.org/10.1017/S0007114521002452


