
Nitrogen (N) is the element that most frequently limits food production in the tropics as well as in the temperate region. With the exception of some recently cleared land, most cultivated soils are deficient in this element. Most natural systems in the temperate region are nitrogen-limited, but not so in the tropics with older Oxisols, Ultisols and some sandy soils where they are more phosphorus-limited. The nitrogen cycle is being drastically disrupted. The purpose of this chapter is to describe the basic soil nitrogen dynamics (Fig. 13.1), the four main sources of reactive nitrogen – atmospheric deposition, biological nitrogen-fixation, fertilizer nitrogen and soil organic nitrogen (SON) mineralization – and the management of all four in relation to tropical agriculture and the environment. Given the popular concerns about nitrogen pollution and mineral fertilizers in general, the environmental dimensions of nitrogen form an important component of this chapter.
13.1 The Nitrogen Cycle
Nitrogen is the most abundant element in the Earth’s atmosphere, accounting for about 78 percent of the air anywhere in the world, presumably including air in the soil pores. We face the paradox that while most of our air is nitrogen, most of our crops suffer from nitrogen deficiency. This is because virtually all the nitrogen in our atmosphere is inert nitrogen (N2). The bond between the two nitrogen atoms is very strong and requires much energy (941 kJ/mol) to break it down into reactive nitrogen (Nr).
Reactive nitrogen consists of two main reduced forms, ammonium (NH4+) and ammonia (NH3); several oxidized forms such as nitrate (NO3–), nitrite (NO2–), nitrous oxide (N2O), nitric oxide (NO) and nitrogen dioxide (NO2); and some organic forms like urea and amines. NO and NO2 are generally added as NOx. Plants take up nitrogen as nitrate or ammonium ions and convert them to amino acids, proteins and DNA. Plants are consumed by animals, and both plants and animals by humans, where these nitrogen compounds are an essential part of our nutrition.
Figure 13.2 shows the clear correlation between world population and Nr creation, mainly fertilizer production by the Haber–Bosch process. This has resulted in major changes in the nitrogen cycle, second only to those in the carbon cycle. In many ways, nitrogen is the new carbon, in terms of the changes in element cycling and what it means to human and ecosystem health. 1 teragram (Tg) of Nr equals 1012 grams or 1 million tons.
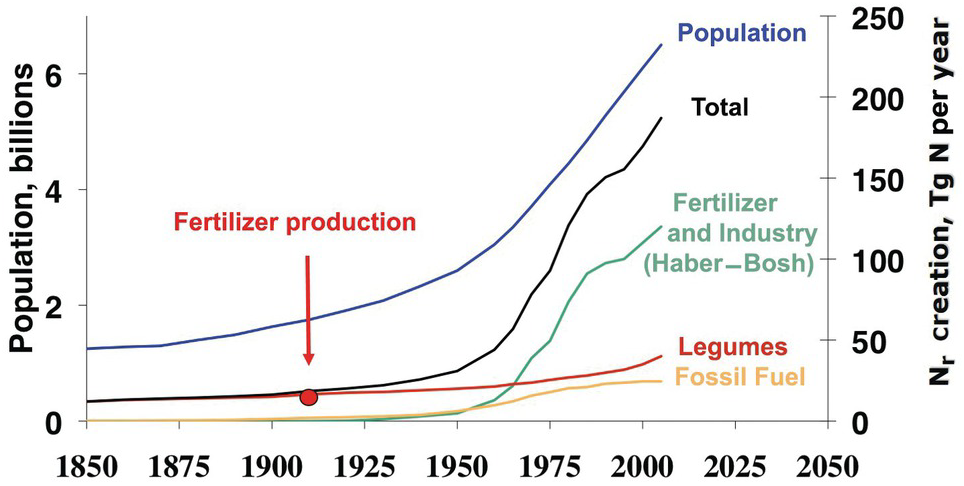
Fig. 13.2 Global Nr creation by human activity, 1850 to 2050. In 2005, ~190 Tg Nr was created annually by humans, in comparison to ~15 Tg Nr in 1850. The start of nitrogen fertilizer production is indicated. Legumes denote biological nitrogen fixation, and fossil fuel denotes N2O and NOx emissions.
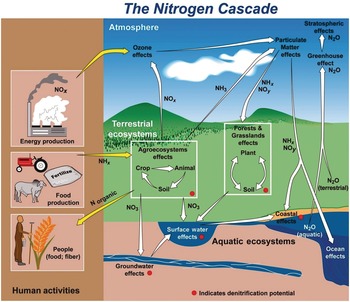
Several characteristics are not shared with other major elemental cycles including carbon (C) (Chapter 11), phosphorus (P) (Chapter 14) and sulfur (S) (Chapter 15). The nitrogen cycle has major cascade effects, is very “leaky,” and the bacteria responsible for most of the organic nitrogen mineralization are almost always nitrogen-starved (Vitousek et al. Reference Vitousek, Haettenschweiler, Olander and Allison2002). The nitrogen cascade means that a single atom can produce a sequence of effects in different stocks and flows (Fig. 13.1). One nitrogen atom can, in sequence, increase tropospheric ozone, increase fine particulate matter in the atmosphere, alter plant productivity, promote eutrophication and produce global warming (Galloway et al. Reference Galloway, Dentener, Capone, Boyer, Howarth, Seitzinger, Asner, Cleveland, Green, Holland, Karl, Michaels, Porter, Townsend and Vorosmarty2004).
The leakiness is due to reactive nitrogen inputs that leak out as NH3, N2O, NOx and N2 gases to the atmosphere, and are leached as NO3–, NH4+ and dissolved organic nitrogen below the soil and into water bodies (Fig. 13.3). This lowers the efficiency of nitrogen utilization by plants (Galloway et al. Reference Galloway, Aber, Erisman, Seitzinger, Howarth, Cowling and Jackcosby2003, International Nitrogen Initiative 2007). Leakiness is most marked in crop systems, and decreases when a tree–soil nutrient cycle is established in natural fallows and agroforestry systems. Leakiness is minimal in the nearly closed nutrient cycle of mature tropical forests.
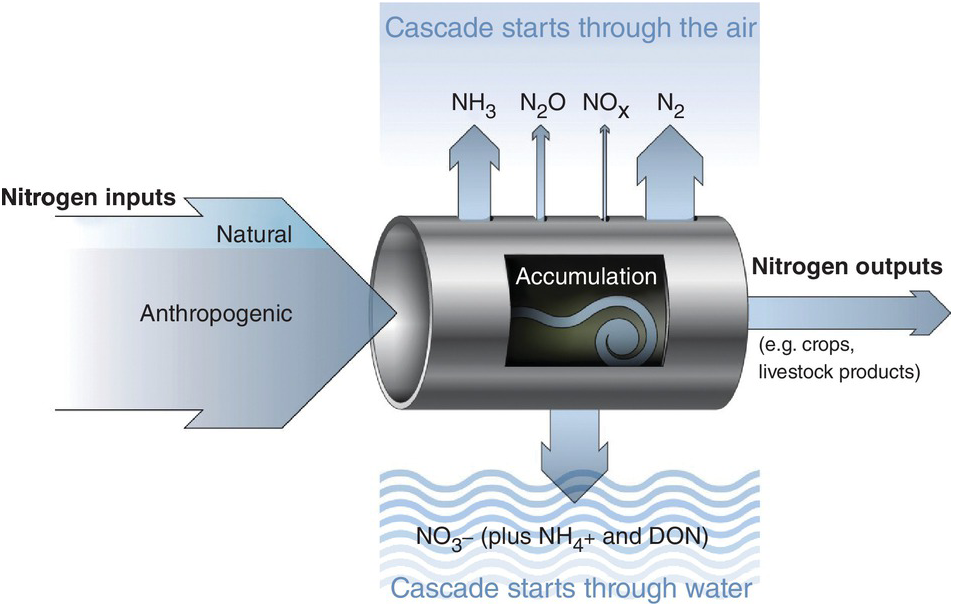
Fig. 13.3 Leakiness is illustrated by the holes-in-the-pipe concept.
Table 13.1 shows the different fluxes in the nitrogen cycle. The Nr creation is estimated to be almost twice in 2050 what it was in 1960. This is a much faster rate than the increase in carbon dioxide (CO2) in our atmosphere.
Table 13.1 Global Nr creation and distribution flows. Adapted from Galloway et al. Reference Galloway, Dentener, Capone, Boyer, Howarth, Seitzinger, Asner, Cleveland, Green, Holland, Karl, Michaels, Porter, Townsend and Vorosmarty2004.
The exponential increase of Nr has major positive and negative effects. The main positive consequence is the dramatic increase in per-capita food production, while still keeping up with population growth, 40–50 percent of which is directly attributed to nitrogen fertilizers (Smil Reference Smil2004). The other positive effect is the additional Nr deposition in natural and managed ecosystems, which provides nitrogen fertilization to accompany CO2 fertilization due to climate change.
The negative consequences are on the environment and on human health. Ladha et al. (Reference Ladha, Pathak, Krupnik, Six and van Kessel2005) and the International Nitrogen Initiative (2007) list the following major environmental damages: groundwater contamination; eutrophication of waterways and coastal areas, inducing hypoxia and “dead zones”; photochemical smog; fine-particulate air pollution; stratospheric ozone depletion; acid rain; ammonia redeposition; toxic algal blooms; and global warming. The International Nitrogen Initiative also lists the following detrimental effects on human health: respiratory diseases caused by tropospheric ozone and fine-particulate aerosols; increased allergenic pollen production; and possible nitrate toxicity in drinking water. These negatives should be balanced with the tremendous increases in protein consumption in poor regions of the world.
The consequences can be grouped in two: too much or too little nitrogen in agriculture, depending on the overall Nr balance, as shown in Table 13.2. The problems are totally different, and both take place in the tropics.
Table 13.2 Agricultural Nr balances differ by region, with temperate northern China showing “too much,” western Kenya “too little,” and midwestern United States roughly in balance. Adapted from Vitousek et al. (Reference Vitousek, Naylor, Crews, David, Drinkwater, Holland, Johnes, Katzenberger, Martinelli, Matson, Nziguheba, Ojima, Palm, Robertson, Sanchez, Townsend and Zhang2009).
| Northern China | Midwestern United States | Western Kenya | |
|---|---|---|---|
| (kg N/ha per year) | |||
| Nitrogen inputs to crops | 588 | 155 | 7 |
| Nitrogen outputs from harvest | 361 | 145 | 59 |
| Balance | +227 | +10 | −52 |
Progress has taken place on the “too much” side in rich countries. Townsend et al. (Reference Townsend, Vitousek and Houlton2012) noted that in the last few decades US crop yields have continued to rise while fertilizer rates have remained steady, indicating that the efficiency of nitrogen and phosphorus utilization has increased. Maize research in Nebraska that I saw in 2009 is aiming at doubling maize yields, while using one-quarter less nitrogen, one-quarter less water and one-quarter less fossil fuels. The small imbalance in the midwestern United States in the above table represents major progress compared with what it was a couple of decades ago (Vitousek et al. Reference Vitousek, Naylor, Crews, David, Drinkwater, Holland, Johnes, Katzenberger, Martinelli, Matson, Nziguheba, Ojima, Palm, Robertson, Sanchez, Townsend and Zhang2009). The negative balance in the “too little” countries is one of the main reasons for food insecurity in the tropics.
13.2 Nitrogen Pools and Fractions
A modified Century model (Fig. 13.4) shows SON pools similar to those of carbon shown in Chapter 11. The three SON pools, active, slow and passive, have similar turnover times as the soil organic carbon (SOC) pools. The big difference from the carbon model is the presence of additional nitrogen input pools: nitrogen fertilizers, atmospheric deposition and biological nitrogen fixation. Biomass and manure additions are included in the organic input pool. Other big differences are the mineral nitrogen pool and the loss fluxes (crop harvest removal, leaching, denitrification, runoff and erosion). But the key is two opposite sets of fluxes: mineralization versus immobilization and nitrification versus denitrification. These additional pools (atmospheric deposition, biological nitrogen fixation, nitrogen fertilizers, mineral nitrogen, plant nitrogen and nitrogen losses) are really fractions that can be measured, unlike the SON pools.
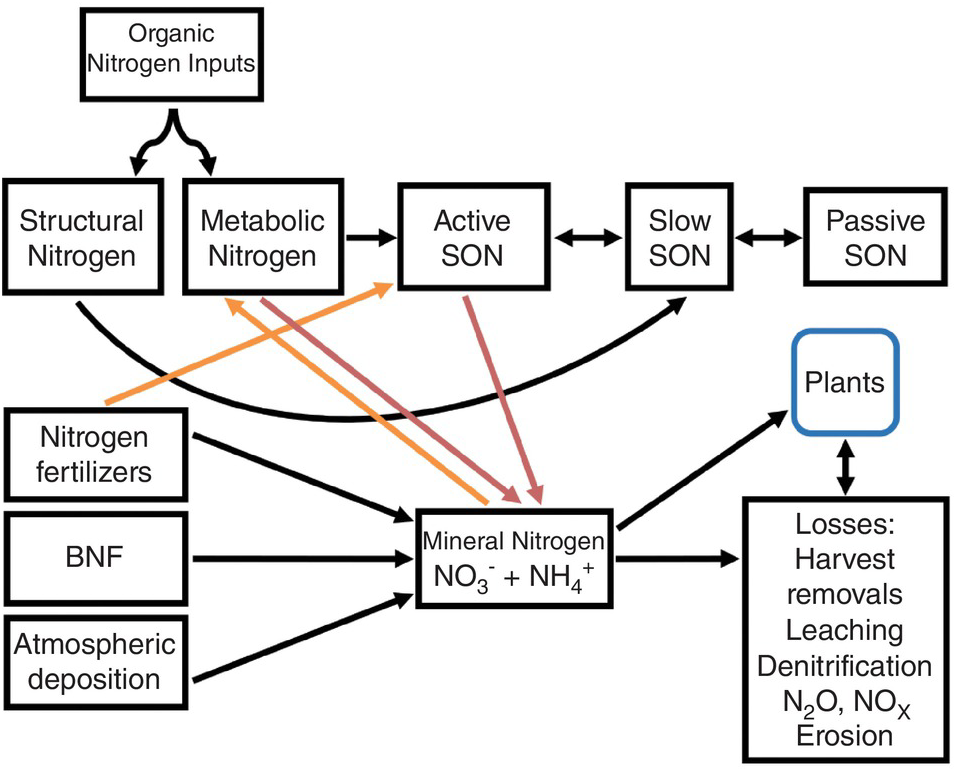
Fig. 13.4 Modified Century model for nitrogen. Red arrows are mineralization and orange arrows are immobilization. The active SON pool includes various fractions, most importantly microbial biomass, but also DON, labile SON and particulate SON.
As indicated in Chapter 11, the active SOC pool is the most important source of nitrogen mineralization and thus the pool contributing the most to soil fertility. Dissolved organic nitrogen, like dissolved organic carbon, is part of the active SON pool and interacts with microbial biomass, which is also part of the pool. It may also be an important way to transfer nitrogen to lower depths in the soil profile.
The annual additions of SON are larger in tropical forests and savannas than in temperate forests and prairies. The reasons are similar to those that account for the differences in SOC content, described in Chapter 11. The range in total nitrogen and in C:N ratios among tropical soils are similar to those found under temperate conditions.
The four main kinds of nitrogen inputs that feed the mineral pool (NH4+ and NO3–) are addressed below: atmospheric deposition, biological nitrogen fixation, mineral fertilizers and organic nitrogen mineralization.
13.3 Atmospheric Deposition
Deposition of Nr in the atmosphere comes from the emission of several gas sources (Table 13.1) and nitrogen oxides produced by lightning. These gases are transported by wind and deposited on land and water, mostly as rain in the tropics. Galloway et al. (Reference Galloway, Townsend, Erisman, Bekunda, Cai, Freney, Martinelli, Seitzinger and Sutton2008) noted that local deposition rates in natural systems were ~ 0.5 kg N/ha per year in the late twentieth century, but they are now more commonly 10 kg N/ha per year and may reach as high as 60 kg N/ha per year. This will accelerate the nitrogen cycle. The tropical hotspots are in Colombia; Venezuela; southern Brazil; Ethiopia; Uganda; Nigeria; the Indian subcontinent; Southeast Asia and China, mostly around urban and industrial areas; and where natural gas is flared in the process of oil extraction.
Lightning production of Nr occurs due to the high energy produced, which breaks the N2 bond into nitrogen oxides that react with water vapor to form nitric acid. Lightning activity is probably highest over tropical land where convective rainfall activity is highest (Galloway et al. Reference Galloway, Dentener, Capone, Boyer, Howarth, Seitzinger, Asner, Cleveland, Green, Holland, Karl, Michaels, Porter, Townsend and Vorosmarty2004), but it is consequential in temperate regions in areas like the eastern United States, where summer thunderstorms are frequent. Volcanic eruptions, dust storms and floods contribute additional nitrogen deposition episodically.
Dust storms from the Sahara contribute small amounts of nitrogen to the sub-Saharan countries because the dust is mainly composed of quartz and kaolinite particles, although dust arising from the Sahel and other vegetated areas does contain above-ground litter particles. Calculations from data by Ramsperger et al. (Reference Ramsperger, Herrmann and Stahr1998) suggest a range of 2–5 kg N/ha per year. Slash-and-burn agriculture is also an important source of gaseous Nr, and will be discussed in Chapter 16.
Atmospheric deposition in terrestrial systems was ~60 Tg Nr per year in the 1990s and is probably around 100 Tg Nr per year now. Assuming that 40 percent of the land is in various forms of agriculture (crops, livestock, forestry and aquaculture), the global contribution of atmospheric deposition to agriculture is ~ 40 Tg Nr per year.
13.4 Biological Nitrogen Fixation
Biological nitrogen fixation has been the largest way of converting N2 into Nr until the development of the Haber–Bosch process in the early 1900s. Nitrogen production via biological nitrogen fixation is still slightly ahead of nitrogen fertilizers in terrestrial systems, and way ahead of atmospheric deposition. Table 13.1 shows estimates for the early 1990s of 139 Tg nitrogen fixed per year via biological nitrogen fixation, of which 107 is fixed in natural systems and 32 in agricultural ones. In contrast, the Haber–Bosch process was estimated to fix about 90 Tg N per year in 2000 (Smil Reference Smil2004).
The N2 molecule is transformed into Nr by the nitrogenase enzyme in bacteria, in symbiotic associations with plants or as free-living bacteria. Nitrogen fixation is a very old process in evolutionary biology, and is largely limited to bacteria that carry the two main nitrogenase genes, nifD and nifK (Giller Reference Giller2001). Nitrogenase activity is dependent on an ample supply of phosphorus as adenosine triphosphate (ATP). Other nutrients that are critical for symbiotic nitrogen fixation include molybdenum, iron, cobalt and vanadium.
Atmospheric N2 is fixed as NH3, which quickly forms NH4+, and is taken up by the host plant. The NH4+ is incorporated into the glutamatic acid and glutamine amino acids, which are synthesized into other nitrogen compounds, and eventually proteins.
Biological nitrogen fixation is an energy-expensive process which takes place at ambient temperatures and pressure. Sixteen ATP molecules are required to break one N2 molecule, and an additional 12 ATP molecules are consumed in nodule development, maintenance, and NH4+ assimilation and transport, totaling 28 ATP molecules. Together they can consume about one-third of the plant’s photosynthate (Giller Reference Giller2001). Nodulated legumes use 810 mg CO2 per gram of dry biomass growth. This is 59 percent more than when taking up inorganic nitrogen from the soil solution (Silsbury Reference Silsbury1977). No wonder legumes prefer to take up NO3– or NH4+ when they are available in the soil rather than doing the hard work of nitrogen fixation.
Biological nitrogen fixation is carried out by bacteria. The most important nitrogen-fixing bacterial groups are the rhizobia, composed of several genera that form symbiosis with legume roots (Fig. 13.5). The second most important are the blue-green algae (cyanobacteria), usually free-living but also forming associations with the bacterium Anabaena azollae and the aquatic fern Azolla anabaena; other cyanobacteria form symbioses with fungi, forming lichens. Third comes the actinomycete Frankia, which forms symbiotic associations with a few gymnosperms and angiosperms in the tropics. The fourth group is the free-living nitrogen-fixers in the soil solution of the rhizosphere. The fifth group is the endophytic bacteria, loosely associated inside C4 grasses such as some cereals and sugar cane, as well as C3 plants like rice. Table 13.3 lists the main rhizobial genera, species and biovars (the equivalent to cultivars) and their host plants. Table 13.4 provides a similar list for the other four groups of nitrogen-fixers.

Table 13.3 Rhizobia and their host plants in the tropics. A partial list, adapted from Giller (Reference Giller2001).
Table 13.4 Other nitrogen-fixing bacteria and host plants important in the tropics. Adapted from Giller (Reference Giller2001) and Muñiz et al. (Reference Muñiz, Rives, Castro, Sanzo, Socorro, Alves y and Urquiaga2008).
13.4.1 Rhizobia–Legume Symbiosis
Rhizobial symbiosis with legumes takes place with bacteria that induce nodulation and infect the roots of thousands of species of the subfamilies Papilionoideae and Mimosoideae of the Leguminosae family. A third Leguminosae subfamily, the Cesalpinioideae, has only a few species that fix nitrogen. All legumes have high nitrogen content in the leaves, whether they fix nitrogen or not. Emphasis on nitrogen fixation is now all over the tropics, with many active research programs and review books such as Ladha et al. (Reference Ladha, George and Bohlool1992a), Mulungoy et al. (Reference Mulongoy, Gueye and Spencer1992) and Giller (Reference Giller2001).
Rhizobial strains are classified as promiscuous or specific. Promiscuous strains are rhizobia that enter symbiosis with many legume species, while the specific ones only do it with one or a few (Sanginga et al. Reference Sanginga, Abiadoo, Dashiell, Carsky and Okogun1996,Reference Sanginga, Dashiell, Okogun and Thottappily1997, Mpepereki et al. Reference Mpepereki, Javaheri, Davis and Giller2000). Table 13.3 lists the main rhizobial species important in the tropics and their legume hosts, showing some promiscuous species. Many of them were first reported as recently as the 1990s and many of them come from China. Bradyrhizobium is a genus created to accommodate slow-growing strains in association with soybeans as well as cowpea (Giller Reference Giller2001).
13.4.2 Cyanobacterial Symbiosis
Blue-green algae, or cyanobacteria, are bacteria that have the chlorophyll-a pigment. Producing oxygen (O2) from photosynthesis damages nitrogenase activity, but cyanobacteria are able to separate photosynthesis from nitrogenase activity in their cells. The nitrogen-fixing symbiosis occurs in cavities in the upper leaf surface of the floating Azolla anabaena fern by the cyanobacteria Anabaena azollae and Nostoc species. (Table 13.4). The Azolla species supplies the carbon and the bacteria the nitrogen. Cyanobacteria associate with fungi forming lichens on rocks, starting the rock weathering process often. Many other cyanobacteria are free-living.
13.4.3 Frankia Symbiosis
Actinomycetes are filamentous bacteria with hyphae similar to those of fungi. The genus Frankia (Fig. 13.6) is the only one capable of forming symbiotic nitrogen-fixing nodules with gymnosperms, of which Casuarina, a tropical pine, is the most important one in the tropics (Giller Reference Giller2001), followed by alder (Alnus spp.) in the tropical highlands.

13.4.4 Free-Living Bacteria
Free-living bacteria in the soil solution around the plant rhizosphere include Azotobacter and Beijerinckia, which have the ability to fix nitrogen aerobically, while Derxia and Clostridium do it anaerobically (Table 13.4). Since they do not undergo symbiosis with a plant, their energy requirements must come from a rhizosphere that is rich in soluble carbon.
13.4.5 Endophytic Bacteria
These are bacteria that are capable of nitrogen fixation, found within tissues internal to the epidermis of non-legume plants (Giller Reference Giller2001). They have received much attention in the tropics since the seminal work of Döbereiner and colleagues in Brazil, in grasses and sugar cane (Döbereiner Reference Döbereiner1961, Reference Döbereiner1968, Döbereiner et al. Reference Döbereiner, Day and Dart1972, Urquiaga et al. Reference 369Urquiaga, Cruz and Boddey1992, Boddey Reference 366Boddey1995, Boddey and Döbereiner Reference Boddey and Döbereiner1995, Urquiaga Reference Urquiaga, Moniz, Furlani, Schaffert, Fageria, Rosolem and Cantanarella1997, Urquiaga et al. Reference Urquiaga, Alves, Soares and Boddey2008). Endophytic bacteria can fix nitrogen only in micro-anaerobic niches because they have no way to protect their nitrogenase enzyme from O2 damage. Acetobacter diazotrophicus and Herbaspirilum spp. have been found in the roots and aerial tissues of sugar cane (Boddey et al. Reference Boddey and Döbereiner1995) and important pasture grass species of the genera Brachiaria and Paspalum (Döbereiner et al. Reference Döbereiner, Day and Dart1972, Boddey and Victoria Reference Boddey and Victoria1986). These authors indicated that sugar cane was bred under low levels of nitrogen fertilization in Brazil where endophytic nitrogen fixation is believed to account for about 50 percent of the nitrogen uptake of the first harvest of sugar cane.
Flooded rice also harbors many endophytic bacteria of the genera Azospirillum, Acetobacter, Azotobacter, Beijerinckia, Burkholderia, Herbaspirilum and Serratia (Döbereiner et al. Reference Döbereiner, Baldani, Reis, Fendrik, del Gallo, Vanderleyden and de Zamarocy1995, Boddey et al. Reference Boddey and Döbereiner1995, Verma et al. Reference Verma, Ladha and Tripathi2001, Tan et al. Reference Tan, Hurek, Prasad, Ladha and Reinhold-Hurek2001, Gyaneshwar et al. Reference Gyaneshwar, James, Natarajan, Reddy, Reinhold-Hurek and Ladha2001, Muñiz et al. Reference Muñiz, Rives, Castro, Sanzo, Socorro, Alves y and Urquiaga2008). In low soil organic matter (SOM) Aqualfs of Cuba, Muñiz et al. (Reference Muñiz, Rives, Castro, Sanzo, Socorro, Alves y and Urquiaga2008) showed that biological nitrogen fixation contributes 28–32 percent of the nitrogen requirements of flooded rice genotypes yielding around 4 t/ha, and that the process is related to the high population of endophytic microorganisms in soils with low SOM content (< 0.5 percent SOC). Low SOC means low nitrogen mineralization, and we know that high inorganic nitrogen contents decrease biological nitrogen fixation.
13.4.6 Inoculation
Inoculation with appropriate rhizobia began over 100 years ago, mainly focused on soybeans and tropical pasture legumes. In both cases, most cultivars require highly specific rhizobial strains since soybeans were introduced from China, and most inoculation efforts are in the United States, Brazil and Argentina. Likewise, most tropical pasture legumes originate from Latin America and require inoculation when transported to Australia (Andrew and Kamprath Reference Andrew and Kamprath1978, Wilson Reference Wilson1978, Giller Reference Giller2001).
Giller (Reference Giller2001) indicated three situations where inoculation is needed: (1) where indigenous rhizobia are less effective than selected strains for a particular legume species; (2) where rhizobia that are compatible with the legume are not present; and (3) where the population of compatible rhizobia is too small to give sufficiently rapid nodulation – less than 20–50 cells per gram of soil.
This is an area of much research and application in the tropics, as commercial inocula are routinely produced in Latin America for large-scale commercial soybean production, and also in many tropical countries for smallholder farmers in Africa. The basic method is to add pure cultures of the desired rhizobial strain to peat, which serves as the carrier and also prevents desiccation of the bacteria. Small quantities of phosphate rock, lime and molybdenum are often added. This mixture is kept in plastic bags under refrigeration. Inoculants are mixed with the legume seed prior to planting, as shown in Fig. 13.7, where a group of African scientists are watching a demonstration.
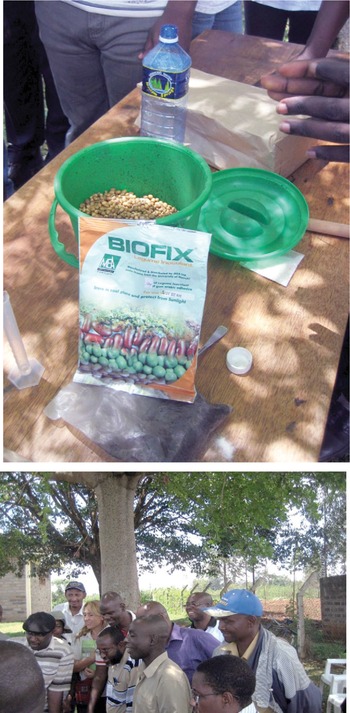
Fig. 13.7 Ready-to-mix commercial inoculum with soybean seeds (top), and scientists learning (bottom). Muhoho, western Kenya.
Rhizobia can survive in a free-living state for over 30 years, even in the absence of legumes (Giller Reference Giller2001), so the question of whether successive inoculations are necessary for subsequent grain legume crops of the same species depends on the visual evidence of healthy nodules in the current crop.
Inoculation with other nitrogen-fixing bacteria is different. Anabaena azollae is an obligate, meaning it is never separated from the host Azolla species, hence no inoculation is necessary (Ladha and Watanabe Reference Ladha and Watanabe1982). A similar mechanism may take place in the Frankia–gymnosperm symbiosis. Endophytic bacteria in cereals and grasses have no true symbiosis with the host plant (JK Ladha, personal communication, 2012).
Inoculating with free-living nitrogen-fixing bacteria is a different story and depends largely on the supply of energy as dissolved carbon in the rhizosphere of the crop, and also energy produced from rhizosphere exudation. Some positive plant growth responses take place, but these are largely attributed to bacteria that produce growth-stimulating substances such as indole acetic acid and other hormones, but not much to nitrogen fixation, which contributes perhaps 5 kg N/ha per year (Giller Reference Giller2001). The amounts of nitrogen fixed are larger in flooded anaerobic soils grown to rice, which have copious amounts of straw as a carbon source, with the flooded soil acting as a carbon sink (Roger and Ladha Reference Roger and Ladha1992).
Scientists have dreamed for decades about cereals that could fix N2 from the atmosphere, just like legumes. Giller (Reference Giller2001) points to two research avenues: (1) to introduce the nitrogenase enzyme, so the cereal can fix nitrogen directly; and (2) to manipulate the cereal genome so it can nodulate with rhizobia. For rice, the International Rice Research Institute initiated a Global Frontier project on nitrogen fixation, with an aim to assess the potential of rice to fix its own nitrogen, similarly to legumes. Through this project, scientists have shown that rice possesses a genetic mechanism for nodulation, as in legumes, and hence the potential exists (Ladha and Reddy Reference Ladha and Reddy2003). It was, however, recognized that the project is a long-term one. Unfortunately, it was stopped about 7 years after its initiation due to lack of continuing funding, but there seems to be renewed interest now. There’s no significant progress yet, but let’s keep researching.
13.4.7 Amounts Fixed
Rhizobia
The quantities of nitrogen fixed by different crops in symbiotic relationships with rhizobia are shown in Table 13.5. It can be seen that the bigger the plant species are, and the longer they live, the larger are the amounts of nitrogen fixed. Grain legumes fix the smallest amounts, and trees the largest. Grain legumes, the earliest maturing group, fix on average around 60–100 kg N/ha per crop. Among the grain legumes, the longer-lived soybean, peanut and pigeon pea (all of which undergo symbiosis with Bradyrhizobium strains) fix higher amounts of nitrogen than the earlier maturing common bean. A rule of thumb is that, under optimum conditions, grain legumes fix 1–2 kg N/ha per day (Giller Reference Giller2001).
Table 13.5 Nitrogen-fixation estimates (above-ground) by tropical grain legumes and green manures. Selected from tables by Giller (Reference Giller2001) and J. K. Ladha (personal communication, 2012).
Most pasture legumes (grown without grazing) and green manures at 6 months of age fix nitrogen in the same range as grain legumes (around 60–120 kg N/ha), ranging from 1 kg N/ha to 458 kg N/ha, with the stem-nodulating Sesbania rostrata fixing the highest amounts in 2 months (Ladha et al. Reference Ladha, Pareek and Becker1992b). Lastly, trees and shrubs growing for 6 months to over 2 years fix much larger quantities of nitrogen, some reaching over 1000 kg N/ha in 2 years. In all cases there is large variability among and within species, making it difficult to predict the amounts of nitrogen fixed. This is because that depends on many other factors, particularly management and phosphorus status.
What is somewhat less variable is the proportion of a plant’s nitrogen uptake coming from nitrogen fixation in legumes, which ranges from 30 percent to 90 percent. This means that nitrogen-fixing legumes take 10–70 percent of their nitrogen from nitrate and ammonium ions in the soil solution. Given the high energy requirements of nitrogen fixation, legumes prefer to take the easy way out if inorganic sources are readily available (Silsbury Reference Silsbury1977). When the soil has high levels of inorganic nitrogen ions, the nitrogen-fixing mechanism can shut down. This is why grain legumes should only receive minimal nitrogen fertilization (say 5–10 kg N/ha) as a starter fertilizer. In the ustic tropics, the Birch effect may act like a starter fertilizer.
There are three principal factors affecting the quantities of nitrogen that are fixed in a cropping system as opposed to the single crop estimates in Table 13.5. Giller (Reference Giller2001) listed them as follows:
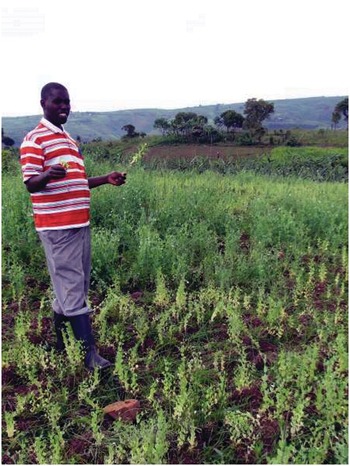
Probably the most important one is the amount of land with legumes or other nitrogen-fixing plants, as obvious as it sounds. This is notoriously evident in Malawi, where farmers often claim they have a maize–pigeon pea intercropped system, while in fact it is only true in some corners of their fields.
The ability of the nitrogen-fixing plants to establish symbiosis, which is often restricted by environmental or management factors (see Fig. 13.8).
The ability of the established symbioses to fix nitrogen, which is determined by the genetic potential of the bacteria, the plant and the symbiosis itself.

Fig. 13.8 Peas (Pisum sativum) in the highlands of Ruhiira, Uganda, showing very uneven growth. In the front, stunted, chlorotic, poorly nodulated plants, in contrast with good growth and nodulation in back because weeds and crop residues are customarily removed from the center and piled along the field boundaries. Extension agent Richard Gumisiriza.
Frankia-Casuarina symbiosis
This symbiosis is limited to eight families of angiosperms, mostly shrubs and trees (Giller Reference Giller2001). Bohlool et al. (Reference Bohlool, Ladha, Garrity and George1992) report that a Frankia–Casuarina association fixes 40–60 kg N/ha per year. This is not much in comparison with rhizobial associations with trees.
Free-Living Bacteria in the Rhizosphere
There was intense interest when Johanna Döbereiner’s group in Brazil announced that large quantities of nitrogen were fixed by free-living bacteria in the rhizosphere of grass plants (Döbereiner Reference Döbereiner1961). This was unfortunately an early extrapolation from small containers of soils in the laboratory, which had been spiked with lots of sugar. Nevertheless, this work did start a new avenue of tropical soils research, which has matured in the last 50 years. Ken Giller (Reference Giller2001) reminds us of a few basic facts. Soil microorganisms live mostly in near-starvation conditions, being largely nitrogen-limited. They are more abundant in the rhizosphere of plants because there is more carbon and nutrients there, due to root exudation, and this is where most of the organic and inorganic fertilizer inputs end up. Giller further states that up to 30 percent of the carbon fixed by photosynthesis in cereals and as much as 50 percent in grasslands is translocated to the root system, which eventually decomposes into CO2 and dissolved organic carbon. Different bacteria have evolved to occupy microenvironments in the rhizospheres of different plants.
Regardless of whether biological nitrogen fixation is symbiotic or not, how important is it? Giller (Reference Giller2001) estimates that 1 kg N is fixed by free-living bacteria per 1000 kg of carbon translocated below ground. So, let us consider a 5 t/ha maize crop that produces, say, 10 t/ha of total biomass, 50 percent of which is carbon, of which 30 percent (1500 kg C/ha) goes to the roots. Then we are dealing with a minuscule amount, 1.5 kg N/ha. Considering a 100 t/ha crop of sugar cane, with 50 percent of the photosynthate going into the roots, the same calculation results in a carbon input of 25 t C/ha, which would only produce 25 kg N/ha from free-living nitrogen-fixers. It is a help, but hardly meets the needs of sugar cane. Some other process must be taking place.
Crop yield responses to inoculation with Azospirillum species and related free-living bacteria have produced inconsistent results. Giller painfully analyzed the literature and the methodologies used and concluded that the “amounts of N fixed by free-living soil bacteria will rarely exceed 5 kg N/ha per year in aerobic soils, although the amounts may be larger in anaerobic conditions.” In a typical Ken Giller statement he praised the attention to detail in many publications by promoters of free-living nitrogen fixation, which enabled him to debunk their claims (see Giller Reference Giller2001, pp. 116–121).
Flooded rice fields benefit from 10–80 kg N/ha per rice crop from free-living cyanobacteria, plus an additional 10–30 kg N/ha per rice crop from other free-living bacteria (Bohlool et al. Reference Bohlool, Ladha, Garrity and George1992), and these are hard data.
Azolla
Similar disappointing results have occurred with Anabaena bacteria in association with the fern Azolla but for different reasons. A crop of Azolla fixes large amounts, 20–150 kg N/ha in about 3 months (Roger and Ladha Reference Roger and Ladha1992), but requires a very high phosphorus content in the water, plus large quantities of water in irrigation ditches or empty paddies for keeping the fern alive when the rice crop is not flooded. The Azolla species can be grown as a green manure and incorporated into the soil, which is not an easy task while rice is growing, and works well as a green manure. Giller concludes that despite the enthusiasm by scientists during the 1970s, the use of Azolla has declined drastically, being limited currently to its traditional niche, the cool (isothermic) highland rice areas in northern Vietnam.
Endophytic Nitrogen Fixation
Giller (Reference Giller2001) is rather silent on this issue, focusing on the major methodological constraints. Boddey et al. (Reference Boddey, Jantalia, Zotarelli, Okito, Alves, Urquiaga, Dakora, Chimphango, Elmerich, Newton and Valentine2008) describe that in order to use 15N-isotope dilution techniques in the field, it is necessary to harvest and analyze several neighboring non-fixing reference plants, so the nitrogen fixed is estimated by the difference between two different plant species, one being the “control.” This is questionable. To assume that such differences are caused by endophytic biological nitrogen fixation is certainly a big leap, which may ignore other factors such as inorganic nitrogen availability and differences in plant uptake patterns by different species. This contrasts with the rhizobia–legume nitrogen-fixation techniques where, if a difference is needed, the control is a non-nitrogen-fixing cultivar of the same legume species.
However, growing sugar cane in Oxisols and Ultisols of Brazil suggests that something is going on. Urquiaga et al. (Reference 369Urquiaga, Cruz and Boddey1992) indicate that sugar cane typically accumulates between 100 and 200 kg N/ha at harvest. Boddey and Victoria (Reference Boddey and Victoria1986) indicate that this is probably done by Acetobacter diazotrophicus, which occurs in large numbers in the stems and roots of sugar cane.
13.4.8 Transfer of Fixed Nitrogen to Other Plants
It is commonly assumed that nitrogen fixed via biological nitrogen fixation can be used by the next crop or by a cereal intercropped with the legume, thus “increasing soil fertility.” Such generalizations fall apart with actual data, but there are still major contributions. Let’s summarize what we know.
The processes by which nitrogen from nitrogen-fixing plants can be made available to others were reviewed by Giller (Reference Giller2001). He found just three that have major importance:
Root and nodule senescence, decomposition and mineralization;
Mineralization of cut or senesced above-ground plant parts; and
Consumption by grazing animals or insects and return in excreta.
Since then, a synergy between roots and mycorrhizal hyphae has shown promise in increased nitrogen fixation at the greenhouse scale (Chalk et al. Reference Chalk, Souza, Urquiaga, Alves and Boddey2006), but not at the field scale. Grain legumes are greedy, and put most of the nitrogen they take up in the seed (see Table 13.6), leaving little in the stover and roots. Whatever effects grain legumes have on soil properties and subsequent crops depend solely on the crop residues (stover) and how they are managed. Of particular interest are the promiscuous soybean varieties (Sanginga et al. Reference Sanginga, Abiadoo, Dashiell, Carsky and Okogun1996, Reference Sanginga, Dashiell, Okogun and Thottappily1997, Mpepereki et al. Reference Mpepereki, Javaheri, Davis and Giller2000) because they also produce large quantities of stover, in addition to high grain yields. Table 13.6 also shows that cowpeas, pigeon peas and peanuts can produce large quantities of stover, but apart from the promiscuous soybeans, most soybean cultivars leave very little stover after harvest, just the stems. Harvesting of peanuts by hand often involves compete removal of the plant, and the stover usually goes to feed livestock, so in this case they contribute nothing. Common beans produce 0.1–7.5 t/ha of stover, so the high-end cases represent a significant contribution.
Table 13.6 Contribution to soil fertility by tropical grain legumes, grown as sole crops with all stover returned to the soil. Adapted from Giller (Reference Giller2001).
| Parameter | Soybean | Cowpea | Mung bean | Common bean | Peanut | Pigeon pea |
|---|---|---|---|---|---|---|
| Growth duration (days) | 96–104 | 69–115 | 70–84 | 72–114 | 90–140 | 90–241 |
| Grain yield (t/ha) | 0.8–3.0 | 0.2–2.7 | 0.7–1.7 | 0.1–4.0 | 0.3–3.1 | 0.2–1.4 |
| Stover yield (t/ha) | 1.0–10.4 | 0–8.4 | 1.3–3.9 | 0.1–7.5 | 1.4–6.7 | 1.8–13.8 |
| Nitrogen taken up from nitrogen fixation (%) | 12–100 | 32–76 | 0–100 | 0–73 | 16–92 | 0–88 |
| Nitrogen fixed (kg N/ha) | 26–188 | 9–201 | 61–107 | 2–125 | 21–206 | 0–166 |
| Nitrogen in stover (kg N/ha) | 30–170 | 20–94 | 30–88 | 3–38 | 52–166 | 12–50 |
| Net input from nitrogen fixation (kg N/ha) | –37 to 59 | –11 to 136 | –20 to 10 | - | –37 to 100 | -32–41 |
| Recovery of stover nitrogen (%) | 14–23 | 12–24 | 4–58 | - | 12–26 | 9–15 |
| Residual effect in fertilizer equivalents (kg N/ha) | 0–22 | 38–205 | 68–94 | - | 0–97 | 0–67 |
Assuming all the stover is returned to the soil and all grain is removed, the nitrogen contribution of grain legumes to the soil (net input from nitrogen fixation) ranges from –11 to –37 kg N/ha per crop to a positive 10 to 136 kg N/ha per crop. Negative values occur when grain legumes remove more nitrogen from the soil to the grain than they fix, a fact that is not commonly realized. The positive values indicate the actual contribution to subsequent nitrogen fertility, the highest being soybean, cowpea, peanut and pigeon pea.
The recovery of stover nitrogen by the subsequent crop is generally quite low, 4–26 percent, in comparison with fertilizer nitrogen recovery (30–70 percent, see Section 13.9.3), with only one impressive value of 58 percent with mung beans. Translating this contribution into nitrogen fertilizer equivalents, grain legumes can provide from 0 to 205 kg N/ha, a very wide range. So the choice of grain legume cultivar, the rhizobial strain and management can make a huge difference, from negligible to contributions above 100 kg N/ha, which is what a good subsequent crop of maize normally needs.
When grain legumes are intercropped with a cereal there is no immediate benefit to the companion crop because there is little decomposition of the stover or roots in growing plants. The real effect (if any) is on the subsequent crop, after the grain legume has been harvested, and provided that the stover is added to the soil. The residual effects are the increases in inorganic nitrogen after the legume stover mineralizes. Figure 13.9 shows that maize yields almost doubled when it was preceded by a Bambara nut crop (Vigna subterranea, a grain legume), and also almost doubled when preceded by peanut, with the stover incorporated in the soil in both cases, in comparison with maize being preceded by a maize crop, all with no fertilizer nitrogen applied. This is the real residual effect in this subhumid environment with one crop per year. When fertilizer nitrogen was applied, the effect of the legume grain crops disappeared. In this case, it does not make sense to apply nitrogen fertilizer at all, letting the grain legume residual effect produce 6–8 t/ha of maize in Zimbabwe.
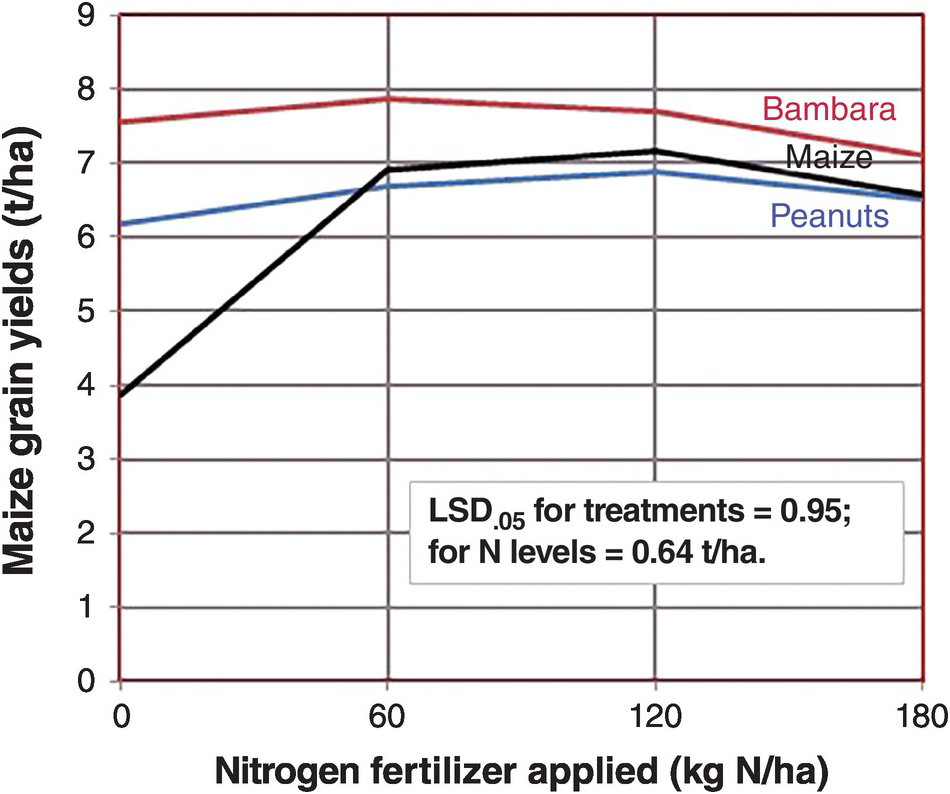
Fig. 13.9 Maize yields without nitrogen fertilizer applications increased drastically when two grain legumes preceded the current crop in Marondera, Zimbabwe, but the effect of the legumes pretty much disappeared when nitrogen fertilizers were added.
Okito et al. (Reference Okito, Alves, Alves, Urquiaga and Boddey2004), in a longer-term field trial in Brazil, quantified the contribution of peanuts and mucuna using the 15N natural abundance technique, finding that peanut contributed 41 kg N/ha to the subsequent maize crop and mucuna, a green manure, 60 kg N/ha. But Okito and colleagues found that the peanut–maize rotation eventually depletes soil nitrogen reserves (just as Giller warned about some grain legumes), while the mucuna–maize sequence builds up soil nitrogen.
13.4.9 Overall Contribution of Biological Nitrogen Fixation to Food Production
The magnitude of nitrogen fixation in agricultural systems worldwide will be about 50 Tg N per year (Table 13.1). It is a small fraction in relation to the total agricultural land of the world, 4937 million hectares (Table 2.10), representing an average of 6.5 kg N/ha per year (including all land with and without nitrogen-fixers). It was not possible for me to calculate the percentage of agricultural land in the world where nitrogen fixation takes place, and thus a quantitative estimate of the contribution of biological nitrogen fixation to world or tropical food production.
The potential contribution of biological nitrogen fixation is usually based on experimental plot data, which provide a rosy picture. Giller (Reference Giller2001) indicates that legumes can fix 60 kg N/ha under experimental conditions, but I feel the reality in much of the tropics is a fraction of that because of management limitations of germplasm, rhizobial strains, phosphorus fertilization, rainfall variability and particularly low plant populations. As Norman Borlaug famously said “you can’t eat potential.” There are major exceptions, such as high-yielding soybean cultivation and tropical plantations that have an effective, well-managed, legume understorey, such as rubber and oil palm, which will be described in Chapter 19.
Nevertheless, it is well accepted that free-living bacteria add nitrogen to the SON pool, which certainly helps long-term sustainability (Bohlool et al. Reference Bohlool, Ladha, Garrity and George1992, Giller Reference Giller2001).
One country has provided sound data. Brazil stands alone as not only the tropical but probably the world leader in using biological nitrogen fixation. Based on sound science, Brazil uses very little nitrogen fertilizer (10 kg N/ha) in relation to its overall planted area. It devotes 13 million hectares to soybean production, with a national average yield of 2.4 t/ha (Alves et al. Reference Alves, Boddey and Urquiaga2003). It uses essentially no nitrogen fertilizer on soybeans. Urquiaga et al. (Reference Urquiaga, Alves, Soares and Boddey2008) estimated that 3.8 Tg N was fixed by improved strains of Bradyrhizobium and related species, worth about US $4 billion in nitrogen fertilizer equivalent every year (Fig. 13.10). The little nitrogen fertilizer used in sugar cane, with world-class yields, is presumably also due to nitrogen fixation, although whether it’s due to endophytic nitrogen fixation or another mechanism that remains to be determined.
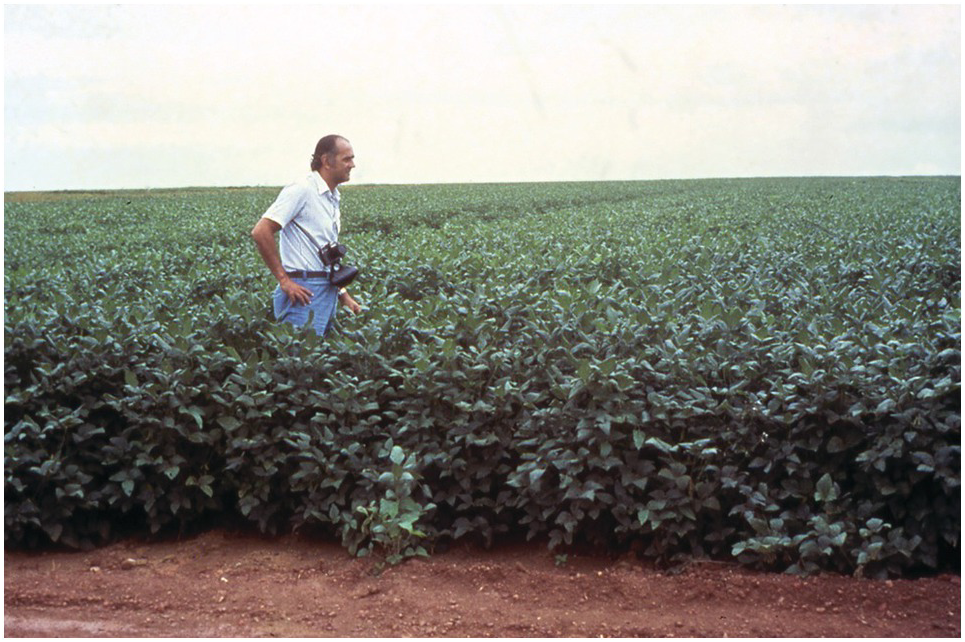
Fig. 13.10 Alfredo Lopes, one of the leaders in the development of the Cerrado, in the first soybean crop planted in Fazenda Nova Vida, near Brasília in 1975. These Oxisols received lime, phosphorus and the rhizobial inoculum. Such practices are worth about US $4 billion per year in nitrogen fertilizer equivalents.
13.5 Mineral Fertilizers
The third and the largest source of reactive nitrogen inputs to agriculture are the inorganic, synthetic or mineral fertilizers. The term “chemical” is misleading because all fertilizers, including organic ones, are chemical. That word makes some people’s noses turn up, as well as the word “synthetic,” i.e. manufactured, which modern fertilizers certainly are. I will refer to them as mineral fertilizers. Mineral fertilizers have been used since the dawn of agriculture, when farmers discovered, centuries ago, the value of kitchen ashes, followed by Chilean nitrate in the nineteenth century – but all were used on a small scale.
13.5.1 The Haber–Bosch Ammonia Synthesis
It was not until the development of the Haber–Bosch industrial process of ammonia synthesis in the early 1900s that mineral nitrogen fertilizers became to be used at scale. This is the number one way of transferring N2 into Nr in agriculture, with an estimated 100 Tg N per year in 1990. This compares with 32 Tg per year from agricultural biological nitrogen fixation (Table 13.1). Tilman et al. (Reference Tilman, Cassman, Matson, Naylor and Polasky2002) found a linear relationship between global fertilizer use and global cereal grain production from 1940 to 2000. They did not find such close relationships between phosphorus fertilizer or irrigation and global cereal grain production.
The Haber–Bosch process has been labeled “the world’s greatest fix (Leigh Reference Leigh2004).” Smil (Reference Smil2004) calls it the most important technical invention of the twentieth century. Is this hyperbole or an exaggeration? No. While electricity, cars, airplanes, medical sciences, the space program, the rule of law and the internet have done much to improve the quality of life, it is clear that the world could not support today’s population without mineral nitrogen fertilizers. Vaclav Smil (Reference Smil2004) estimated that about 40 percent of the world’s dietary protein supply in the mid 1990s came from the Haber–Bosch process, considering both the high dietary protein consumption of richer countries (100 g/person per day) and low consumption in the poorer counties of Africa, Asia and Latin America (66 g/person per day). Smil calculated that nitrogen-fertilizer-free practices, along with fisheries and grazing, would feed about 3.2 billion people today or 42 percent of the 7.5 billion population in 2017. Such fertilizer-free practices would feed only one-third of the world population of 9.5 billion people by the year 2050.
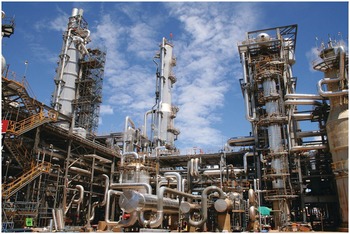
Fig. 13.11 A modern Haber–Bosch plant.
A Haber–Bosch plant is shown in Fig. 13.1. Unlike biological nitrogen fixation, which operates at normal pressure and temperatures, the Haber–Bosch process breaks the N2 molecule by brute force, using high temperatures (up to 400 °C) and high pressures (up to 35 000 kPa or 350 atmospheres), and no O2, which is poison to nitrogen fixation (Leigh Reference Leigh2004) just as it is to biological nitrogen fixation’s nitrogenase enzyme. The endless supply of N2 in the air is made to react with the explosive hydrogen (H2) gas. Natural gas (mainly methane [CH4]) and steam (water [H2O] gas) combine to produce H2 at high temperatures and pressures. Methane is the most economical feedstock because it has the highest H:C ratio of all hydrocarbons. The reaction is helped by iron (magnetite) and other catalysts (Smil Reference Smil2004).
The main reactions are:
CO is then removed by the “water gas shift reaction:”
Then N2 from the air is converted into ammonia:
Modern plants produce from 300 to 1000 tons of NH3 per day. Ammonia gas (12–18 percent NH3) is cooled and kept as a liquid at –33 °C, just below the boiling point of NH3 (Smil Reference Smil2004). Finally, NH3 is converted into actual fertilizers by reactions shown in Table 13.7.
Table 13.7 Principal nitrogen fertilizers, synthesis, market share and nutrient content, all derived from the Haber–Bosch NH3 synthesis. Adapted from Smil (Reference Smil2004), Brady and Weil (Reference Brady and Weil2008) and others.
About 80 percent of the product of Haber–Bosch process is used to make fertilizer and the remaining 20 percent to make explosives, plastics, nylon, plexiglass, polyurethane, feed supplements, glues and other synthetic products, accounting for 23 Tg N in 2005 (Galloway et al. Reference Galloway, Townsend, Erisman, Bekunda, Cai, Freney, Martinelli, Seitzinger and Sutton2008). Fertilizer use has driven a global change in the nitrogen cycle. China and India account for 80 percent of the total increase in nitrogen fertilizer use since 2000.
Today, synthetic nitrogen fertilizers supply approximately 45 percent of the total nitrogen input for global food production (Ladha et al. Reference Ladha, Reddy, Padre and van Kessel2011). The rest is supplied mostly by soil nitrogen mineralization, but also by biological nitrogen fixation and atmospheric deposition.
Fritz Haber and Carl Bosch were awarded the Nobel Prize in chemistry, Haber in 1918, and Bosch in 1931. More detailed descriptions of the process and the fascinating history behind it are found in books by Leigh (Reference Leigh2004) and Smil (Reference Smil2004).
13.5.2 Nitrogen Fertilizers
Out of the Haber–Bosch process, several fertilizers were produced (Table 13.7), starting with ammonium sulfate, by Imperial Chemical Industries in 1923. The last fertilizer released for large-scale application was sulfur-coated urea, by the US National Fertilizer Development Center in Muscle Shoals, Alabama, in the 1960s. It is disheartening to realize that no new nitrogen fertilizer for agricultural use has been developed and marketed in the last 50 years, and probably longer since sulfur-coated urea is not used at large scale because of its cost. Many “boutique” nitrogen fertilizers are on the market, some with unsubstantiated claims, but these are mainly devoted to golf courses, backyard gardens and nurseries. A significant modification is the compression of urea into super-granules or briquettes, which seems effective in flooded rice culture. The development of the fertilizer industry is still very much mid-twentieth century, and is yet to take advantage of breakthroughs such as nanotechnology. Hopefully, I will stand corrected in the near future. Currently, there is more emphasis on blends that incorporate sulfur, zinc and iron with the major elements nitrogen, phosphorus and potassium.
The amounts of fertilizers applied per hectare of agricultural land varies widely between countries. Some countries apply too much (Netherlands, Vietnam, Japan, UK, China, France), some reasonable amounts (Brazil, United States, India, South Africa, Cuba) and others apply too little, mostly African countries (Fig. 13.12).
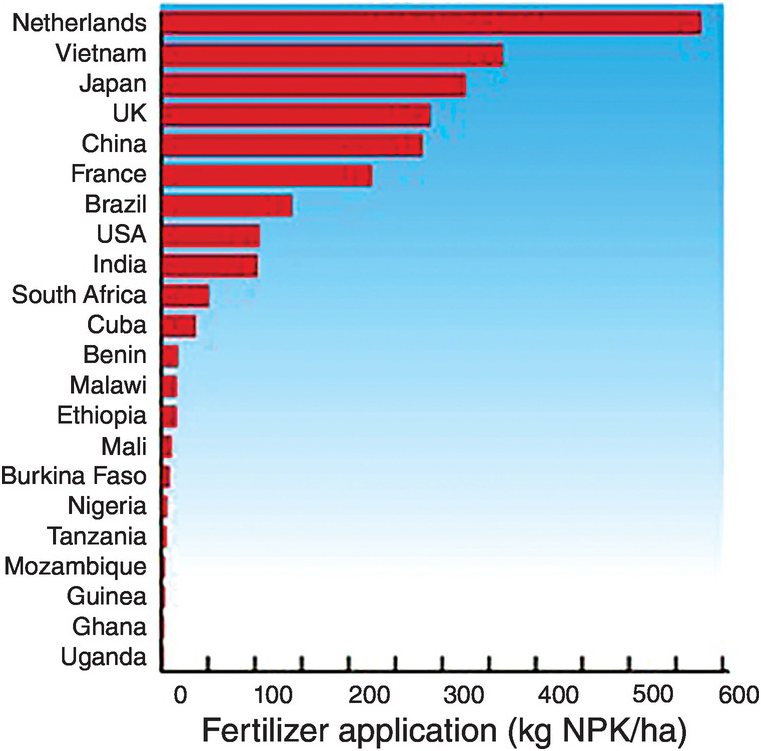
Fig. 13.12 National fertilizer applications are very uneven.
The Africa Fertilizer Summit, held in Abuja, Nigeria, in 2006, committed African countries to increase their annual fertilizer use from 8 kg NPK/ha to 50 kg NPK/ha by 2015. Malawi and Zambia have almost attained that target, Malawi reaching 48 kg/ha NPK and Zambia 43 kg/ha NPK (Peter Crauford, personal communication, 2017).
Nitrogen fertilizer management practices depend on many factors. Some are specific to the fertilizer. Others depend on germplasm and soil and climate conditions, as well as on the agronomic management. Wetland rice is a special case and will be discussed in Chapter 17. Let’s start with the real game changer, germplasm.
13.5.3 Green Revolution Germplasm
The main impact of the Green Revolution of the 1960s–1980s was to drastically change the plant type: new varieties of rice and wheat put more nitrogen into the grain when nitrogen fertilizers were applied, thus making grain to straw ratios of above 1 instead of ~0.5 (Chapter 2). Most traditional varieties responded to nitrogen fertilization by producing more leaf, lodging (falling over on the ground) and losing yield, while the new ones increased grain yields drastically by remaining short-statured and erect. Figure 13.13 shows the results of a typical trial.
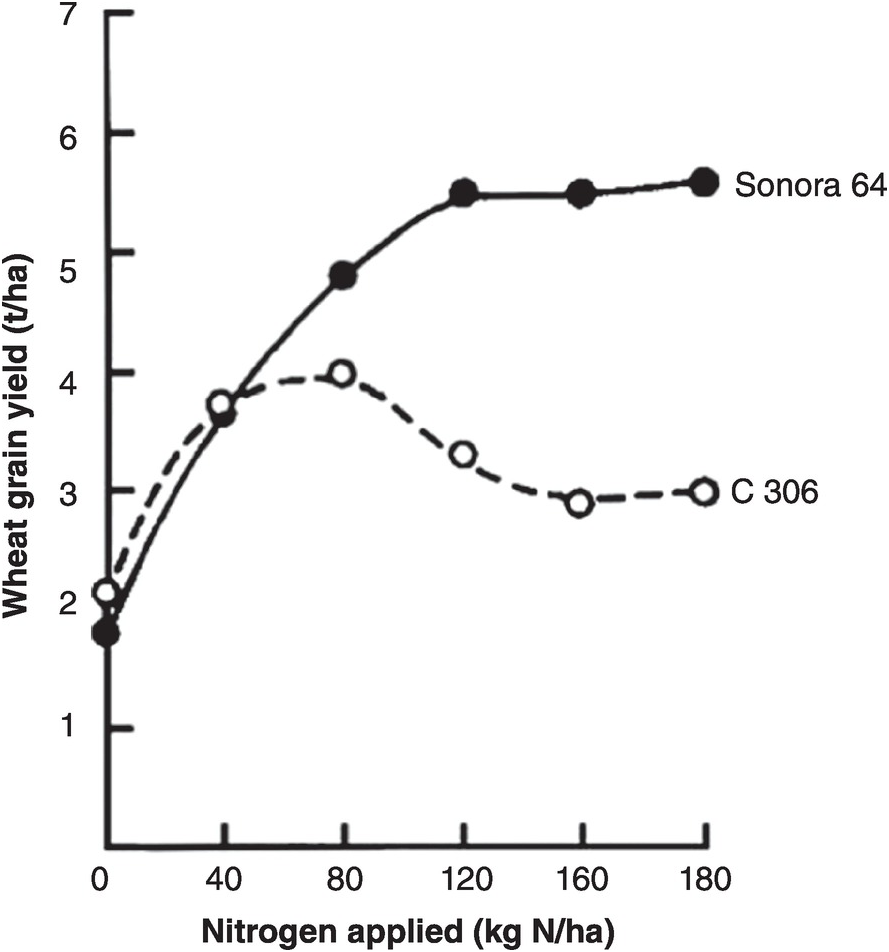
Fig. 13.13 One of the early Asian Green Revolution trials showing the different responses of the short-statured Sonora 64 wheat variety from Mexico versus a local one in Pantnagar, India (Sharma et al. Reference Sharma, Misra, Wright and Krantz1970).
The main nitrogen fertilizer management practices are to determine the right source, the right rate of application, the right placement and the right timing. This well-known paradigm has been made popular as the 4Rs (Roberts Reference Roberts2009).
13.5.4 Nitrogen Fertilizer Sources
Much research has been conducted to compare urea, ammonium sulfate and other nitrogen sources on corn, rice, wheat and sorghum in the tropics. For most crops, the overwhelming evidence indicates that there are no differences between urea and ammonium sulfate or other ammonium fertilizers. In instances where ammonium sulfate was superior to urea, the effect was due to sulfur deficiency or volatilization losses of surface-applied urea in high-pH soils. Where urea was superior, differences were due to the acidifying effect of large, long-term applications of ammonium sulfate in already acid soils. The bulk of the evidence indicates few differences in ammonium sources when properly applied, including DAP. Nitrate sources are usually inferior to ammonium sources under conditions favoring leaching or denitrification.
13.5.5 Rates of Application
Choosing the correct rate of application is one of the two most important fertilizer management practices, the other being timing of application. The most common point of departure for determining the rate (kg N/ha) is the existence of nitrogen response curves, which are available in most tropical agricultural regions. The zero fertilizer rate (the control) gives an idea of how much nitrogen a cultivar can obtain from the remaining mineral nitrogen from SOM mineralization, manure applications, legumes in rotation and atmospheric deposition.
There are numerous ways to determine rates, ranging from the empirical, using a response curve like the graphs of Fig. 13.14 combined with local experience, to sophisticated mass balance models and geographical information systems and remote sensing algorithms, with equipment that can be tractor-mounted (Meisinger et al. Reference Meisinger, Schepers, Raun, Schepers and Raun2008). The latter is great for precision agriculture, but for most small- and medium-sized tropical farms I would use the Linear Response and Plateau model (LRP), reproduced as Figure 13.14. Such a rate must also guarantee the maintenance of SOM using the fertilizer nitrogen that is immobilized by bacteria and eventually converted to SOM.
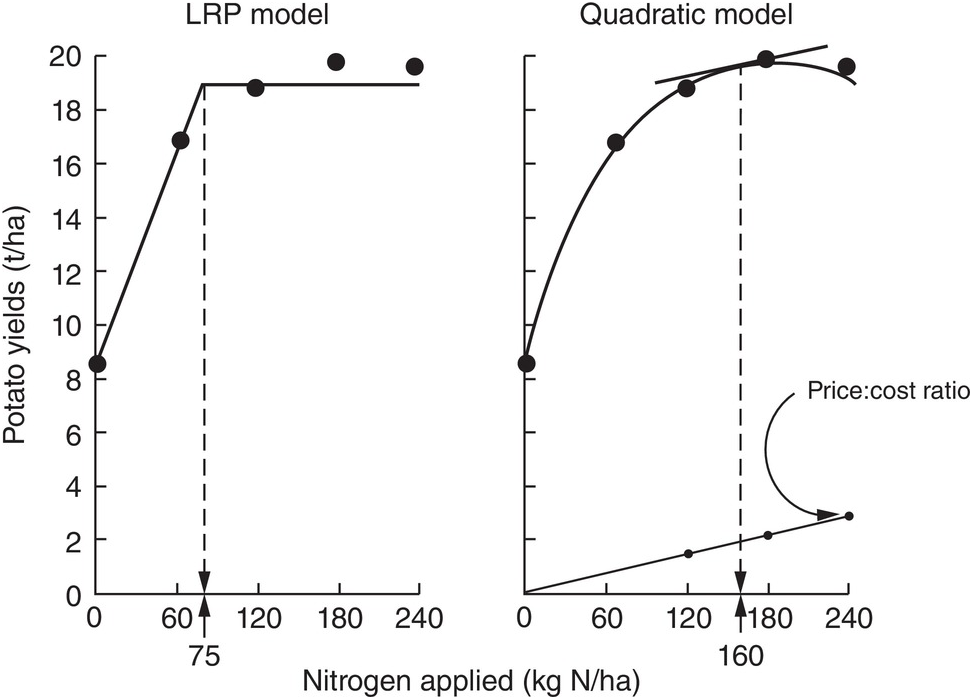
Fig. 13.14 Comparison between the LRP and the quadratic models, using the same field data from potatoes in Peru. The recommended rate is much lower using LRP (Waugh et al. Reference Waugh, Cate and Nelson1973).
13.5.6 Fertilizer Placement
Nitrogen fertilizer placement is determined by seed spacing. Plant population itself affects the shape of the response curve of improved germplasm. At low levels of applied nitrogen, a population of 30 000 plants per hectare is optimum for maize, whereas at higher nitrogen rates with the best hybrids, populations nowadays are 100 000 plants per hectare, and above. Figure 13.15 shows the relationship between nitrogen rate and population on maize yields, in an old experiment in Guadalajara, Mexico. To achieve high yields, both high populations and high nitrogen rates are needed. Sub-optimal plant populations are unfortunately very common in smallholder tropical farms without mechanization, and when a poor quality of seed is used. This is partly because the spacing between rows is not constant, or because too many seeds are placed in the same planting hole and then have to be thinned, wasting a valuable resource. In very poor areas, maize and other seeds are broadcast over the soil surface, guaranteeing very low yields. In such cases, the first task of an extension worker is to demonstrate how to plant in rows at the right population. Individual maize seeds are planted with close spacing, about 10–25 cm within the row and 75 cm between rows. This is called the Sasakawa method in parts of Africa, and is an effective way to increase maize yields in comparison with the common 90 × 90-cm spacing (Nziguheba et al. Reference Nziguheba, Palm, Berhe, Denning, Dicko, Diouf, Diru, Flor, Frimpong, Harawa, Kaya, Manumbu, McArthur, Mutuo, Ndiaye, Niang, Nkhoma, Nyadzi, Sachs, Sullivan, Teklu, Tobe and Sanchez2010). Other crops have their particular spacing requirements.
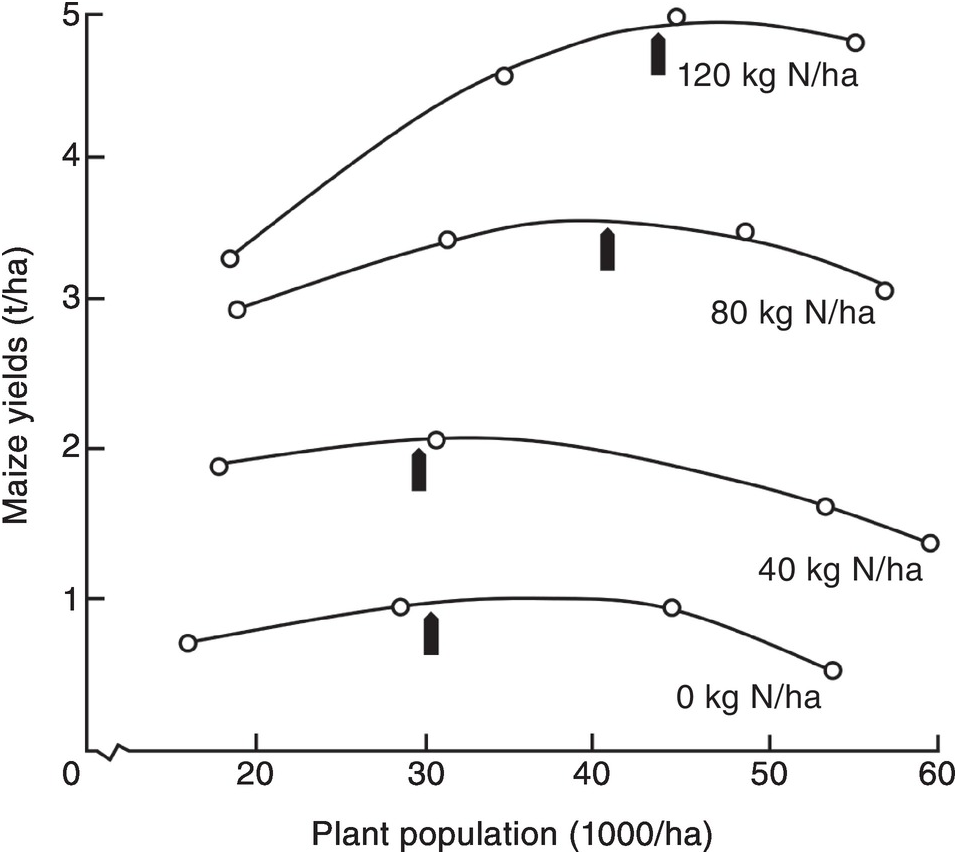
Fig. 13.15 Increasing population and nitrogen applications increase maize yields in Mexico. The optimum population for each nitrogen rate is indicated by an arrow (Laird and Lizárraga Reference Laird and Lizárraga1959).
Seasonal rainfall also exerts a marked influence on maize responses to nitrogen. Figure 13.16 illustrates the lower responses obtained when either excess moisture or drought occurred in a series of maize experiments in Mexico. Also, as discussed before in Chapter 6, short-term droughts during the rainy season (veranicos) can cause crop failures if they happen during the reproductive stage of crops. Such short-term droughts may be predictable in places where topography and soil texture varies, as in southern Malawi.

Fig. 13.16 Excess moisture or drought decreases maize response to nitrogen fertilizers in Mexico (Rockefeller Foundation 1963–64).
13.5.7 Timing of Applications
The timing of nitrogen applications for most crops consists of a basal application at planting and a topdressing application just before the crop’s grand period of growth. Pre-planting applications are usually determined by the need for phosphorus fertilizers, which is critical at early growth stages. But unlike phosphorus, nitrogen can be rapidly lost by leaching while the seed germinates and establishes a root system. Incorporating the fertilizer close to the seed, but with soil in between to avoid fertilizer burn (due to high salinity), is the best way. Due to the danger of leaching, normally only one-third of the nitrogen rate is applied at planting and the rest at topdressing time, when the plant is at about knee height. It is applied close to the maize rows and normally before the second weeding so the topdressing is also incorporated into the soil. It is seldom profitable, however, to have more than two split applications.
Fox et al. (Reference Fox, Talleyrand and Bouldin1974) summarized nitrogen responses to maize and sorghum in Oxisols and Ultisols in udic areas of Puerto Rico, and obtained nitrogen fertilizer recoveries of 51 percent with one side-dressed application, but only 33 percent when the same rate was incorporated into the soil surface at planting. In semiarid Zimbabwe, Piha (Reference Piha1993) found split applications better for sorghum, perhaps because of the unpredictability of rainfall events.
If there is likely to be a drought, farmers may minimize their losses by lowering the rate or avoiding the topdressing application. Also, the topdressing application can be fine-tuned with nitrate sensors or chlorophyll meters (Meisinger et al. Reference Meisinger, Schepers, Raun, Schepers and Raun2008).
Fertilizer applications should not be done after the crop has flowered because there will be little grain yield response. This unfortunately happens in many parts of Africa where subsidized fertilizer arrives too late but farmers still apply it after maize has tasseled. Avoiding this is another simple extension message in areas with no prior experience with mineral fertilizers.
13.6 Organic Nitrogen Mineralization
The fourth source of inorganic nitrogen to plants is organic nitrogen mineralization. It is not equivalent to the other three because SON has to come from the other three sources (nitrogen fertilizers, biological nitrogen fixation and atmospheric deposition). The decomposition of organic nitrogen into inorganic compounds (mineralization) consists of three steps: (1) aminization, the transformation of proteins into amines; (2) ammonification, the transformation of amines into NH4+; and (3) nitrification, the transformation of NH4+ into NO3– with a short intermediate stage of NO2– formation. Most nitrogen mineralization occurs in the topsoil, although its importance in deep tropical subsoils may be similar to that of carbon as described in Chapter 11.
Aminization and ammonification are done by enzymes carried by diverse heterotrophic and autotrophic bacteria, as well as fungi, as follows:
The hydroxide (OH–) ion formed produces a higher soil pH (Addiscott Reference Addiscott2005).
Nitrification, the aerobic oxidation of NH4+ to NO3– via NO2–, is one of the central processes in the nitrogen cycle. The process of nitrification is carried out by chemoautotrophic bacteria (those that derive their energy from the oxidation of nitrogen in contrast with the heterotrophic bacteria that derive their energy from carbon). It is a two-stage process, previously believed to be carried out by only four genera of bacteria (Mosier et al. Reference Mosier, Wassmann, Verchot, King and Palm2004, Norton Reference Norton, Schepers and Raun2008). First, the chemoautotrophs Nitrosomonas and Nitrosospira oxidize NH4+ to form NO2–:
Then the chemoautotrophs Nitrobacter and Nitrospira rapidly oxidize NO2– to NO3–:
Equation 13.10 produces four H+ ions, which is the reason for the secondary acidity that can be produced by ammonium-based fertilizers (Chapter 9).
New molecular techniques have found several more genera of ammonium- and nitrite-oxidizing bacteria. Most exciting has been the discovery of ammonium-oxidizing archea (Peter Groffman, personal communication, 2013), which, like bacteria, oxidize NH4+ to NO2– (Eq. 13.10), radically challenged our bacteriocentric view of nitrification and stands as an example of the fascinating complexity of microbes involved in biogeochemical cycling (Hatzenpichler Reference Hatzenpichler2012). Yao et al. (Reference Yao, Gao, Nicol, Campbell, Prosser, Zhang, Han and Singh2011) found ammonium-oxidizing archea to be the dominant NH4+ oxidizers in acid Ultisols (pH 3.5–5.5) that were grown with tea in tropical and subtropical China, and heavily fertilized with nitrogen.
These three equations are simplified ones, not including intermediate products that produce N2O or NO; they will be discussed later.
There’s been much interest and excitement about observations that plants can take up simple organic forms of nitrogen, mostly amino acids. The evidence is from boreal forest and tundra ecosystems (frigid soil temperature regimes) that are very nitrogen-poor. Schimel and Bennett (Reference Schimel and Bennett2004) consider that direct plant uptake of simple organic nitrogen molecules may dominate in such nitrogen-poor systems because the microbes assimilate most of the inorganic nitrogen ions. As temperatures increase, plants and microbes actively compete for NH4+ and NO3–, and small organic nitrogen molecules are taken up in lower proportions by plants. When nitrogen resources are high, as in tropical forests and fertilized agriculture, Schimel and Bennett hypothesize that uptake of NH4+ and NO3– becomes the dominant process because there is plenty of inorganic nitrogen ions to meet the demands of microbes and plants. It would be relevant to see how these processes are affected by variable-charge clays.
13.6.1 SON Pools and Nitrogen Mineralization
The pools that account for most nitrogen mineralization are the metabolic nitrogen pool and the active SON pool (which includes microbial biomass), while the structural nitrogen pool and the slow and passive SON pools (Fig. 13.4) have limited roles in nitrogen mineralization
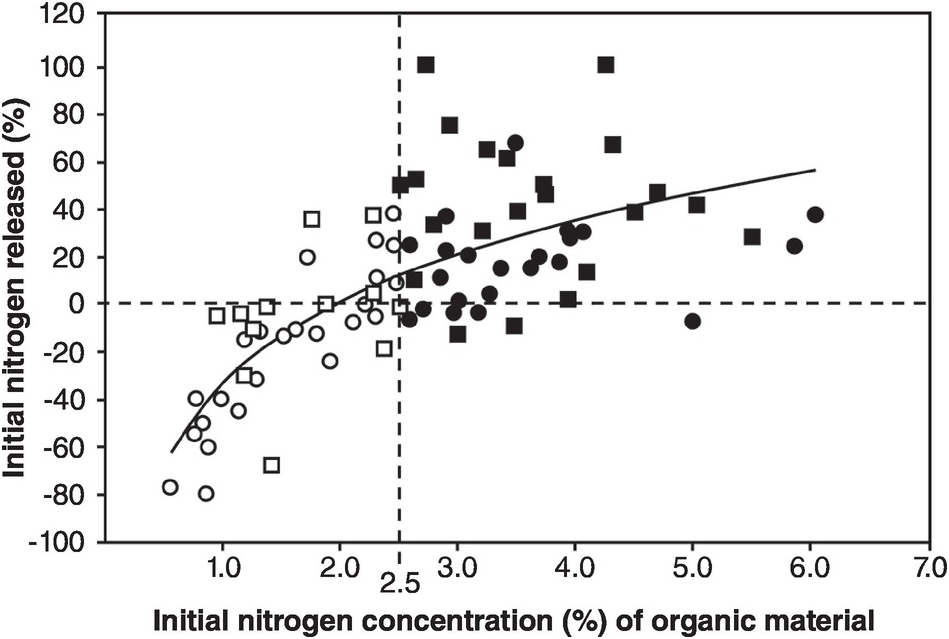
Organic resources or organic inputs, as explained in Chapter 11, are partitioned into metabolic or structural nitrogen pools (Fig. 13.4) according to their nitrogen and lignin contents. In the case of manures, where lignins have largely been digested by ruminant animals, the only indicator of quality (in this case mineralization versus immobilization) is nitrogen content, where the critical level seems to be 1.25 percent N (Murwira and Mukurumbira Reference Murwira and Mukurumbira1984), half of the critical level for plant materials (2.5 percent N). C:N ratios do not work because the carbon content of manures varies widely as explained in Chapter 11.
In addition to input quality as defined by the metabolic and structural nitrogen pools, the dominant factor affecting nitrogen mineralization rates in the tropics is topsoil moisture content. Calder (Reference Calder1957) and Semb and Robinson (Reference Semb and Robinson1969) found that mineralization may take place at moisture tensions higher than –1500 kPa, the “wilting point.” The water content present at high tensions in clayey, variable-charge soils, although unavailable to plants, seems to be available to mineralizing microorganisms. Both these pioneering studies took place in East Africa, probably on soils high in iron and aluminum oxides or allophane.
Nitrogen mineralization rates also depend on temperature. Low temperatures can be limiting in the tropical highlands, but high temperatures in tropical lowland areas seldom limit nitrogen mineralization per se. On the contrary, Mosier et al. (Reference Mosier, Wassmann, Verchot, King and Palm2004) indicated that the production of trace nitrogen gases – a product of initial mineralization and subsequently of water-filled pores – increases within the range of 20–40 °C in the tropics.
Between these extremes of moisture and temperature content, most tropical soils undergo several periods of alternate wetting and drying. Nitrogen mineralization is likely to be faster under alternate wetting and drying than under “optimum” moisture conditions. But these dynamics are short term, which results in a decline of the total SON (Ladha et al. Reference Ladha, Reddy, Padre and van Kessel2011).
13.6.2 Immobilization
Immobilization, the opposite process to mineralization, is where a high diversity of bacteria and other microorganisms convert NO2– or NH4+ into organic forms of SON. Immobilization occurs primarily in the active nitrogen pool, initially by the microbial biomass fraction of that pool. Manipulating the balance between nitrogen mineralization and immobilization can be a key management practice. The NO2– or NH4+ ions from fertilizers are immobilized and then subsequently mineralized as described later.
The balance between mineralization and immobilization is illustrated in Fig. 13.17, with 2.5 percent N being the critical level.

Fig. 13.17 Whether nitrogen is mineralized or immobilized from plant materials is determined by the nitrogen concentration of the materials and modified by high lignin or polyphenol contents. The regression equation is for all materials. Black squares or circles represent materials with > 2.5 percent N. White squares or circles are those with < 2.5 percent N. Squares represent materials with < 15 percent lignin and < 4 percent polyphenol. Circles represent materials with > 15 percent lignin or > 4 percent polyphenol.
13.6.3 Influence of the Core Properties
The three core soil properties also play important roles. Sandy topsoils have low levels of SON, mostly in the active pool where SON can be mineralized rapidly, releasing inorganic nitrogen to plants. Clayey soils have a higher SON content and generally have more labile carbon substrates for mineralization to proceed. Mineralogy also plays a role, particularly allophane, whereby Bornemisza and Pineda (Reference Bornemisza and Pineda1969) found that nitrogen mineralization is inversely proportional to its allophane content in Andisols. Mineralization at very high soil moisture tensions has been recorded in variable-charge oxidic and allophanic soils, as mentioned before, but it is not known whether the same happens in permanent-charge soils.
13.7 Nitrogen Fertilizer Reactions in Soils
The following sections describe the reactions that nitrogen fertilizers undergo in tropical environments. The acidification of some nitrogen fertilizers has been discussed in Section 9.8.
13.7.1 Urea Hydrolysis
Urea is the most commonly used inorganic nitrogen source in the tropics. Its popularity is partly due to its high nitrogen content (46 percent), low unit cost and its availability in the world market. When applied to a moist soil, urea is hydrolyzed into ammonium carbonate [(NH4)2CO3] by the enzyme urease in the following way:
 (13.12)
(NH4)2CO3 dissociates into the NH4+ and CO3– ions in the presence of water. Before hydrolysis, urea is as mobile as NO3– and may be leached to down below the root zone with heavy rainfall if soil structure permits. Tamini and Kanehiro (Reference Tamini and Kanehiro1962) showed that urea hydrolysis proceeds at about the same speed in the tropics as in the temperate region, and is complete within 1 to 4 days. In flooded soils, DeLaune and Patrick (Reference Delaune and Patrick1970) found that the rate of urea hydrolysis is similar to that in well-drained soils.
13.7.2 Ammonia Volatilization
At soil pH values higher than 7, the NH4+ ions can be converted to NH3 (ammonia gas) and lost to the atmosphere.
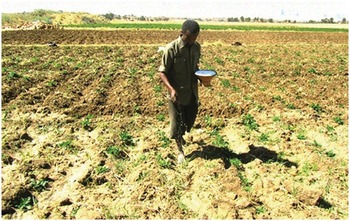
Volatilization losses of NH3 were first recognized in the tropics by Jewitt (Reference Jewitt1942), working with high-pH Vertisols in the Sudan. Broadcast nitrogen applications to the soil surface are very common in the tropics; therefore, volatilization losses can be of practical importance in high-pH soils, particularly when high nitrogen rates of urea are applied (Fig. 13.18). Shankaracharya and Mehta (Reference Shankaracharya and Mehta1971), working with a loamy sand of pH 7.1 in Gujarat, India, measured field volatilization losses of 4 percent when 28 kg N/ha was applied as urea to the soil surface. When the rate was increased to 277 kg N/ha, volatilization losses increased to 44 percent. Such high rates are common in areas where high-yielding cereals are planted. They also become the effective rate when fertilizers are point-placed around the planting hole in smallholder farming systems.

Fig. 13.18 A wasteful practice: broadcasting urea on Inceptisols of pH 8.3 in Koraro, Ethiopia.
Urea volatilization losses can be reduced if the material is placed below the soil surface before hydrolysis. This can be accomplished by incorporation, deep placement, or simply by moving the freshly applied urea down with irrigation water or rainfall. Table 13.8 shows the reduction in volatilization losses when irrigation followed a surface application. In the presence of moisture, volatilization of ammonia does not take place. This table also indicates that urea volatilization losses are essentially eliminated by incorporating the material to about 5 cm depth. The practical implication is that urea should be incorporated into the soil if it is to be applied to a dry calcareous soil.
Table 13.8 Volatilization losses of applied urea as a function of placement depth and timing in relation to irrigation in a calcareous loamy sand in Gujarat, India (nitrogen rate: 222 kg N/ha). Adapted from Shankaracharya and Mehta (Reference Shankaracharya and Mehta1971).
| Placement depth (cm) | Applied before irrigation | Applied after irrigation |
|---|---|---|
| Loss of applied nitrogen (%) | ||
| Surface | 8.1 | 40.2 |
| 1.2 | 1.2 | 33.4 |
| 2.5 | 0.6 | 18.1 |
| 5.0 | 0.05 | 0.5 |
| 7.5 | 0 | 0 |
13.7.3 Ammonium Fixation
NH4+ ions can be trapped between sheets of 2:1 layer-silicate minerals when they expand and contract with wetting and drying. This process is limited to clayey topsoils with smectitic, illitic or vermiculitic mineralogy, all of which have permanent charge, and does not happen in the more common kaolinitic, siliceous or oxidic mineralogies. Nevertheless, it is important in Vertisols of the tropics, although little work has been done on these. A good review with a temperate-region focus is that of Kissel et al. (Reference Kissel, Cabrera, Paramisavam, Schepers and Raun2008).
13.7.4 Immobilization of Fertilizer NH4+ and NO3–
Contrary to common agronomic knowledge, many, if not most, of the NH4+ and NO3– ions released by fertilizers are immobilized by microbes before they are taken up by crop roots (Myrold and Bottomley Reference Myrold, Bottomley, Schepers and Raun2008, Mulvaney et al. Reference Mulvaney, Khan and Ellsworth2009). Microbes are at near-nitrogen-starvation levels, and their large numbers in a rhizosphere that is rich in labile carbon impedes much of the direct uptake of fertilizer nitrogen by plant roots (Vitousek et al. Reference Vitousek, Haettenschweiler, Olander and Allison2002). Much of this immobilized nitrogen is mineralized quickly because many microbes have very high turnover rates (hours, days), and then it is quickly taken up by the crop roots. Vanlauwe et al. (Reference Vanlauwe, Diels, Aihou, Iwuafor, Lyasse, Sanginga, Merckx, Vanlauwe, Diels, Sanginga and Merckx2002) cited two laboratory experiments in which 50 ppm of fertilizer nitrogen was immobilized during the first 25 days after application, and mineralized 40–50 days afterwards. Also, much of a high nitrogen fertilizer application rate (168 kg N/ha) to Mollisols in Kansas was immobilized, released and taken up by maize plants 50–120 days afterwards (Brady and Weil Reference Brady and Weil2008). Such processes may improve the synchrony between nutrient supply and plant demand and reduce nitrate leaching and N2O losses. It is one reason why the recovery of fertilizer nitrogen by crops is seldom higher than 50–70 percent. More on this issue later.
The above paragraph is full of the phrase “much of,” showing the need for quantification. How much fertilizer nitrogen is immobilized? For how long? How much is released under different soil conditions in tropical agricultural systems? What are the turnover times? How much of the fertilizer nitrogen is building SOM via this mechanism?
Microbial immobilization of fertilizer nitrogen may be a good thing for basal nitrogen applications, which are in danger of loss because the crop seedlings do not have much of a root system at their early stages of growth. However, not having much of a root system means little rhizosphere and probably less free-living bacteria to immobilize the basal fertilizer applied. I did not find any data to confirm this, one way or the other.
13.8 Fluctuations of Inorganic Nitrogen
Inorganic nitrogen in most tropical areas shows a marked seasonal fluctuation, as illustrated in Fig. 13.19. The pattern consists of (1) a slow build-up of nitrate in the topsoil during the dry season; (2) a large but short-lived increase at the onset of the rainy season; (3) downward nitrate movement during the rainy season plus crop nutrient uptake, which finishes with the crop harvest.
The following is an analysis of the individual components of this seasonal pattern. Although this pattern is typical of ustic soil moisture regimes, it occurs to a lesser extent in udic regimes.
13.8.1 Nitrate Accumulation during the Dry Season
The accumulation of NO3– ions in the topsoil during the dry season can be explained by the upward movement of NO3– with the evaporation stream and the existence of nitrification at soil moisture tensions of –1500 kPa to –8000 kPa (Semb and Robinson Reference Semb and Robinson1969). Although the topsoil may be drier than those tensions indicate, the subsoil may have moisture to support mineralization. Since most of the water movement during the dry season is upward, NO3– ions previously present or recently mineralized in the subsoil may move up and accumulate in the topsoil. Wetselaar (Reference Wetselaar1961), working with an Alfisol from northern Australia, found evidence of dramatic nitrate build-ups in the top 5 cm. He explained that NO3– ions were mineralized in the subsoil where adequate moisture existed during the dry season, and accumulated just below a soil surface crust where capillary conductivity is broken.
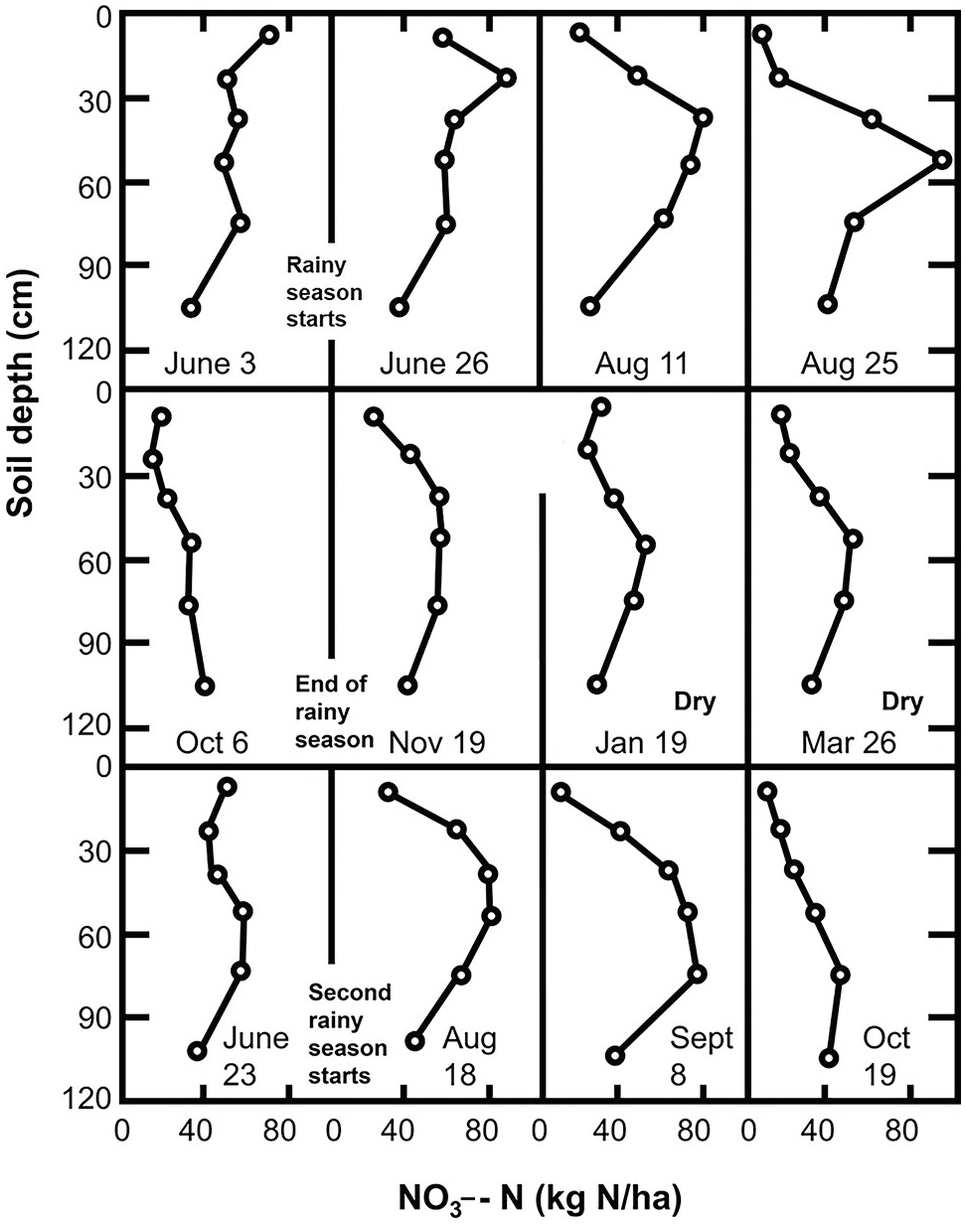
Wild (Reference Wild1972aReference Wildb) followed the nitrate content of a profile in northern Nigeria for 2 years. His results, shown in Fig. 13.19, indicate an upward movement of NO3– ions during the dry season. This figure suggests that nitrate was leached into the subsoil during the previous rainy season and moved upward during the dry season. Hardy’s original data (Table 13.9) from a study in Trinidad shows nitrate levels increase in the topsoil (A horizon) during the dry season.
Table 13.9 Seasonal levels of soil nitrate and moisture content of a sandy soil in Trinidad, mean of 3 years. Adapted from Hardy (Reference Hardy1946).
| Season | Rainfall | Soil horizon | Inorganic nitrogen (kg NO3–-N/ha) | ||
|---|---|---|---|---|---|
| Maize | Pasture | Fallow | |||
| Rainy | 190 mm/month | A | 9 | 8 | 18 |
| B | 10 | 7 | 13 | ||
| Dry | 38 mm/month | A | 22 | 10 | 35 |
| B | 10 | 9 | 17 | ||
13.8.2 The Birch Effect: Nitrogen Flushes at the Onset of the Rainy Season
Within a few days after the first heavy rains, dramatic increases in inorganic nitrogen take place in the subhumid and semiarid tropics. In the field, such increases may range from 23 kg N/ha to 121 kg N/ha within 10 days after the onset of the rains (Semb and Robinson Reference Semb and Robinson1969). The sharpness of the peaks is directly proportional to the duration and intensity of the preceding dry period. These sharp increases are accompanied by similarly sharp decreases, caused by rapid leaching or plant uptake at the start of the rainy season (Fig. 13.20). Note that these changes are less pronounced in the “short rains” in the bimodal climate of the forest zone of Ghana, shown in this figure. Semb and Robinson’s work in East Africa provided clear evidence of NO3– ions moving into the subsoil after such flushes.
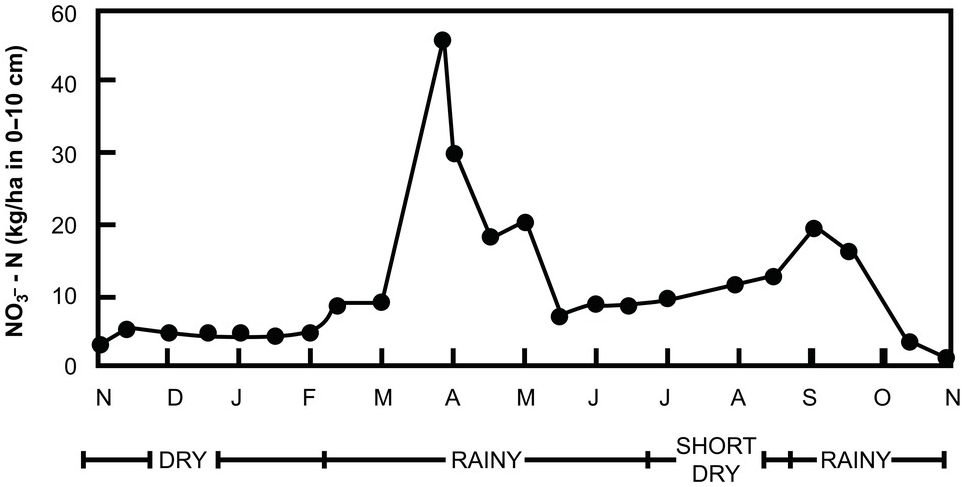
Fig. 13.20 Seasonal pattern of NO3–-N fluctuation in the top 10 cm of a cultivated Alfisol in Ghana with a bimodal udic soil moisture regime.
These short-term peaks were first described by Hardy in 1946 in Trinidad. Subsequent work in Africa by Birch and other workers substantiated their existence in a wide range of soil conditions (Birch Reference Birch1958, Reference Birch1960aReference Birchb, Reference Birch1964). The flushes are called the Birch effect because of the popularity of Birch’s articles (Chapters 6 and 7).
Birch (Reference Birch1958, Reference Birch1960aReference Birchb, Reference Birch1964) found that drying promotes faster carbon than nitrogen mineralization, thus reducing the C:N ratios. He also found that the critical C:N ratio above which mineralization stops is higher under alternate wetting and drying than under constant soil moisture. For example, an organic material containing 1.5 percent N was mineralized under alternate wetting and drying but was immobilized under constant moisture. Much of the microbial population is dead by the end of a strong > 6 month dry season. Active microbial populations build up rapidly when the rains start, using the dead microbial biomass as a substrate.
This is a very important process that has been largely ignored in the tropics outside of Africa and in the world in general. Gutschick (Reference Gutschick1981) noted that many crops were domesticated from weedy plants, and are adapted to exploit flushes of nitrogen. But for them to take advantage of the short-lived Birch effect, plants need to have a sufficiently developed root system to start with or to be capable of developing one within the first month or so into the rainy season. Ratoon crops of sugar cane are especially suited to take advantage of the Birch effect because they have most of the live root system of the previously cut crop already in the ground – as are natural systems, permanent pastures and tree crops.
This is why I think the Birch effect could explain part of the dilemma of changing soil nitrogen availability during what is supposed to be endophytic nitrogen fixation. Data are needed, particularly by South American scientists. We need to get a handle on how important, or not, this Birch effect is, where sugar cane is grown in ustic soil moisture regimes in Brazil.
The Birch effect is very important in the ustic soil moisture regime of the subhumid and semiarid tropics. It is probably of low importance in the udic, humid tropics due to the lack of a sufficiently prolonged dry season to kill and desiccate a sufficient microbial biomass so it can serve as a substrate for new microbes to rapidly grow at the onset of the rains. It is also unlikely to be important in the arid tropics because insufficient microbial biomass may accumulate during the previous very short rainy season. It will be unimportant in aquic soil moisture regimes, and probably less important in the highland tropics (isomesic and isofrigid soil temperature regimes) because of the constantly low soil temperatures.
The flushes of nitrogen mineralization at the start of the growing season are unlikely to take place in temperate-region soils, characterized by cold, wet springs preceded by winters where much denitrification takes place. In summary, the Birch effect is an important phenomenon in the nitrogen cycle only in ustic soil moisture regimes with isohyperthermic, hyperthermic, isothermic and thermic soil moisture regimes, which cover much of the tropics and some of the subtropics. This flush probably explains why new grass growth appears so green at the beginning of the rainy season in areas that have undergone no burning during the dry season. Where burning does take place, ash deposition, particularly in phosphorus-deficient soils, is a major reason for the greening. The relative effects of the flush of nitrogen mineralization and ash deposition need to be determined.
The Birch effect has been found by Fierer and Schimel (Reference Fierer and Schimel2002), Miller et al. (Reference Miller, Schimel, Meixner, Sickman and Melack2005) and Placella et al. (Reference Placella, Brodieb and Firestone2012) in temperate xeric soil moisture regimes of Mediterranean climates using up-to-date methodologies. The cause is the same, a long, dry summer followed by a wet winter. It is interesting that tropical soil scientists were over 60 years ahead in reporting this important phenomenon. Part of the reason is that many young scientists nowadays only pay attention to the literature that is available on the internet, and much of this old stuff is not digitized.
13.8.3 Downward Nitrate Movement During the Rainy Season
As the rainy season progresses, the inorganic nitrogen supply is reduced by plant uptake and leaching. Hardy (Reference Hardy1946) showed the effect of crop uptake in decreasing NO3– content in Table 13.9. Leaching depends on a series of soil factors.
Going back to Fig. 13.19, Wild (Reference Wild1972aReference Wildb) found that peak NO3– concentration in the profile gradually moves down as the rainy season progresses. At the beginning of the rainy season (June 3) most of the nitrates were concentrated in the top 15 cm. Three weeks later, after the flush, leaching started and the peak concentration moved down to between 15 cm and 30 cm. By August 11, well into the rainy season, the peak concentration was at 30–45 cm, and 2 weeks later it was at 45–60 cm.
In Wild’s experiment, NO3– ions moved at the approximate rate of 0.5 mm per mm of rain. The topsoil of this Alfisol is probably loamy, with clay increasing with depth. This movement is considerably slower than in sandy soils. Terry and McCants (Reference Terry and McCants1970), for example, found that nitrate moved at a rate of 1–5 mm per mm of rain in sandy Ultisols of North Carolina.
In well-aggregated Oxisols (not the loamy Alfisol of Figure 13.19), both downward movement of rainwater through large channels and slow lateral diffusion through the microaggregates occurs. Consequently, although many of the well-aggregated Oxisols act like sands in terms of water retention, their leaching losses of mineralized soil nitrogen are bound to be slower than those in sands because the NO3– ions mineralized inside the aggregates have to move through the micropores and out into the macropores before they can be susceptible to leaching. If the subsoil has some degree of anion exchange capacity, as shown in Chapter 8, nitrate movement will be reduced.
Wild (Reference Wild1972aReference Wildb) also found that the total nitrate content in the top 120 cm of the Fig. 13.19 Alfisol did not change significantly during the year, except at the end of the rainy season, when larger leaching losses took place because of a drop in the valley water table. In his 2 years of observations, therefore, most of the inorganic nitrogen never left the soil profile.
Fluctuations are also minimal if actively growing crops absorb nitrate quickly. Hardy’s data in Table 13.9 show that a soil under pasture had lower nitrate content than under maize because of year-round nitrogen uptake by pastures.
It is important to realize that the inorganic nitrogen fluctuation pattern just described is quite different from the one commonly found in much of the temperate region. The growing season in the humid (udic) temperate region begins with a cold, wet soil, low in inorganic nitrogen because of the slow mineralization rates during fall and winter as well as high denitrification losses. As temperatures warm up gradually in the spring, there is a correspondingly gradual increase in organic nitrogen mineralization. Inorganic nitrogen increases slowly, without flushes, because of the high soil moisture status. During the summer, mineralization rates can be very high, and the inorganic nitrogen content will depend on crop uptake, leaching and denitrification. Most of the nitrogen management practices used in the temperate region have been developed to fit such a pattern. Nitrogen management practices in the tropics should give more consideration to the Birch effect pattern.
13.9 Combining Mineral and Organic Nitrogen Fertilizers
The agronomic ideal is to synchronize the plant’s nutrient needs with the nutrient release from the added inputs (Swift Reference Swift1985), which is difficult to do, as shown graphically in Fig. 12.4 of the previous chapter. Palm et al. (Reference Palm, Myers, Nandwa, Buresh, Sanchez and Calhoun1997) and Vanlauwe et al. (Reference Vanlauwe, Diels, Aihou, Iwuafor, Lyasse, Sanginga, Merckx, Vanlauwe, Diels, Sanginga and Merckx2002) proposed that synchrony is probably best done with a combination of mineral and organic fertilizers. The mineral nitrogen fertilizers are so soluble that some of them may leach before bacteria can immobilize them or plant roots have the opportunity to take them up. Organic fertilizers may immobilize nitrogen from mineral fertilizers and then bacteria mineralize them slowly afterwards, improving synchrony. Organic fertilizers are usually applied and incorporated into the soil at planting or pre-planting time, sometimes combined with the basal applications of mineral fertilizers.
13.9.1 Classifying Organic Fertilizers
Ten classes of organic fertilizers are described in Table 13.10. The first four are leafy plant biomass, classified according to Palm et al. (Reference Palm, Gachengo, Delve, Cadisch and Giller2001), and the remaining are animal manures and composts that I am adding, based on Chapter 11, the work from Zimbabwe and the Sahel on manures, and my limited experience with composts. The high percentage of phosphorus criterion is designed not to add too much phosphorus to a crop, which can happen with poultry manures. The polyphenol requirement of Palm et al. (Reference Palm, Gachengo, Delve, Cadisch and Giller2001) was dropped because experience indicated it is of little value.
Table 13.10 Classes of organic fertilizers.
Class 1 plant biomass inputs are almost equivalent to nitrogen fertilizers in terms of mineral nitrogen release. Low-quality (class 4) plant biomass inputs immobilize mineral nitrogen but do not mineralize it fast enough to be synchronized with crop demand (Palm et al. Reference Palm, Myers, Nandwa, Buresh, Sanchez and Calhoun1997). Classes 2 and 6 may immobilize nitrogen from fertilizers and mineralize it slowly enough to increase crop yields, thus improving synchrony and reducing leaching – according to Vanlauwe et al. (Reference Vanlauwe, Diels, Aihou, Iwuafor, Lyasse, Sanginga, Merckx, Vanlauwe, Diels, Sanginga and Merckx2002) and Chivenge et al. (Reference Chivenge, Vanlauwe, Gentile, Wangechi, Mugendi, van Kessel and Six2009) for plant biomass inputs; and Pieri (Reference Pieri1992) and Mugwira and Murwira (Reference Mugwira, Murwira, Waddington, Murwira, Kumwenda, Hikwa and Tagwira1998) for manures. They may also decrease NO and N2O emissions.
All organic fertilizers contain the other 13 essential nutrients besides nitrogen, and their application often prevents the development of other nutrient deficiencies. Combining does not necessarily mean mixing. Organic fertilizers could be applied before planting followed by topdressing with mineral nitrogen fertilizers.
Chivenge et al. (Reference Chivenge, Vanlauwe and Six2011) conducted a meta-analysis of 104 experiments that compared plant biomass inputs (classes 1 to 4) with mineral nitrogen fertilizers, mixed or applied separately, using rainfed maize in 12 countries of tropical Africa. They measured crop responses; agronomic efficiency (AEN), in kilograms of additional grain per kilogram of nitrogen applied, either as mineral or organic fertilizers; changes in SOC content; and residual yield effects, in experiments lasting at least 5 years. Control yields ranged from 0 t/ha to 7 t/ha, covering a wide range of initial soil nitrogen fertility conditions. Their main results were as follows:
Maize yield responses were higher with the combined organic and nitrogen fertilizer applications (114 percent response over the control), while nitrogen fertilizers produced an 84 percent response, and class 1 to 4 of organics alone produced a 68 percent response. The authors attribute this to a temporary immobilization of nitrogen from fertilizers by the organic inputs, which may have improved synchrony.
Classes 1 and 2 of organics increased yields by about 90 percent (similar to nitrogen fertilizers); class 3 organics increased yields by 50 percent, while the lowest quality class 4 barely increased yields by about 7 percent. Crop yield responses definitely were higher with higher organic input quality, confirming the Palm et al. (Reference Palm, Gachengo, Delve, Cadisch and Giller2001) model, although the separation between classes 1 and 2 was minimal.
Class 4 organics alone depressed yields in sandy soils but, when combined with nitrogen fertilizers, yield responses were much larger in sandy than in clayey soils. Chivenge et al. (Reference Chivenge, Vanlauwe and Six2011) believe this combination, applied every year, could increase sustainability in sandy soils. This augurs well for the Sahel, where most of the soils are sandy and most biomass that can be added is of low quality. With class 4, low-quality organics, temporary immobilization of the nitrogen from fertilizer and subsequent release may proceed too slowly to benefit the current crop but will be beneficial in the long term.
The trend in agronomic use efficiency was different in the mineral–organic combinations compared to mineral fertilizers alone. The AEN value for the combination was only 14 ± 2 kg grain/kg N, far below that of nitrogen fertilizers alone (23 ± 4 kg grain/kg N), and almost the same as with organics alone, 13 ± 3 kg grain/kg N. So, nitrogen fertilizers in this meta-analysis were almost twice as efficient as classes 1 to 4 of organics, but the combination provided higher yield responses, which could be due to the addition of other nutrients in the organics.
Soil texture had additional effects. Clayey soils were doubly superior in agronomic use efficiency (AEN = 21 percent) to loamy (AEN = 8 percent) and sandy soils (AEN = 10 percent). Most of the soils that had low control yields, but also greater yield responses, were sandy soils.
The lower the fertilizer nitrogen rate the larger the beneficial effect of combining it with organic biomass resources.
High-quality organic fertilizers produce longer residual effects. This contradicts the common belief that the lower-quality organic fertilizers may have longer residual effects because of their slow rate of decomposition.
The above results indicate that combining plant biomass resources with nitrogen fertilizers is beneficial, and more so if the organics are of high quality. The combination will also increase SON, which will improve nutrient storage. The latter is particularly the case in sandy soils since it is most likely that the increase in SON will be in the active SON pool where nitrogen will be rapidly mineralized, improving soil fertility but not total SON content.
In a previous study, Chivenge et al. (Reference Chivenge, Vanlauwe, Gentile, Wangechi, Mugendi, van Kessel and Six2009) compared classes 1 to 5 of organics, which included high-quality cattle manure in two soils near Embu, Kenya, over a 10-year period. Class 1 (Tithonia diversifolia) and class 5 (high-quality manure) produced the highest maize yields at both sites. Classes 2, 3 and 4 produced progressively lower yields. Class 5 cattle manure was as effective as the class 1 leafy organics.
As mentioned before, the two newly introduced animal manure classes in Table 13.10 are based primarily on the work of Zimbabwean and Sahelian soil scientists. In Zimbabwe, Mugwira and Murwira (Reference Mugwira, Murwira, Waddington, Murwira, Kumwenda, Hikwa and Tagwira1998) reviewed cattle manure research since 1913 in sandy soils of communal areas and with large cattle populations, which I classify as class 6 organic fertilizers. These authors concluded that “these studies indicated that manure alone generally produced low yields and needed supplementing with inorganic fertilizers, particularly N, for optimum yields.” They further stated that “these benefits derive primarily from the ability of cattle manure to supply other nutrients. Manure application to granitic sands [sandy Alfisols or Ultisols] has been shown to overcome or prevent deficiencies of nutrients including S, Mg, Zn and B, and to enhance soil available N, P and K.”
Summarizing 30 years of research in Francophone West Africa, in mostly long-term field experiments on sandy Alfisols of the Sahel, and using cattle manure similar to the Zimbabwe situation (class 6), Pieri (Reference Pieri1992) concluded the following:
Where animal traction is used, manure becomes a resource. The best results were obtained when ~ 5 t/ha per year of manure were combined with annual applications of NPK (nitrogen, phosphorus and potassium) fertilizers, eliminating yield declines for many years. Manure applications often eliminated the need for liming to counteract secondary soil acidity in these sandy soils. Apparently, the calcium and magnesium content in the manure had some liming effect, although no nutrient composition data were provided.
In very sandy, unbuffered soils (> 90 percent sand), even a 10 t/ha manure application could not prevent the loss of SOC with cultivation, which proceeds at a very high rate – 6 percent per year in the hot, semiarid climate of Bambey, Senegal – suggesting that the active SOC level could not be maintained.
On better textured soils (> 10 percent silt and clay), as in Saria, Burkina Faso, the decomposition rate is reduced to 2 percent with mineral fertilizer plus manure, and decomposition rates of SOC become lower by adding a grain legume in rotation.
The best results were invariably obtained with the combination of cattle manure and NPK fertilizers. Generally, crop yields increased from values as low as 0.4 t/ha to 2–3 t/ha.
13.9.2 Importance of Knowing Nutrient Composition
Comparisons of cattle manure versus mineral fertilizers in the tropics have been carried out principally in India and Africa (Pieri Reference Pieri1992). The main problem is that the nutrient contents of the manure must be known for comparisons to be valid, but that seldom happens. The large difference in nitrogen lost during manure storage (Chapter 11) further complicates the issue if manure sampling is done shortly after excretion.
Several long-term comparisons in Africa did take into account the nutrient composition of the animal manure employed (Djokoto and Stephens Reference Djokoto and Stephens1961, Stephens Reference Stephens1969, Heathcote Reference Heathcote1970). They show that crop responses to animal manures can be explained in terms of their nutrient composition, particularly the potassium and phosphorus content. For example, Stephens (Reference Stephens1969) found, in 18 long-term experiments in Uganda, that manure applications were superior to mineral fertilizers. Manure provided 75 kg K/ha annually, whereas the fertilizer used supplied only 25 kg K/ha to potassium-deficient soils. Obviously, the difference was due to nutrient composition.
Nevertheless, it is possible to generalize that the combined use of organic and mineral nutrient inputs often produces higher long-term yields than in either full organic or full mineral applications (Greenland Reference Greenland, Leigh and Johnston1994, Swift et al. Reference Swift, Seward, Frost, Qureshi, Muchena, Leigh and Johnston1994, Palm and Swift Reference Palm and Swift2002, Sanginga and Woomer Reference Sanginga and Woomer2009). Livestock manures (classes 5 and 6) often buffer the soil against acidification by continued use of acid-forming nitrogen fertilizers (Pieri Reference Pieri1992). Class 6 manures often do not add enough nutrients, including nitrogen (Murwira and Mukurumbira Reference Murwira and Mukurumbira1984).
The ratio of mineral to organic nutrient inputs usually increases with agricultural intensification. Therefore, identification of the threshold amounts of organic inputs necessary to maintain non-nitrogen functions should be considered in the integrated management of soil fertility (Palm and Swift Reference Palm and Swift2002).
13.9.3 Dynamics of Mineral and Organic Fertilizers with Time
When I was a graduate student, attending International Rice Research Institute (IRRI) seminars in the Philippines, I repeatedly heard Felix Ponnamperuma, Akira Tanaka, Richard Bradfield and SK DeDatta saying that about 50 percent of the nitrogen used by rice came from fertilizers. I wondered, where does the other 50 percent come from? But I was too overwhelmed by these world-class scientists to dare ask them such a seemingly stupid question. It has taken decades for me to answer that question. Advice to present day students: Ask.
Because of the immobilization of fertilizer nitrogen and leaching and denitrification losses, the recovery of applied fertilizers by the crop to which it is applied is generally about 30–50 percent, which is known as percentage of fertilizer recovery, the most commonly used fertilizer efficiency metric. So what happens to the rest?
Dourado Neto et al. (Reference Dourado Neto, Powlson, Abu Bakar, Bacchi, Basanta, thi Cong, Keerthisinghe, Ismaili, Rahman, Reichardt, Safwar, Sangakkara, Timm, Wang, Zagal and van Kessel2010), supported by the International Atomic Energy Agency, conducted a coordinated set of field trials in five tropical countries (Bangladesh, Brazil, Malaysia, Sri Lanka and Vietnam) plus four others (China, Chile, Egypt and Morocco), using the local cropping systems and both 15N-labeled fertilizer and 15N-labeled crop residues that were generated from the first cropping season. The results are summarized in Table 13.11.
Table 13.11 Cumulative crop recovery, soil immobilization and losses of one application of fertilizer nitrogen with and without its crop residues, using 15N-labeled material, in 13 long-term field trials in nine countries with five successive harvests. Ammonium sulfate was the main nitrogen source, and rates varied according to the cropping system, in the range of 28–300 kg N/ha. Calculated from data by Dourado Neto et al. (Reference Dourado Neto, Powlson, Abu Bakar, Bacchi, Basanta, thi Cong, Keerthisinghe, Ismaili, Rahman, Reichardt, Safwar, Sangakkara, Timm, Wang, Zagal and van Kessel2010) and Chris van Kessel, personal communication, 2012.
| Nitrogen Source | Recovered in | Crop 1 | Crop 2 | Crop 3 | Crop 4 | Crop 5 |
|---|---|---|---|---|---|---|
| Cumulative recovery of labeled fertilizer or crop residue (%); the change from previous crop is given in parentheses | ||||||
| 15N fertilizer plus unlabeled crop residue | Crop (uptake) | 29.6 | 34.4 (4.8) | 35.4 (1.0) | 32.1 (–3.3) | 32.4 (0.8) |
| Soil (immobilized) | 35.0 | 32.9 (–3.9) | 21.0 (–11.9) | 16.1 (–4.9) | 15.9 (–4.2) | |
| Lost | 36.1 | 33.1 (–3.0) | 44.0 (10.9) | 51.7 (7.7) | 51.8 (0.1) | |
| 15N crop residue plus unlabeled fertilizer | Crop (uptake) | 7.2 | 10.8 (3.6) | 14.5 (3.8) | 11.5 (–3.0) | 13.3 (1.8) |
| Soil (immobilized) | 65.3 | 64.2 (–1.1) | 43.3 (-20.9) | 36.8 (–6.5) | 38.7 (–11.9) | |
| Lost | 29.3 | 28.1 (1.2) | 43.0 (14.9) | 52.1 (9.1) | 48.5 (–3.6) | |
In spite of the wide array of soils, cropping systems and climates involved, only an average of 30 percent (ranging from 7 percent to 58 percent in the individual country trials – data not shown) of the 15N fertilizer was recovered by the first crop. The rest of the 15N fertilizer was found immobilized in the SON (35 percent) and lost by leaching or gaseous losses (36 percent). So, we have a first quantification of the amount of nitrogen fertilizer immobilization.
The 15N-labeled crop residues contributed only 7 percent of the original crop uptake; 65 percent was immobilized into SON, and 29 percent was lost as leaching and gaseous losses – a similar amount to losses from the 15N fertilizer.
With subsequent crops, the crop recovery from the original 15N fertilizer increased by about 4.8 percent with the second crop, with no significant residual effects. Afterwards, according to the literature review by Dourado Neto et al. (Reference Dourado Neto, Powlson, Abu Bakar, Bacchi, Basanta, thi Cong, Keerthisinghe, Ismaili, Rahman, Reichardt, Safwar, Sangakkara, Timm, Wang, Zagal and van Kessel2010), the residual effect of nitrogen fertilizers usually stops at the second crop. They conclusively proved that.
The amount of 15N fertilizer immobilized by SON decreased gradually from 35 to 16 percent at the fifth crop, indicating that SON was being mineralized and used by the plant. But nitrogen losses also increased, suggesting that some of the SOM mineralized was lost, and not taken up by the crop (Table 13.11).
The treatments receiving crop residues fared worse than those with 15N fertilizer. Recovery of 15N crop residues was only 7 percent by the first crop but increased with time to 11–15 percent, indicating the slow mineralization of nitrogen in crop residues. However, 39 percent of the 15N nitrogen in crop residue was still present in the SOM after 5 years, that is twice the amount from 15N fertilizer nitrogen, which presumably may enter the slow SON pool. The overall losses were similar in both 15N sources after 5 years.
Using unlabeled materials (not shown in Table 13.11), Dourado Neto et al. (Reference Dourado Neto, Powlson, Abu Bakar, Bacchi, Basanta, thi Cong, Keerthisinghe, Ismaili, Rahman, Reichardt, Safwar, Sangakkara, Timm, Wang, Zagal and van Kessel2010) concluded that 79 percent of all the nitrogen uptake by the five crops originated from SOM, either nitrogen immobilized before this study or during it.
This excellent study showed that the residual effect of fertilizer nitrogen recovery by the crop is short-lived, and that most of the nitrogen taken up by crops came from the mineralization of SON. The authors concluded that the main residual effect of fertilizer nitrogen is to replenish SON pools. This study provides excellent support of the role of nitrogen inputs for maintaining SOM levels as a major component of sustainability.
13.10 Environmental Consequences
The main environmental consequences of nitrogen fertilization are both positive and negative. The main positive ones are their role in maintaining or increasing SON (as shown above), and in converting excessive reactive nitrogen into inert N2 via denitrification. The main negative ones are emissions of greenhouse gases and leaching losses of nitrate.
13.10.1 Can Mineral Fertilizers Increase SOC?
The answer in most cases is yes, provided that carbon is also added, for instance, by incorporating crop residues or adding organic inputs of differing qualities.
The SOC equilibrium content is a function of the following simple formulas, copied here from Chapter 11, and developed by Greenland and Nye (Reference Greenland and Nye1959). It shows these relationships:
where C is the SOC stock in equilibrium (t/ha or kg C/m2); b is the annual amount of fresh organic inputs added to the soil (t C/ha per year); m is the fraction of fresh organic annual input that enters the SOC pools, i.e. the fraction of total fresh organic matter that is not respired in the initial decay of litter (fraction per year); a is the annual addition of SOC (t C/ha per year); and k is the annual decomposition rate of SOC (fraction per year). Nitrogen fertilization can increase the value of b, change the value of m and decrease the value of k.
Increasing the Annual Amount of Fresh Organic Inputs (b)
When crop yields increase in response to mineral nitrogen fertilization, they add more above-ground crop residues as well as roots to the soil. Unfortunately, in many tropical farming systems, crop residues are removed and used for animal feed, cooking fuel and even fencing. Crop residues are often piled up and burned in rice cropping systems, increasing soil variability. Since 1 ton of additional grain generally produces another 1–2 tons of above-ground crop residues, the return of above-ground crop residues to the soil is an important contribution. But if crop residues are removed, fertilizer applications will have to rely on root decomposition to increase SOC. Roots at harvest time constitute 11–22 percent of the total dry mass production, which includes 5–21 percent of the nutrients that are accumulated by grain crops (Sanchez et al. Reference Sanchez, Palm, Szott, Cuevas, Lal, Coleman, Oades and Uehara1989). This may not be sufficient b input to increase SOC, and in some cases may cause SOC depletion.
Long-term research on Inceptisols and Alfisols in semiarid India shows that the increase in SOC by mineral fertilization was a function of the carbon inputs added by the different rotations and soils, which in turn depended on the proper fertilizer combination. Figure 13.21 shows that insufficient organic inputs resulted in SOC depletion, but adequate inputs increased the SOC. The carbon input required to increase SOC varied with soil texture, being about 6 t C/ha per year in a sandy loam in Barrackpore, about 3 t C/ha per year in the sandy clay loam in Ranchi and about 1.5 t C/ha per year in the clayey soil in Akola. This shows once again that it is harder to increase SOC in sandy soils because of the greater accessibility by decomposing microbes, due to larger pores. The correlation between carbon inputs added and SOC changes shown in Fig. 13.21 shows the importance of the b factor in the Greenland and Nye equation and its relationship with texture, one of the core soil properties.
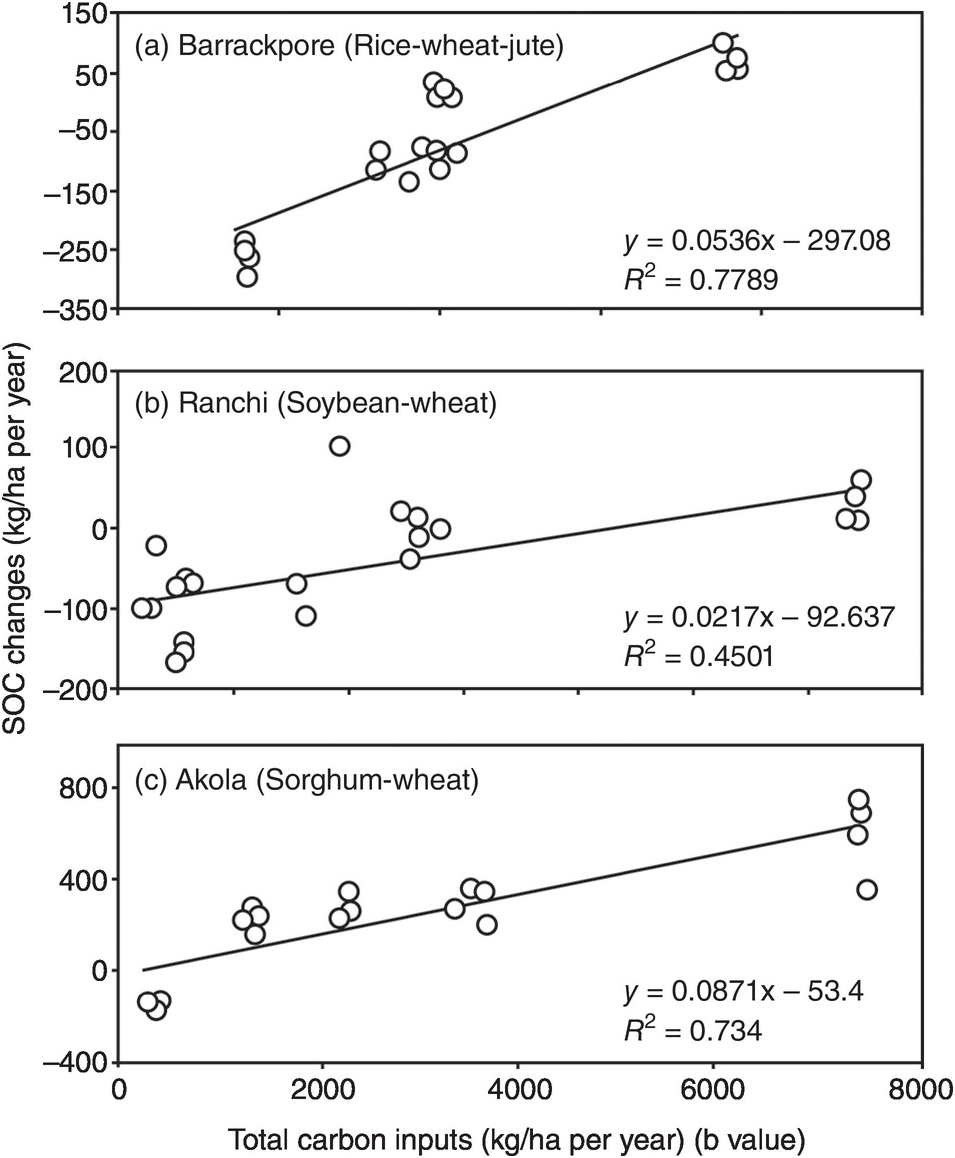
Fig. 13.21 The total above- and below-ground organic carbon inputs (b value) determined whether nitrogen fertilization added or decreased SOC in (a) the top 30 cm of a sandy loam Inceptisol for 29 years, (b) a sandy clay loam Alfisol for 30 years, and (c) a clayey Vertisol for 14 years, in long-term trials in semiarid India (Manna et al. Reference Manna, Swarup, Wanjari, Ravankar, Mishra, Saha, Singh, Sahi and Sarap2005).
Manna et al. (Reference Manna, Swarup, Wanjari, Ravankar, Mishra, Saha, Singh, Sahi and Sarap2005) also found large declines in crop yields and topsoil SOC when fertilization included only nitrogen and phosphorus, but not when NPK fertilizer or NPK fertilizer plus manure were added, indicating the need for potassium and probably micronutrients contained in the manure. It is not reasonable to expect nitrogen fertilizers to increase SOC if the soil is deficient in another element, unless this is corrected.
Changing the Decomposition Rate of Organic Inputs (m) with fertilization
Knorr et al. (Reference Knorr, Frey and Curtis2005) conducted a meta-analysis of 24 published studies across the world that assessed the effects of both nitrogen fertilization and nitrogen atmospheric deposition on above-ground litter decomposition (not SOC decomposition) with rates of fertilization at high or low atmospheric deposition rates. They found that when atmospheric nitrogen deposition was low (0.5 kg N/ha per year), the value of m increased with nitrogen fertilization.
Decreasing the SOC Decomposition Rate (k)
Mineral fertilizer use can also reduce the value of k by keeping a lower soil temperature under a complete soil cover, provided by a vigorously growing crop. A long-term study of tea soils in India, illustrated in Fig. 13.22, shows that higher SON equilibrium levels were obtained when tea was fertilized annually with a 120–25–36 kg/ha rate of nitrogen, phosphorus and potassium. The unfertilized plots kept losing organic nitrogen at an annual rate of 1.5 percent, with correspondingly lower total nitrogen content as equilibrium was approached (Gokhale Reference Gokhale1959). In contrast, the fertilized plots had a decomposition rate of 1.0 percent. Tea is a perennial crop with year-round ground cover, so the effect will be less marked with annual crops that provide a ground cover for only a few months per year.
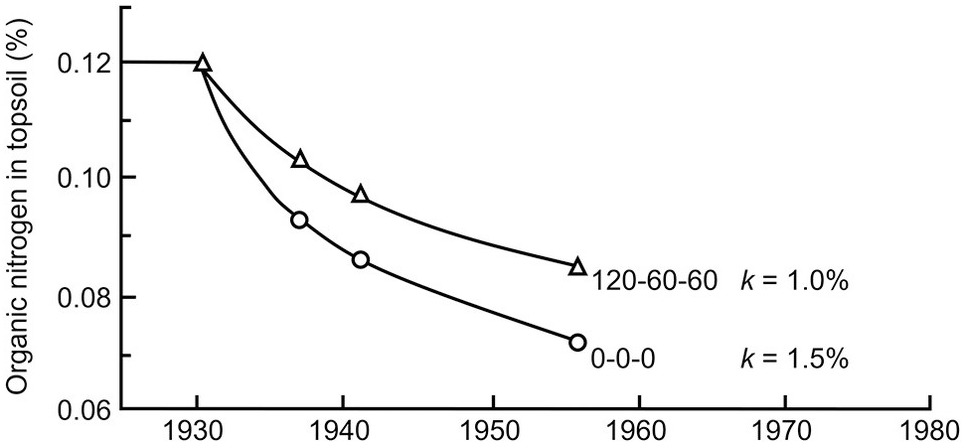
Fig. 13.22 Mineral fertilization increases the equilibrium SOM content (expressed as SON) in a long-term experiment in a tea plantation in Assam, India (Gokhale Reference Gokhale1959). Annual fertilizer rates are equivalent to 120–25–36 kg/ha of nitrogen, phosphorus and potassium.
Overall Effects
In a meta-analysis of 104 African experiments, Chivenge et al. (Reference Chivenge, Vanlauwe and Six2011) reported that topsoil SOC content increased by an average of 17 percent with the addition of plant biomass inputs alone and by 12 percent when plant biomass inputs were combined with nitrogen fertilizer, but there was no change when only nitrogen fertilizers were added. All residues were removed.
Table 13.12 shows some other long-term comparisons in Africa. With two exceptions, one in SOC and the other in SON, nitrogen fertilizers increased topsoil SOC from 10 percent to 40 percent in relative values and by about 10 percent for SON. The common practice of full residue removal may possibly account for the relatively low increases.
Table 13.12 Nitrogen fertilizer applications generally increase topsoil SOC content in long-term trials in West Africa. Adapted from Vanlauwe and Giller (Reference Vanlauwe and Giller2006).
An exceptional case was found in Australia, described in Chapter 11, in very phosphorus-deficient soils where phosphorus fertilizer applications increased topsoil SOC by 150 percent relative to the native pasture (Six et al. Reference Six, Paustian, Elliott and Combrink2000). Certainly, overcoming severe nutrient deficiencies with fertilizers does add more organic inputs to the soil, but how long such an increase lasts depends on whether or not it is reflected in the active SOC pool, where the effect is transient, or in the slow or passive SOC pools, where this added carbon is sequestered.
Pieri (Reference Pieri1992), reviewing the large experimental data from Francophone West Africa, concluded that using only mineral fertilizers increased or maintained SOC content in the Sahel because of the greatly increased carbon inputs to the soil, although the effect is transient in the sandy topsoils. Such increases probably go no further than the active SOC pool, although they do have an important effect in mineralizing nutrients for crop production.
Ladha et al. (Reference Ladha, Reddy, Padre and van Kessel2011) conducted a meta-analysis on the effect of mineral fertilization on topsoil SOC content. The study compared 114 long-term experiments located in 100 sites throughout the world over decadal time scales. Only 11 sites were in the tropics, and about half of those were in flooded rice. Overall, nitrogen fertilizers increased topsoil SOC content by 8 percent over the control. Ladha and co-workers found that SOC increased much more, by 37 percent, when animal manures were the nitrogen source, which makes sense because cattle manures have little lignin and polyphenolic content (Chapter 11). But nitrogen fertilizers can contribute directly when the mineral nitrogen dissolved from them is immobilized, causing the available soluble carbon to be immobilized as well. The Dourado Neto et al. (Reference Dourado Neto, Powlson, Abu Bakar, Bacchi, Basanta, thi Cong, Keerthisinghe, Ismaili, Rahman, Reichardt, Safwar, Sangakkara, Timm, Wang, Zagal and van Kessel2010) data indicated that 18 percent of the nitrogen fertilizer applied remained in the SOM after 5 years (Table 13.11).
Although a modest increase, it is relevant to note that, unlike some popular assertions, mineral fertilizers do not necessarily decrease SOM. The nitrogen contribution of mineral and organic fertilizers may be key to maintain or increase the SOC content in stable agricultural systems. But the real winner is high-quality (Class 5) cattle manure, and the reasons are probably the slow release, as it has all essential nutrients, and perhaps some liming effect due to its calcium and magnesium content. This raises the question as to whether or not cattle manure acts as active SOC because of its slow decomposition rate in the soil, part of which also becomes slow SOC.
The positive effect of nitrogen fertilizers in increasing SOC is more marked under anaerobic conditions (Cassman et al. Reference Cassman, Dobermann, Walters and Yang2003), which will be discussed in Chapter 17.
13.10.2 Denitrification, NH3, NO and N2O Emissions
The leaky pipe concept illustrated in Fig. 13.3 shows that various gaseous losses can occur upon the application of mineral and organic fertilizers. One is NH3 volatilization, which occurs largely with organic manures (see Chapter 11), but also from surface-applied urea in high-pH soils, as described above. NH3 is not a greenhouse gas, but it binds with particulate matter in aerosols, which in fact has the effect of decreasing atmospheric warming.
Denitrification is the microbial reduction of NO3– to N2, which includes the production of N2O and NO as intermediate compounds. The determinants of denitrification are the availability of NO3– (the electron acceptor), labile carbon (the electron donor that provides energy to the microbes), and O2, the competing electron acceptor (Del Grosso et al. Reference Del Grosso, Parton, Mosier, Ojima, Kulmala and Phongpan2000). Biological denitrification is performed by a highly biodiverse, adaptable and widely distributed group of aerobic, heterotrophic bacteria that are also facultative anaerobes (Mosier et al. Reference Mosier, Wassmann, Verchot, King and Palm2004, Coyne Reference Coyne, Schepers and Raun2008, Baggs Reference Baggs2011). The reaction progresses as follows:
Full denitrification is about the only way for Nr to be converted back to its original inert form (N2) by agriculture. Denitrification from the world’s terrestrial ecosystems is expected to reach 98 Tg N by 2050, at a time that the Haber–Bosch process is expected to reach 165 Tg N (Table 13.1). About 80 percent of the nitrogen fixed by the Haber–Bosch process goes into nitrogen fertilizer production (132 Tg N). Therefore, terrestrial denitrification returns back to the atmosphere 72 percent of the N2 that was taken out to produce these fertilizers, bringing an additional consideration to the global nitrogen cycle. Natural systems, particularly wetlands, are obviously responsible for a large proportion of terrestrial denitrification and have nothing to do with fertilized agriculture. The nitrogen cycle starts and ends with N2.
Figure 13.23 shows the relative importance of the emissions of the three gases at different levels of water-filled pore space, a good indication of oxidation–reduction status of the soil. The importance of nitrification increases as pores are better aerated, while the importance of denitrification increases as pores get more waterlogged. Denitrification of inorganic nitrogen can happen simultaneously with nitrification in nearby microsites, where one is under anaerobic conditions and an adjacent microsite is well-aerated. Often, the anaerobic microsites are at the center of microaggregates. Both N2O and NO can be emitted as intermediate products of both nitrification and denitrification. The end product of denitrification (N2) does not have an environmental effect, although it represents a loss of nitrates from the soil.
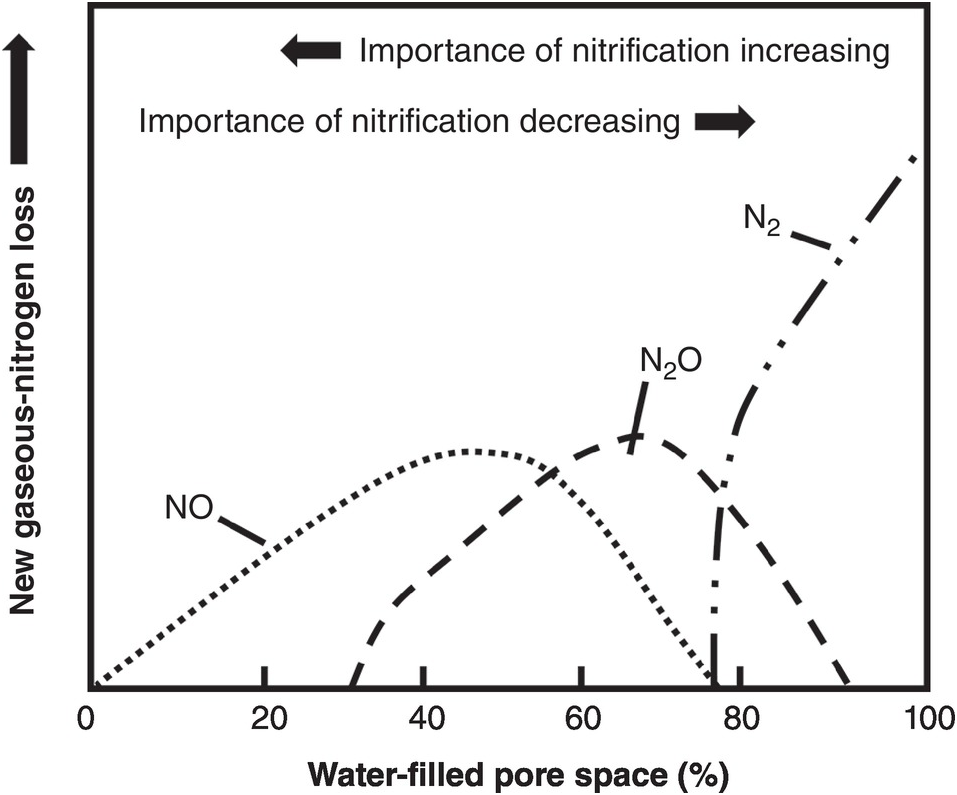
Fig. 13.23 As soil pores get filled with water the distribution of NO, N2O and N2 gas emissions varies.
Field capacity (–10 kPa of soil moisture tension in most tropical soils) often occurs at about 60 percent of the water-filled pore space. Davidson et al. (Reference Davidson, Keller, Erickson, Verchot and Veldkamp2000) indicate that, at this tension, soil micropores are water-filled, which permits microbial activity without water stress, while soil macropores are air-filled, which permits relatively good aeration of the bulk of the soil, providing an equal production of NO and N2O.
DNRA and Anammox
Two additional processes have now been observed in tropical soils: dissimilatory nitrate reduction to ammonium (DNRA) and anaerobic ammonium oxidation (anammox). DNRA is the reversal of nitrification, where NO3– is reduced to NO2– and then to NH4+ in anaerobic environments. Silver et al. (Reference Silver, Herman and Firestone2001) observed this process in udic and perudic clayey Ultisols of Puerto Rican rainforests, in anaerobic microsites also adjacent to aerobic ones, as mentioned before. Silver and co-workers found that the fluxes of DNRA were equal to the opposite nitrification (NH4+ → NO3– ) fluxes in these soils, with the overall effect being a maintainance of more NH4+ in the soil solution and a reduction of leaching losses of NO3–, which is a nitrogen conservation mechanism in the nearly closed nitrogen cycle in tropical forests. How important this process is in udic agricultural systems is yet to be learned. Its importance in ustic and aridic soil moisture regimes is likely to be small.
The second process, anammox converts NH4+ and NO2− into N2 and H2O without producing NO3– (Burgin et al. Reference Burgin, Yang, Hamilton and Silver2011). Burgin and co-workers consider the discovery of this process to have transformed the concept of nitrogen cycling because unlike nitrification–denitrification, anammox provides a pathway for reactive forms of nitrogen to be converted to the unreactive form, N2, just like denitrification. Being an anaerobic process, it must take place in flooded rice soils (Chapter 17), probably aided by the reduction of Fe3+ to Fe2+. Anammox could possibly take place in anaerobic microsites of well-drained soils, but this is yet to be proven (Burgin et al. Reference Burgin, Yang, Hamilton and Silver2011).
DNRA and anammox should be further tested in soils with different core properties, but particularly in soils with different mineralogy, where micro- and macropores vary in soils with variable charge (especially in Oxisols and Andisols) those with permanent. Then we could get a handle on how these two relatively new processes apply to tropical soils.
Nitric Oxide
Nitric oxide is the gas that regulates ozone production (O3) in the troposphere and ozone destruction in the stratosphere. Ozone is the third most powerful greenhouse gas after CO2 and CH4. Although NO is not a greenhouse gas it does affect important atmospheric processes.
Nitrous Oxide
N2O is the fourth most potent greenhouse gas (Davidson Reference Davidson2009), with agriculture accounting for over 70 percent of the global N2O emissions (Matson et al. 1988). Mosier et al. (Reference Mosier, Wassmann, Verchot, King and Palm2004) reported that the current atmospheric N2O concentration is ~ 317 ppbv (parts per billion by volume), an increase from ~ 275 ppbv in 1900, and that the bulk of the increase has been in the past 50 years, coinciding with the large increases in nitrogen fertilization. The highest rates of N2O production occur when nitrogen availability to bacteria exceeds carbon availability. The main sources of N2O are inorganic fertilizers, animal manures and sewage, and, to a lesser extent, patches of animal urine and feces in pastures (Davidson Reference Davidson2009). About 1.7–2.7 percent of nitrogen fertilizer and cattle manures become N2O. The rule of thumb used by the Intergovernmental Panel on Climate Change (IPCC) is that 1 percent of the applied fertilizer nitrogen becomes N2O. The tropical data I have been able to review on nitrogen fertilization has a wider range (0.1–10.7 percent). That in temperate-region agricultural studies is about the same, where 0.1–12 percent of the nitrogen applied is being emitted as N2O from temperate crops, grasslands and fallow fields (Mosier et al. Reference Mosier, Wassmann, Verchot, King and Palm2004), suggesting that there are no major differences between tropical and temperate fertilized agriculture.
Davidson et al. (Reference Davidson, Keller, Erickson, Verchot and Veldkamp2000) summarized data obtained from mature humid forests and pastures in several locations in Latin America, three of which are shown in Table 13.13. Annual emissions of both gases were higher in a fertile Andisol than in infertile Oxisols or Ultisols, and the pastures of different ages at the same location produce higher emissions in the Andisol and lower emissions in the Oxisol/Ultisol sites.
Table 13.13 Annual N2O and NO fluxes from two sites with old-growth forest and pastures, expressed both as gases and as nitrogen. Adapted from Davidson et al. (Reference Davidson, Keller, Erickson, Verchot and Veldkamp2000). Conversion from N to N2O = 3.1; from N to NO = 2.1.
N2O has a long atmospheric lifetime, ~ 120 years, compared with ~ 10 years for CH4 and ~ 5 years for CO2. Also, N2O has 298 times the global warming potential of CO2. Even though the absolute emissions from fertilizer agriculture cover a wide range, 0.1–32 kg N/ha per year (Table 13.13), this translates into 0.3–99.2 kg N2O-N/ha per year, which is equivalent to 0.09–31 t CO2-C/ha per year in terms of global warming potential. Assuming an average emission of 19 t CO2-C/ha per year from soil respiration in the tropics (calculated from Schlesinger and Andrews Reference Schlesinger and Andrews2000), then the range of N2O emissions from the soil is 0.07–163 percent, including the emissions from CO2 from soil respiration. Furthermore, N2O is also involved in depleting the stratosphere of ozone. It’s a nasty molecule.
Cropping systems are different from the more stable forests and pastures in terms of nitrogen inputs. It can be expected that N2O and NO under cropping are usually emitted in three peaks: (1) shortly after the onset of the rains, preceded by a protracted dry period: a Birch effect; (2) after tillage and basal nitrogen fertilizer application; and (3) after topdressing nitrogen fertilizer applications. Let’s look at a few tropical examples.
Dick et al. (Reference Dick, Kaya, Soutoura, Skiba, Smith, Niang and Tabo2008) estimated that the Birch effect increases N2O emissions by 45–80 percent in African soils. In their study of a millet-based system in sandy Alfisols of the Sahel, Dick et al. (Reference Dick, Kaya, Soutoura, Skiba, Smith, Niang and Tabo2008) found that adding 50 kg N/ha as urea released 4.6 kg N2O-N/ha per year, but when the fertilizer was mixed with 8 t/ha of class 6 ruminant manure, N2O emissions were reduced by half (2.5 kg N2O-N/ha per year), perhaps due to immobilization of the fertilizer nitrogen by this low-quality manure.
At the other extreme of productivity and land intensification are the irrigated calcareous clayey alluvial desert soils (Calciorthids) of the Yaqui Valley in Sonora, Mexico, which is one of the world’s highest-yielding wheat areas and a cradle of the Green Revolution (Meisner et al. Reference Meisner, Acevedo, Flores, Sayre, Ortiz-Monasterio, Byerlee and Limon1992). The traditional fertilization practice is to apply 250 kg N/ha, split in two applications, two-thirds incorporated in dry soil 1 month prior to planting and irrigating, and one-third 6 weeks afterwards. Matson et al. (Reference Matson, Naylor and Ortiz-Monasterio1998) reported very high fluxes of N2O and NO with this practice, 8.5 kg N/ha per crop, because of partial denitrification of the applied nitrogen (and probably from the nitrogen mineralized by the Birch effect as well) upon irrigating the dry soil prior to planting. When a lower fertilizer rate, 180 kg N/ha was used but timing reversed, one-third pre-planted and two-thirds incorporated 6 weeks after, the N2O and NO emissions were cut in half (to 4.4 kg N/ha per crop), while yields remained the same and fertilizer recovery by the crop increased from 46 percent with the farmer’s practice to 57 percent. After tax, profits also increased from 12 to 18 percent. Management certainly helped, reducing N2O and NO emissions by half, and increasing fertilizer use efficiency and profits without a yield penalty. However, in this region it is difficult to effectively apply topdressing applications because of a lack of equipment that incorporates nitrogen into the soil (Ivan Ortiz-Monasterio, personal communication, 2013).
In the same fertile Andisol of Costa Rica shown in Table 13.13, Veldkamp et al. (Reference Veldkamp, Keller and Nuñez1998) recorded an annual flux of 22.6 kg N2O-N/ha per year (7.3 kg N/ha per year) in pastures fertilized with 300 kg N/ha per year, a very high and probably unprofitable rate, which resulted in a loss of 2.4 percent of the fertilizer as N2O. An adjacent, unfertilized pasture lost only 2 kg N2O-N/ha per year and a grass–legume pasture lost 4.3 kg N2O-N/ha per year.
In Oxisols of western Kenya, Millar et al. (Reference Millar, Ndufa, Cadisch and Baggs2004) recorded N2O emissions of 4.1 kg N2O-N/ha over 84 days after incorporating class 1 above-ground litter residues from legume fallows of agroforestry systems. They recorded much lower emissions from incorporating class 3 weedy fallows (0.2 kg N2O-N/ha), and noted that the higher the nitrogen content of the organic input the higher the N2O emissions were, as well as the percentage of those that occurred in the range of water-filled pore space that promotes nitrification and subsequently N2O emissions (Fig. 13.23). Most of the emissions took place during the first 4 weeks, which is common with other data, including NO data. Millar and co-workers concluded that such short-lived emissions were probably due to the creation of anaerobic microsites and the increased carbon substrate available for nitrification and denitrification that normally follows the incorporation of biomass. In some cases, they observed a decrease in mineral nitrogen in the soil after residue incorporation, together with lower N2O emissions, which suggests temporary microbial immobilization of nitrate or ammonium ions by the organic inputs, which is also positive in terms of agronomic use efficiency. These emissions were lower than in the natural system of the Brazilian Oxisol in Table 13.13.
No differences in N2O emissions were observed between conventional and organic agriculture with similar yield levels in a worldwide review by Cassman et al. (Reference Cassman, Dobermann, Walters and Yang2003). Nitrogen fixation per se does not produce NO and N2O emissions, but when the nitrogen-rich residues are incorporated into the soil and converted into NO3– they do.
From these few data points, some tentative conclusions can be made. Mosier et al. (Reference Mosier, Wassmann, Verchot, King and Palm2004) indicated there is high spatial and temporal variability in these studies everywhere. Emissions of both gases are substantial in the tropics and depend on many factors such as the nitrogen content of the soil, the rates of nitrogen fertilizer application, labile carbon substrate and soil moisture regime. Emissions are higher in the udic examples from Costa Rica, Puerto Rico and Kenya than in the ustic examples from Paragominas, Brazil; and they are lowest in the ustic, semiarid Sahel, and the highest in irrigated Aridisols of Mexico.
The Three Core Soil Properties
The three core soil properties, texture, mineralogy and SOM, also affect the balance between NO, N2O and N2 emissions. Texture affects the percentage of water-filled pores under the same soil water content, being higher in clayey than in sandy soils. Mineralogy is another determinant. As indicated in Chapter 6, clayey soils with permanent- and variable-charge mineralogy have a different soil water retention pattern, with oxidic clayey soils acting more like sands at low soil moisture tensions, holding less water in their macropores than permanent-charge clayey soils. This is why clayey Oxisols can often be tilled shortly after a heavy rain, while it takes days for clayey Vertisols to lose enough water to be able to till them without making a muddy mess. The water held in the micropores of either soil, however, is likely to be the same.
Mosier and Delgado (Reference Mosier and Delgado1997) confirmed this assertion when they found that N2O emissions from fertilized pastures in Puerto Rico represented 0.8 percent of the nitrogen fertilizer applied in Oxisols and Ultisols (both with clayey oxidic mineralogies), and four times as much (3.3 percent) in a Vertisol with permanent-charge mineralogy, using the same nitrogen fertilizer rate. I am familiar with Puerto Rican soils, so I can attest to their mineralogy. The macropores in the clayey Vertisol hold more water, promoting a lower redox potential that is more favorable to N2O (and probably also denitrification to N2) than the clayey oxidic soils. Since the Oxisols of Paragominas are very phosphorus-deficient, this may also contribute to the lower emissions, if it limits microbial activity.
The contents of active SOC or of metabolic carbon derived from the decomposition of high-quality organic inputs will determine the energy required for the bacteria to reduce NO3–. Sandy soils have lower SOM content than clayey soils, and the SOM content in Oxisols and Mollisols is similar. Therefore, one can hypothesize a sequence where sandy soils will tend to produce more NO, while clayey oxidic soils may produce NO and N2O, and clayey smectitic soils will produce more N2O and N2 under similar soil water contents. However, this relationship will probably not hold in waterlogged soils, which already have low redox potentials.
Denitrification is difficult to measure, so attempts have been made to develop N2O:N2 ratios that can be used to estimate N2. Such ratios are highly variable, but are higher in acid soils where N2O production can be 16 times that of N2 at pH 4.2, about equal at pH 6, and at pH > 7.2, N2 is produced much more than N2O, according to a review by Rochester (Reference Rochester2003). This review unfortunately did not include oxidic soils.
Therefore, the main management focus is on (1) using the more conservative nitrogen application rates of the LRP model (Fig. 13.14); (2) managing the timing of nitrogen application; and, if possible, (3) managing the timing of irrigation in ways that avoid excessive NO and N2O production. When denitrification goes all the way to N2 there is no damage to the environment. Much more research must be done in the tropics on this important issue, including the roles of texture, mineralogy and the quality of organic inputs.
13.10.3 Leaching to Groundwater
The magnitude of leaching losses depends on texture and hydraulic conductivity, the stage of crop growth, the nitrogen application rates and anion exchange capacity, all of which determine the amount of NO3– that can be leached below the soil during high-rainfall periods. Temporary immobilization of applied nitrogen also helps to retard leaching. Incorporating urea with low-quality (class 3) maize stover has delayed leaching losses in a lysimeter experiment. Vanlauwe et al. (Reference Vanlauwe, Diels, Aihou, Iwuafor, Lyasse, Sanginga, Merckx, Vanlauwe, Diels, Sanginga and Merckx2002) attributed this to immobilization by the maize stover, but when this organic input was applied as mulch on the soil surface before urea application, no retardation of leaching happened.
The main point (again) is to avoid excessive nitrogen application rates by using the LRP model to determine the appropriate application rate. This is the case regardless of whether the nitrogen comes from organic or mineral fertilizers because no differences in leaching losses have been found between organic or conventional farms, aiming at a similar crop yield level (Cassman et al. Reference Cassman, Dobermann, Walters and Yang2003). The leaching losses of NO3–, NH4+ and DON can cause eutrophication if they reach estuaries in large amounts. About 15–30 percent of nitrogen from NO3– leached from farmland is denitrified in estuaries; the rest goes to the sea (Matson et al. Reference Matson, Naylor and Ortiz-Monasterio1998; Pamela Matson, personal communication, 2013).
Looking at inorganic nitrogen leaching at the watershed scale instead of at the field scale makes eminent sense, and some work has been done in tropical rainforest watersheds (Groffman et al. Reference Groffman, McDowell, Myers and Merriam2001, McDowell et al. Reference McDowell, Bowden and Asbury1992). The use of vegetative filter strips, such as a riparian forest to take up NO3– or NH4+ ions, or a wetland to denitrify them, may “mop up” excess nitrogen in the landscape before entering water bodies.
13.11 Efficiency of Nitrogen Fertilization
There are several ways to assess the efficiency of nitrogen fertilization, and consideration is needed of both the agronomic importance of fertilizers and the environmental consequences.
13.11.1 Nitrogen Use Efficiency
The simplest evaluation of fertilizer nitrogen efficiency is nitrogen use efficiency (NUE), commonly referred to as partial factor productivity (Ladha et al. Reference Ladha, Pathak, Krupnik, Six and van Kessel2005). NUE is the ratio of yield over fertilizer applied:
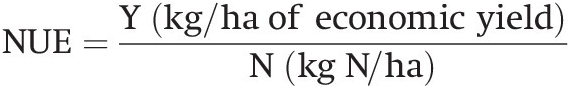 (13.15)
NUE is an empirical value where the denominator N includes the nitrogen released by SOM mineralization, biological nitrogen fixation and atmospheric deposition, as well as nitrogen from fertilizer, but usually only the latter is considered.
NUE values can be misleading because the ratio of yield to nitrogen does not tell us about the actual quantities of nitrogen and yield we are dealing with. It may imply to some that we are using fertilizers less efficiently, but that is not always true. NUE values are highest at low rates of applied nitrogen. Pre-Green Revolution world cereal NUE values averaged 0.75 in 1960 (when cereal yields and nitrogen rates were both low), and decreased to about 0.22 in 1998 (Tilman et al. Reference Tilman, Cassman, Matson, Naylor and Polasky2002). Nitrogen response curves are curves with decreasing yield increases per unit of fertilizer added until they flatten out (see the right-hand graph of Fig. 13.14). They tell us there is “more bang for the buck” in the more linear portion of the response curve, which is another reason why I prefer the LRP model (the left-hand graph).
NUE values in the linear part of the LRP model are similar but not the same because the control with no fertilizer already produced a yield which represents the nitrogen input of SOM mineralization, biological nitrogen fixation and atmospheric deposition. Nevertheless, if the potato farmer chooses to apply only 30 kg N/ha she (as most tropical farmers are) will get a yield of 12 t/ha with an NUE of 0.40 tons of potatoes per kilogram of nitrogen fertilizer added (see Fig. 13.14). If she chooses to apply the recommended rate by the LRP model (75 kg N/ha) she will get 18.5 t/ha of potatoes with an NUE of 0.25. If, overriding my recommendation, she chooses the point in the quadratic model where marginal revenue equals marginal cost, the yield will be 19 t/ha and the nitrogen rate 160 kg N/ha, giving her an NUE of 0.19. Obviously, I would apply the 75 kg N/ha rate even though the NUE is not the highest. Therefore, NUE is not recommended as a useful metric.
Cassman et al. (Reference Cassman, Dobermann, Walters and Yang2003) disaggregated NUE into three more useful parameters: agronomic efficiency, fertilizer recovery and physiological efficiency.
13.11.2 Agronomic Efficiency
Agronomic efficiency (AEN) differs from NUE because it deals with yield response produced by the nitrogen fertilizer only, while NUE includes the total grain produced regardless of the origin of the nitrogen. Therefore:
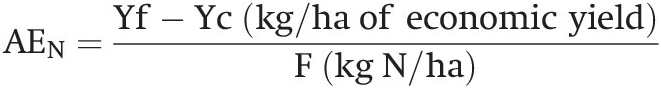 (13.16)
where Yf is the yield with fertilizer, Yc the yield of the control plot and F is the fertilizer nitrogen applied.
The terms NUE and AEN are frequently used synonymously in the literature. Also, the definitions of NUE and AEN varied in two major review articles (Cassman et al. Reference Cassman, Dobermann, Walters and Yang2003, Ladha et al. Reference Ladha, Pathak, Krupnik, Six and van Kessel2005). NUE is often used without an actual definition and, as mentioned before, it can be misleading.
The AEN value is also related to value in terms of cost:benefit ratios, an important economic indicator of fertilizer profitability. In economic terms, AEN is the partial factor productivity of nitrogen fertilization.
AEN values for cereals globally average 37 kg grain/kg N (Cassman et al. Reference Cassman, Dobermann, Walters and Yang2003). However, in Malawi, which uses one subsidized blanket fertilizer rate recommendation for the whole country, an estimate of 12 kg grain/kg N was obtained (Denning et al. Reference Denning, Kabambe, Sanchez, Malik, Flor, Harawa, Nkhoma, Zamba, Banda, Magombo, Keating, Wangila and Sachs2009), and Chisanga (Reference Chisanga2008) reported a value of 14 kg grain/kg N. These AEN values are not purely due to nitrogen in this case because the Malawi subsidy included phosphorus and sulfur in the basal fertilizer plus improved maize seed.
Higher AEN values occur on the linear part of the response curve, while values are lower when nitrogen rates are excessively high, for instance in recently cultivated soils with high SOM mineralization where there is no nitrogen response (AEN = 0), or when high nitrogen rates are applied as organic inputs, which illogically is not counted as fertilizer in most agronomic efficiency studies.
Chivenge et al. (Reference Chivenge, Vanlauwe and Six2011) calculated AEN values more broadly in a meta-analysis comparing organic and mineral fertilizer inputs, so the terms Yf and F in the above equation could be the nitrogen fertilizer applied alone, the organic nitrogen input applied alone, or the total nitrogen applied by the combination of both. All values were within the range normally found in Africa. The mean AEN for organic nitrogen alone was 13 ± 3 kg/kg N and the combined values 14 ± 2 kg/kg N, both much below that of nitrogen fertilizers alone, 23 ± 4 kg/kg N as previously indicated. So, nitrogen fertilizers in this meta-analysis were almost twice as efficient as organic nitrogen fertilizers. There were, however, large differences in AEN values between organic quality classes and soil texture, shown in Table 13.14.
Table 13.14 AEN values of organic biomass combined with nitrogen fertilizer varied with quality, but was higher in clayey topsoils than in sandy topsoils in a meta-analysis of African sites. Calculated from a graph by Chivenge et al. (Reference Chivenge, Vanlauwe and Six2011). Mean ± 95 percent confidence interval.
| Organic quality class (Table 13.10) | Sandy | Loamy | Clayey | All textures |
|---|---|---|---|---|
| AEN (kg maize yield increase/kg N applied as mineral or organic fertilizer) | ||||
| Class 1: high + mineral fertilizer | 12 ± 2 | 7 ± 2 | 21 ± 3 | 13 ± 2 |
| Class 2: intermediate + mineral fertilizer | 6 ± 2 | 5 ± 2 | 22 ± 5 | 14 ± 3 |
| Class 3: intermediate + mineral fertilizer | 12 ± 3 | 12 ± 3 | 19 ± 3 | 15 ± 4 |
| Class 4: low+ mineral fertilizer | 4 ± 4 | 4 ± 5 | 12 ± 4 | 6 ± 3 |
| Mean | 10 ± 2 | 8 ± 2 | 21 ± 3 | 13 ± 2 |
In maize-growing areas in the United States, the AEN value has increased from 42 kg/kg N in 1980 to 57 kg/kg N in 2000, which, according to the Cassman et al. (Reference Cassman, Dobermann, Walters and Yang2003) review, was due to improved stress tolerance of new cultivars, higher plant densities, conservation tillage, improved genetically modified germplasm and better nitrogen management. They also cite that rice AEN values increased from 57 kg/kg N to 75 kg/kg N between 1961 and 1985 in Japan. These increases are easy to understand and represent the trend of more grain for less fertilizer. They represent a different picture, with basically the same US data, than that produced from NUE values, as reviewed by Tilman et al. (Reference Tilman, Cassman, Matson, Naylor and Polasky2002) and others.
Can something like this be achieved in the tropics? Certainly, this is no problem in highly mechanized, modern tropical agriculture with precision farming, which mimics much of what the United States does. But what about the smallholder farmer?
Vanlauwe et al. (Reference Vanlauwe, Kihara, Chivenge, Pypers, Coe and Six2011) did a meta-analysis of 90 smallholder farm experiments with maize in Africa and obtained the AEN ranges shown in Table 13.15. Fertilizer nitrogen in researcher-led trials was slightly more efficient than farmer-led trials. When hybrids were incorporated into the researcher-led trials, AEN values increased further, but additional organic inputs did not have much effect. Standard deviations were all high. Upper-quartile AEN values with hybrids and full integrated soil fertility management (ISFM) were within the range of the temperate literature, indicating that, with good management, efficiencies can be comparable to the temperate region.
Table 13.15 AEN values in African smallholder maize trials (721 data points) varied with management, but some treatments reached temperate-region levels. Adapted from Vanlauwe et al. (Reference Vanlauwe, Kihara, Chivenge, Pypers, Coe and Six2011).
| Management | Mean | Standard deviation | Upper quartile | Lower quartile |
|---|---|---|---|---|
| AEN (kg grain/kg N [ inorganic or organic] applied) | ||||
| Farmer-led | 19 | 15 | 20 | 11 |
| Researcher-led | 23 | 19 | 30 | 9 |
| Researcher-led + hybrids | 34 | 23 | 52 | 13 |
| Researcher-led + hybrids + organic inputs (ISFM) | 32 | 29 | 46 | 12 |
Vanlauwe et al. (Reference Vanlauwe, Kihara, Chivenge, Pypers, Coe and Six2011) also observed the following:
Hybrid maize (AEN = 26) was superior to open-pollinated varieties (AEN = 17).
Mixing fertilizer and two types of organic resources (classes 2 and 5) substantially increased AEN values.
Infields (those close to the homestead) had values (AEN = 31) almost double those of outfields (AEN = 17). Infields receive more organic waste and ash and act like responsive soils, while outfields resemble the less responsive soils.
Another significant development has taken place across tropical Asia and China using a technique called site-specific management in rice. Dobermann et al. (Reference Dobermann, Wit, Dawe, Abdulrachman, Gines, Nagarajan, Satawathananont, Son, Tan, Wang, Chien, Thoa, Phung, Stalin, Muthukrishnan, Ravi, Babu, Chatuporn, Sookthongsa, Sun, Fu, Simbahan and Adviento2002) were able to increase AEN values from 11 kg/kg N to 16 kg/kg N, using a lower fertilizer rate, in 179 sites in eight key irrigated rice domains. This involved a large extension effort in the Philippines, China, India, Thailand, Indonesia and Vietnam. It is interesting to note that these field AEN values are lower than those obtained by farmer-managed maize in Africa (shown in Tables 13.14 and 13.15), and a fraction of what Japan obtains with rice.
Pixley and Banziger (2001, cited in Vanlauwe et al. Reference Vanlauwe, Kihara, Chivenge, Pypers, Coe and Six2011) found that replanting maize seed resulted in a yield loss of 32 percent for hybrids, but only 5 percent for open-pollinated varieties (OPVs). The advantages of hybrids are well understood by smallholder farmers. In the Malawi fertilizer and seed subsidy program, farmers were given a choice between 2 kg of hybrid seed or 3 kg of improved OPVs. About 76 percent of them chose the hybrid seeds even though they were aware that they should not replant them (Denning et al. Reference Denning, Kabambe, Sanchez, Malik, Flor, Harawa, Nkhoma, Zamba, Banda, Magombo, Keating, Wangila and Sachs2009).
What is becoming clear is that nitrogen fertilizer has no chance of being efficient unless hybrids or improved varieties are used, and in many instances organic inputs need to be added. With such management, AEN values in smallholder tropical situations can approximate those obtained in large-scale mechanized farming in North America and Europe or, who knows, even higher.
13.11.3 Fertilizer Recovery
The most popular way to express the efficiency of nitrogen fertilization is using the fertilizer recovery (REN), expressed as a percentage. By knowing the nitrogen uptake at a certain rate and the uptake without added nitrogen, the percentage recovery can be calculated as follows:
 (13.17)
where Uf is the nitrogen uptake of the whole above-ground plant biomass with the fertilizer rate F, and Uc is the nitrogen uptake of the whole above-ground plant in the control plot.
REN values are usually determined from research-station data, with or without the use of 15N. Without isotopes, it is often termed the “N-difference method” or “apparent fertilizer recovery,” and it is the most commonly reported method. Recovery values are about 7–11 percent higher with the N-difference method than with the 15N isotope dilution method, which is obviously more accurate (Ladha et al. Reference Ladha, Pathak, Krupnik, Six and van Kessel2005). Fertilizer recovery is sometimes calculated by the nitrogen uptake in the grain, which does not make sense because the nitrogen in other plant parts is needed to produce that grain.
REN values in rice, maize and wheat range from 20 percent to 90 percent for the first crop, with 1–7 percent recovery in subsequent crops (Ladha et al. Reference Ladha, Pathak, Krupnik, Six and van Kessel2005). This lack of a significant residual effect is shown also with 15N labeling in the seminal study by Dourado Neto et al. (Reference Dourado Neto, Powlson, Abu Bakar, Bacchi, Basanta, thi Cong, Keerthisinghe, Ismaili, Rahman, Reichardt, Safwar, Sangakkara, Timm, Wang, Zagal and van Kessel2010), presented in Table 13.11.
The range in REN values for cereals in developed countries quoted by Ladha et al. is 50–55 percent, while in developing countries the estimate is 20–30 percent for rainfed cereals and 30–40 percent for irrigated cereals. More than 40 years ago, Jones (Reference Jones1973) obtained a recovery of 70 percent for maize in an Alfisol of Samaru, northern Nigeria, under rainfed conditions and no leaching. So, it can be done in the tropics.
But is the unrecovered fertilizer (100 – REN) lost? Obviously not, since much of it is immobilized into SOM. Only a portion of the applied nitrogen fertilizer is really lost by the two main mechanisms we know, which are leaching to groundwater and gas emissions of NO, N2O via denitrification to the atmosphere. A third possible mechanism is runoff and erosion from the soil surface after a broadcast nitrogen application.
The unrecovered nitrogen or “missing nitrogen,” therefore, includes both storage and loss mechanisms. Groffman (Reference Groffman, Schepers and Raun2008) raises the question of whether or not nitrogen sequestered in SOM could reach nitrogen saturation just like sequestered carbon can reach carbon saturation levels (Chapter 11). Groffman also pointed out that relatively little is quantitatively known about SOM storage; given that the C:N ratio of slow SOM is pretty stable, you can’t be sequestering more nitrogen if you are not sequestering more carbon.
The Dourado Neto et al. (Reference Dourado Neto, Powlson, Abu Bakar, Bacchi, Basanta, thi Cong, Keerthisinghe, Ismaili, Rahman, Reichardt, Safwar, Sangakkara, Timm, Wang, Zagal and van Kessel2010) data shown in Table 13.11 indicate that 42 percent of added 15N fertilizer was stored in SOM during the first crop. Part of this newly immobilized SOM was mineralized during the five subsequent crops, with that stored in SOM going down to 18 percent. The percent immobilized from the 15N crop residues was higher, 62 percent, decreasing to 40 percent in five years.
I believe this positive effect should be considered in the efficiency of fertilizer nitrogen utilization, and I propose a new term:
where RSN is the percent of fertilizer nitrogen immobilized in SOM, REN is the same percent recovery of fertilizer N in the plant, and RESN is the percent recovery in the crop plus that stored in the soil (this needs a better name!). Then the losses LN will be calculated as the difference:
If both leaching (LL) and gaseous losses (LNO, LN2O and LN2) are measured or estimated at the same site, then
13.11.4 Physiological Efficiency
The third parameter, physiological efficiency (PEN), reflects the crop cultivar’s internal efficiency and capacity to produce high grain:straw ratios, as in the Green Revolution varieties. It may also reflect a larger or deeper root system that captures more mineral nitrogen in the soil or that better tolerates adverse factors such as drought, acidity or low available phosphorus. Breeding research is underway on these aspects together with increasing yield potential. This may result in the next big jump in yields since the Green Revolution. The formula, with all parameters defined earlier, is:
 (13.21)
PEN values range from 29 kg to 53 kg of grain increase per kg N taken up (Ladha et al. Reference Ladha, Pathak, Krupnik, Six and van Kessel2005).
Jain and Kumar (Reference Jain and Kumar2011) edited a book reviewing molecular approaches to improve nitrogen use efficiency, such as post-translational regulation of nitrate reductase, nitrate sensing and signaling, and other aspects related to PEN. This is frontier stuff and may pay off well in the future.
13.12 Profitability
Using October 2012 world prices for maize grain (US $200/t or $0.20/kg or $8/bushel) and urea (US $350/t N or $0.76/kg N or $0.30/lb N), the following gross revenues could be achieved under a wide range of agronomic efficiencies. Profitability is often indicated by value:cost ratios higher than 2 (Morris et al. Reference Morris, Kelley, Kopicki and Byerlee2007). The value is the income generated by the extra harvest (Vf) minus Vc (the control) in response to fertilizers and seed inputs. Cost (C) is what was spent in fertilizers and seed at unsubsidized (market) prices.
 (13.22)
Table 13.16 shows calculations based on data reported previously. Profitability increases with AEN. Note that V:C ratios are 10 in China (Xiping Chen, personal communication, 2013) because fertilizers are cheap.
Table 13.16 Value:cost ratios, an estimate of profitability, increase as the AEN values increase in maize, both in tropical and temperate regions. October 2012 world prices.
| Metric | AEN (kg grain/kg N) | ||||||
|---|---|---|---|---|---|---|---|
| 14 (Malawi subsidy program)a | 17 (Local variety)b | 26 (Hybrid maize)b | 32 (Full ISFM mean)b | 37 (Global cereal average)c | 46 (Full ISFM upper quartile)c | 57 (US maize mean in 2000)c | |
| Value of maize (US $/kg grain) | 2.80 | 3.40 | 5.20 | 6.40 | 7.40 | 9.60 | 11.40 |
| Cost of urea (US $/kg N) | 0.76 | 0.76 | 0.76 | 0.76 | 0.76 | 0.76 | 0.76 |
| Gross revenue (US $/kg N) | 2.04 | 2.64 | 4.44 | 5.64 | 6.64 | 8.84 | 10.64 |
| Value:cost ratio | 3.7 | 4.5 | 6.8 | 8.4 | 9.7 | 12.6 | 15.0 |
a Chisanga (Reference Chisanga2008).
b Vanlauwe et al. (Reference Vanlauwe, Kihara, Chivenge, Pypers, Coe and Six2011).
c Cassman et al. (Reference Cassman, Dobermann, Walters and Yang2003).
Nziguheba et al. (Reference Nziguheba, Palm, Berhe, Denning, Dicko, Diouf, Diru, Flor, Frimpong, Harawa, Kaya, Manumbu, McArthur, Mutuo, Ndiaye, Niang, Nkhoma, Nyadzi, Sachs, Sullivan, Teklu, Tobe and Sanchez2010) reported the results of eight African Millennium Villages over three consecutive years, each with grain yields measured in the fields of 30 randomly chosen households. Both nitrogen and phosphorus fertilizers were used for maize, with DAP at planting and urea for topdressing, both at recommended rates that averaged 84 kg N/ha and 19 kg P/ha in the five villages that grew maize (Sauri, western Kenya; Bonsaaso, southern Ghana; Mwandama, southern Malawi; Pampaida, northern Nigeria; and Mbola, central Tanzania). Value:cost ratios exceeded 2 (ranging from 2.3 to 9.0) in all but two of 16 maize harvests, as well as with teff in Koraro, northern Ethiopia (V:C ranging from 3.1 to 8.2), but were below 2 with millet and peanuts in Tiby, Mali and Potou, Senegal, where traditional varieties were used in semiarid conditions. Unlike most other data, these measurements were obtained in actual smallholder farmer fields.
Under such conditions, the timing of when the grain is sold is critical. Crop prices at harvest time are low and increase rapidly, peaking at 45–100 percent higher, 6–9 months later. The data reported reflect those peak prices because farmers individually or collectively store the surplus grain they intended to sell. Those who were desperate to sell in order to buy essentials such as soap lost most of their profitability, with value:cost ratios lower than 2 in nine out of 16 maize harvests (Nziguheba et al. Reference Nziguheba, Palm, Berhe, Denning, Dicko, Diouf, Diru, Flor, Frimpong, Harawa, Kaya, Manumbu, McArthur, Mutuo, Ndiaye, Niang, Nkhoma, Nyadzi, Sachs, Sullivan, Teklu, Tobe and Sanchez2010). This is a common situation with smallholder African farmers, so in order to profit from their investments in fertilizers and seed they must wait for the peak prices and store the grain properly.
There was huge volatility in both fertilizers and grain prices during the 3 years of cultivation, which included 2008, the year when prices peaked all over the world. The price of DAP in Mbola, central Tanzania varied by almost 600 percent, urea by 248 percent. Thankfully, maize grain prices doubled, maintaining high value:cost ratios (Table 13.17). It is noteworthy just how much higher these prices are compared to the world market prices of maize (US $200/t) and urea (US $350/t in October 2012). Fertilizers are a global commodity; the fact that urea costs 37–274 percent more in Africa than the global price reflects the added transaction costs in port clearing and transport (including bribes).
Table 13.17 Volatility of fertilizers and maize prices in Mbola, Tabora Region, Tanzania over three seasons. Maize is planted around November–December and harvested the following April–May. Peak prices occur 6–9 months after harvest. Nziguheba et al. (Reference Nziguheba, Palm, Berhe, Denning, Dicko, Diouf, Diru, Flor, Frimpong, Harawa, Kaya, Manumbu, McArthur, Mutuo, Ndiaye, Niang, Nkhoma, Nyadzi, Sachs, Sullivan, Teklu, Tobe and Sanchez2010) and unpublished data.
Nitrogen fertilizers are expensive, but they are very profitable, even at low AEN levels. Many people, however, claim that smallholder farmers cannot afford fertilizers. What they mean is that they cannot afford to buy fertilizers with cash. Neither do farmers in rich countries; they include fertilizers in their crop loans to be paid after harvest. What is needed is a credit system for smallholder farmers who have little or no collateral, and a warehouse receipt system for storage and cash forwarding. Progress is being made in many tropical countries, with innovative finance mechanisms such as credit guarantees to banks, and smart cards, also called electronic wallets. Such cards, deployed to millions of Nigerian farmers, have the thumbprint and photo of the farmer and a chip that she can insert in an ATM machine to pay back a loan, or to access subsidized credit for seeds and fertilizer, bypassing the often corrupt dealers.
13.13 Summary and Conclusions
The Nitrogen Cycle
Nitrogen is not only the most commonly deficient nutrient in soils for plant growth, but one of the most dynamic. We face the paradox that while 78 percent of our air is inert nitrogen (N2), most of our crops, many of our natural systems and many soil microorganisms suffer from lack of nitrogen. The nitrogen cycle cascades and has a “leaky pipe” whereby losses can happen in many parts of the cycle.
There is a disconnect between microbes and higher plants; soil bacteria live at almost nitrogen-starvation levels because they have a higher demand for nitrogen relative to carbon due to their narrow C:N ratios – about 4 in bacteria, in contrast with plants, which have C:N ratios of 15–25.
The negative environmental and public health consequences of reactive nitrogen (Nr) creation are groundwater contamination; eutrophication of waterways and coastal areas, inducing hypoxia and “dead zones”; photochemical smog; fine-particulate aerosols; stratospheric ozone depletion; acid rain; toxic algal blooms; global warming; nitrate toxicity in water; and some respiratory diseases, caused by aerosols. The consequences can be grouped into “too much nitrogen” or “too little nitrogen” in agriculture, depending on the overall Nr balance. The problems manifested are totally different, and both take place in the tropics.
The four main kinds of nitrogen inputs that feed the mineral nitrogen pool are atmospheric deposition, biological nitrogen fixation, mineral fertilizers and organic nitrogen mineralization.
Atmospheric deposition is caused by the emission of reactive nitrogen gases such as NOx and NH3, plus nitrogen oxides produced by lightning. The tropical hotspots are mostly around urban and industrial areas where atmospheric deposition can reach high levels, 10–60 kg N/ha per year.
Biological Nitrogen Fixation
Biological nitrogen fixation remained the largest way of converting N2 into Nr until the discovery of the Haber–Bosch process in the early 1900s. Estimates in the early 1900s were 139 Tg N fixed per year via biological nitrogen fixation, of which 107 Tg were fixed in natural systems and 32 Tg in agricultural ones. In contrast, the Haber–Bosh process was estimated to fix about 90 Tg N year in 2000, becoming the main Nr source in agricultural systems.
The N2 molecule is transformed into Nr by the nitrogenase enzyme in bacteria. The main symbiosis is between Rhizobium bacteria and leguminous plants. Others include cyanobacteria, Frankia in symbiosis with a few gymnosperms and angiosperms in the tropics, free-living nitrogen-fixers in the soil solution of the rhizosphere, and entophytic nitrogen-fixing bacteria, loosely associated inside some crops.
Commercial inoculum is produced in many tropical countries for smallholder farmers. The basic method is to add pure cultures of the desired rhizobial strain to peat, which serves as the carrier and also prevents desiccation of the bacteria. Small quantities of phosphate rock, lime and molybdenum are often added.
The quantities of nitrogen fixed by different crops in symbiosis with rhizobia are related to how big the plants are and how long they live. Grain legumes, being the earliest maturing group, usually fix around 60–100 kg N/ha per crop. But these legumes are greedy, and put most of the nitrogen they take up in the seed. In general, green manures grown for 6 months fix nitrogen in that same range. Lastly, trees and shrubs growing for 6 months to 2 years fix much larger quantities of nitrogen, some species reaching over 1000 kg N/ha in 2 years.
What is somewhat less variable is the proportion of a plant’s nitrogen uptake coming from nitrogen fixation, which ranges from 30 percent to 90 percent. Given the high energy requirements of nitrogen fixation, legumes prefer to take the easy way out if inorganic nitrogen sources are available because they require much less energy to take up. When the soil has high levels of mineral nitrogen, the nitrogen-fixing mechanism often shuts down.
It is commonly assumed that nitrogen fixed via biological nitrogen fixation can be used by the next crop or by a cereal intercropped with the legume, thus “increasing soil fertility.” Such generalization falls apart with data, although there are still important contributions.
Assuming all crop residues are returned to the soil and all grain is removed, the contribution of grain legumes ranges from negative (–11 to –37 kg N/ha per crop) to a positive values (10 to 136 kg N/ha per crop). Negative values occur when the grain legumes remove more nitrogen from the soil than they fix, a fact that is not commonly realized. The positive values indicate the actual contribution to nitrogen fertility, the highest values being found for the promiscuous soybean, cowpea, peanuts and pigeon pea. The contribution of pasture legumes and nitrogen-fixing trees can be much higher, but this depends on their population in the agricultural system.
When grain legumes are intercropped with a cereal, there is no immediate benefit to the cereal crop because there is little decomposition of the roots from growing legumes.
Mineral Fertilizers
The third and the largest source of Nr inputs to agriculture is the mineral fertilizers developed by the Haber–Bosch industrial process of ammonia synthesis, considered “the world’s greatest fix” because it supplied about 40 percent of the world’s dietary protein in the mid 1990s. Nitrogen-fertilizer-free practices would feed only one-third of the world population of 9.5 billion people by the year 2050, with the remaining two-thirds being supplied by mineral fertilizers.
Fertilizer use has driven the global change in the nitrogen cycle. No truly new fertilizer for agricultural use has been developed and marketed in the last 50 years.
The amounts of fertilizer applied per hectare ranges between those that apply too much (China, Netherlands, Vietnam, Japan, UK, France), those applying reasonable amounts (Brazil, United States, India, South Africa) and those that apply too little, mostly African countries.
Nitrogen fertilizer management practices depend on many factors. Some are specific to the fertilizer, such as source, rate, timing and placement of the application. Others depend on germplasm, soil and climate conditions, as well as the agronomic management. The bulk of the evidence indicates few differences in ammonium sources when properly applied. Nitrate sources are usually inferior to ammonium sources under conditions favoring leaching or denitrification.
The main impact of the Green Revolution of the 1960s–1980s was to drastically change the plant type, so varieties would put more nitrogen in the grain when nitrogen fertilizers are applied. Most traditional varieties responded to nitrogen fertilization by producing more leaf and lodging, losing yield, while the new ones increased grain yields drastically by remaining short-statured and erect.
There are numerous ways to determine the correct nitrogen rate. I recommend the Linear Response and Plateau (LRP) model over quadratic or other curvilinear models. Due to the danger of leaching when there is not a crop root system to take up nitrogen, normally only one-third of the N rate is applied at planting and the rest at topdressing time.
Organic Nitrogen Mineralization
The fourth source of inorganic nitrogen to plants is organic nitrogen mineralization. It is a consequence of the previous three, because soil organic nitrogen (SON) had to form from the other sources that generated Nr.
A key dynamic is nitrogen mineralization versus immobilization, the opposite reaction that converts inorganic nitrogen back into organic nitrogen. Immobilization happens primarily in the active SON pool, initially in the microbial biomass fraction of that pool. Nitrogen fertilizers can also be immobilized by microbes and then subsequently mineralized.
Nitrogen Fertilizer Reactions in Soils
Urea hydrolysis. When applied to a moist soil, urea is hydrolyzed into ammonium carbonate by the enzyme urease. Ammonium carbonate in the presence of water dissociates into the ammonium (NH4+) and carbonate (CO32–) ions. Before hydrolysis, urea is as mobile as nitrate (NO3–).
Ammonia volatilization. At soil pH values higher than 7, the NH4+ ions can be converted to NH3 (ammonia gas) and lost to the atmosphere if the soil is dry. Losses can be as high as 50 percent of the nitrogen applied.
Immobilization of fertilizer NH4+ and NO3–. Contrary to common agronomic knowledge, much, if not most of the NH4+ and NO3– released by fertilizers is immobilized by microbes before it is taken up by crop roots. Much of this immobilized nitrogen is mineralized quickly because microbes have very fast turnover rates, and then it is taken up by the crop roots. But part of the immobilized nitrogen becomes soil organic matter (SOM) if there is sufficient available carbon as well.
Fluctuations of Inorganic Nitrogen
Inorganic nitrogen in most tropical areas shows marked seasonal fluctuations. The pattern consists of a slow nitrate build-up in the topsoil during the dry season, a large but short-term increase at the onset of the rainy season and a rapid decrease during the rest of the rainy season. When short-term droughts occur during the rainy season, they are followed by sharp but smaller increases in inorganic nitrogen, and then by gradual decreases.
These short-term peaks, called the “Birch effect,” may range from around 20 kg N/ha to more than 100 kg N/ha within 10 days after the onset of the rains. Active microbial populations build up rapidly when moisture becomes available and use the easily decomposable substrate, the dead microbial biomass that didn’t survive the dry season.
The Birch effect is a very important process that has been largely ignored in the tropics outside of Africa, and it helps explain many dynamics affecting mineralization and emissions of nitric oxide (NO) and nitrous oxide (N2O), in natural and agricultural systems. To take advantage of the short-lived Birch effect, plants need to have a sufficiently developed root system to start with or to be capable of developing one within the first month or so into the rainy season. The Birch effect is an important phenomenon in the nitrogen cycle only in ustic soil moisture regimes with isohyperthermic, hyperthermic, isothermic and thermic soil moisture regimes, which cover much of the tropics and some of the subtropics. It has recently been quantified in Mediterranean climates of the temperate region
Combining Mineral and Organic Nitrogen Fertilizers
The agronomic ideal is to synchronize the plant’s nutrient needs with the nutrient release from all inputs, which is difficult to do and is probably best done with a combination of mineral and organic fertilizers.
Eight classes of organic fertilizers are proposed, the first four are plant biomass and the rest manures and compost. All organic fertilizers contain the other 13 essential nutrients besides nitrogen, and their application often prevents the development of other nutrient deficiencies.
Combining does not necessarily mean mixing. One could apply organic fertilizers before planting and topdress with mineral nitrogen fertilizers.
When class 1 organic fertilizers are applied at the same time as nitrogen fertilizers, they may immobilize some of the nitrates dissolved from the mineral fertilizer, and then release them slowly, which may increase agronomic efficiency. Class 4 organic fertilizers immobilize mineral nitrogen but do not mineralize it fast enough to be synchronized with crop demand.
In a meta-analysis with smallholder farmers in Africa, crop yield responses were generally higher with the combined organic inputs plus nitrogen fertilizer applications.
The lower the nitrogen fertilizer rate, the larger the beneficial effect of combining it with organic biomass resources.
High-quality plant biomass fertilizers produce longer residual effects. This contradicts the common belief that the lower quality plant biomass fertilizers may have longer residual effects because of their slow rate of decomposition.
It is possible to generalize that the combined use of organic and mineral nutrient inputs often produces higher long-term yields than in either full organic or full inorganic systems.
We Are Underestimating the Actual Recovery of Nitrogen Fertilizers
Because of the immobilization of fertilizer nitrogen, together with leaching and denitrification losses, the recovery of applied fertilizers by the crop to which it was applied is generally about 30–50 percent. So, what happens to the rest?
A major study, sponsored by the International Atomic Energy Agency, found that 33 percent of the nitrogen from labeled fertilizer was recovered by the first crop, 42 percent was found immobilized in the SOM and 25 percent was lost by leaching or gaseous losses. In this case, fertilizer recovery is commonly stated at 33 percent. This is really an underestimate because the nitrogen immobilized in the SOM is not a loss, and will be mineralized and then taken by the crop. The only loss is the 25 percent indicated. The fertilizer industry and soil fertility researchers should take note of that.
In this most comprehensive experiment, in nine countries in the tropics and subtropics, around 40 percent of the fertilizer nitrogen applied was immobilized into active SOM and about half of it was released to four subsequent crops.
The residual effect of nitrogen fertilizers in terms of crop uptake stops at the second crop, which recovered less than 7 percent of the fertilizer applied. The main residual effect of nitrogen fertilizer is to replenish SOM pools.
Environmental Consequences
The main positive consequences of nitrogen fertilization are in maintaining or increasing soil organic carbon (SOC), and in converting excessive Nr into inert N2 via denitrification. The main negative ones are emissions of NO and N2O gases and leaching losses of nitrate.
Mineral fertilizers do increase SOC, provided that carbon is also added. Nitrogen fertilizers may not increase SOC if all residues are removed from the field and no organic fertilizers are added, or if the soil remains extremely deficient in another element, such as phosphorus. It takes twice the carbon inputs to build SOC in a sandy soil than in a loamy one, which is twice what it takes to do the job in a clayey one. The relative increase may be around 8–17 percent, but is much higher (37 percent) when cattle manures are used. The reason for the superiority of cattle manures is not clear, except for the fact that they add lots of carbon.
Denitrification is the microbial reduction of NO3– to N2, which includes the production of NO and N2O as intermediate products. Both NO and N2O can be emitted as intermediate products of both nitrification and denitrification.
Denitrification of NO3– can happen simultaneously with nitrification in nearby microsites, where one is under anaerobic conditions while an adjacent microsite is well aerated.
In waterlogged soils with more than 75 percent water-filled pore space, with a low redox potential, denitrification proceeds to the N2 state, posing no environmental damage and simply returning the inert nitrogen back to the atmosphere where it came from.
N2O is a very potent greenhouse gas, with agriculture accounting for over 70 percent of the global N2O emissions. It is produced when denitrification takes place in less aerated but not totally waterlogged sites, at about 60–75 percent of water-filled pore space. The highest rates of N2O production occur when nitrogen availability to bacteria exceeds carbon availability; therefore, the main sources of N2O are inorganic fertilizers, animal manures and human sewage. About 1.7–2.7 percent of nitrogen fertilizer and cattle manures become N2O.
N2O emissions are high in udic soil moisture regimes and lowest in the ustic, semiarid Sahel; they are highest in irrigated Aridisols of Mexico. N2O emissions are much lower in Oxisols than in permanent-charge soils.
The best ways to reduce N2O emissions are to (1) use the more conservative nitrogen application rates using the LRP model, (2) manage the timing of nitrogen application and, if possible, (3) manage the timing of irrigation in ways that avoid excessive NO and N2O production. The same applies to decrease nitrate leaching losses in rainfed agriculture, except for item (3).
Efficiency of Nitrogen Fertilization
The simplest evaluation of fertilizer nitrogen efficiency is nitrogen use efficiency (NUE), which is the ratio of yield over fertilizer applied. NUE values can be misleading because the ratio of yield to nitrogen does not tell us about the actual quantities of nitrogen and yield we are dealing with. It is not recommended as a useful metric.
The agronomic efficiency of nitrogen (AEN) differs from NUE because the AEN gives only the additional grain produced by the nitrogen fertilizer over the nitrogen rate applied. It is the best metric for estimating fertilizer use efficiency.
AEN values for cereals globally average 37 kg grain/kg N applied, while in Malawi, which uses one subsidized blanket fertilizer recommendation for the whole country, the estimate is about 14 kg grain/kg N. AEN values of about 50 have been obtained in researcher‐led smallholder trials in Africa with maize hybrids and organic inputs.
Infields in small farms (those close to the homestead) had values (AEN = 31) almost double those of outfields (AEN = 17). Infields receive more organic waste and ash and are responsive soils, while outfields resemble the less responsive soils to fertilizer applications.
What is becoming clear is that nitrogen fertilizer has no chance of being agronomically efficient unless hybrids or improved varieties are used, and in many instances organic inputs need to be added. With such management, AEN values in smallholder tropical situations can approximate those obtained in large-scale mechanized farming in North America and Europe.
Nitrogen fertilizer recovery values, a third metric, are reported to range from 50 percent to 90 percent by cereals in developed countries and from 20 percent to 70 percent in the tropics. In both regions there is little to no residual effect.
But is the unrecovered fertilizer really lost? As mentioned before, but worth repeating, the answer is obviously not, because much of it is immobilized into SOM. Only a portion of the applied nitrogen fertilizer is really lost by the two main mechanisms we know: leaching to groundwaters and gas emissions related to denitrification.
Profitability
Although nitrogen fertilizers are expensive, they are very profitable when applied at rates indicated by the LRP model at the right planting date and with the right agronomic practices. Profitability is often indicated by value:cost ratios higher than 2.
The timing of grain selling is critical in Africa. Crop prices at harvest time are low and increase rapidly, peaking at 45–100 percent higher 6–9 months later.
Fertilizer prices have been very volatile in inland Africa, but are usually accompanied by sharp increases in maize prices, maintaining, in most cases, value:cost ratios.
Many people claim that smallholder farmers cannot afford fertilizers. What they mean is that they cannot afford to buy fertilizers with cash. Neither do farmers in richer countries.