


Introduction
There are hundreds of different cell types within the brain, all expressing genes at unique, well-controlled levels in order to achieve their diverse biological functions [Reference Lein1–Reference Moffitt3]. Groups of cells and cell types that work together to execute larger goals make up a neural circuit. These neurons communicate with one another via neurotransmitters, which are expelled by one neuron and sensed when they bind to receptors on neighboring cells. Neurotransmitters binding to receptors trigger reactions such as a change in the cell's physiology or the propagation of the signal to additional cells in the circuit. Neurotransmitter receptors come in many shapes and sizes based on functionality and are expressed by neurons at varying levels. For example, nonsensory G-protein coupled receptors (GPCRs), gatekeepers of our most fundamental physiological processes, are ironically expressed at very low levels, making them difficult to study experimentally despite their functional relevance [Reference Richmond4].
With such intricate spatial organization defined by difficult-to-study gene expression, there is still much to learn about the brain. Scientists still don't fully understand the fundamentals of neuronal positioning, neuronal circuits, or how neuronal phenotypes contribute to brain function. This is, in part, thanks to the brain's incredibly complex architecture and position in the body. The delicate cells can be studied in high resolution under a microscope, and single cells can be cataloged through single-cell sequencing; however, the spatial organization of the organ is lost in these experiments. Imaging under a microscope preserves spatial context, but due to the limited plexing level of traditional imaging technoigies, it is often impossible to characterize hundreds or thousands of biomarkers at the same time.
How does the wildly complicated structure of the brain develop? How does the brain change as we age at a cellular level? What cell circuits are responsible for our senses, our emotions, our instincts? How do neurodegenerative diseases progress? Are specific cell types and regions responsible, and can the progression be reversed by drug treatment?
Due to the brain's mind-boggling complexity, we need detailed reference maps, “cell atlases,” to form answers to these questions through high-resolution, spatially resolved genomic, transcriptomic, proteomic, and metabolomic data. Only then can we understand the roles individual cells play in a healthy brain—and how disease or injury disrupts the status quo.
What It Takes to Create a Cell Atlas
Cell atlases result from a collective scientific effort that involves collecting multiomic data spanning transcriptomics, proteomics, metabolomics, and metabolic flux [5,6,7]. High-throughput genomics projects, particularly those that characterize cells based on their gene expression profiles, have contributed large volumes of invaluable data to that global effort. However, a longstanding trade-off is that most methods can offer some combination of single-cell resolution, high detection efficiency, or spatial context—but not all three qualities at once.
A recent dataset called the MERFISH Mouse Brain Receptor Map was generated on Vizgen's new MERFISH (multiplex error-robust fluorescence in situ hybridization) end-to-end platform solution, MERSCOPETM [8]. The data suggest that spatial genomics researchers may not have to compromise on resolution or detection efficiency anymore.
Several elements of the MERFISH method make its unprecedented scope and sensitivity possible. In a MERFISH experiment, whole tissue sections are exposed to an RNA panel representing probes for hundreds to thousands of genes. The method employs multiple fluorescent probes for each RNA species to ensure sensitivity, allowing it to reliably detect RNA species, even those that are expressed at low levels in a tissue. And to achieve extremely high multiplexing capacity, combinatorial, error-robust barcoding is used to detect hundreds to thousands of RNA species at a time. The fluorescently labeled cells are imaged and the data analyzed to create spatial genomics data at unparalleled, nanometer-scale spatial resolution. Each experiment provides extremely rich spatial transcriptomic information and, depending on the RNA panel being used, can be completed in as little as one day on the MERSCOPE instrument.
Unlocking Knowledge with a Massive Dataset
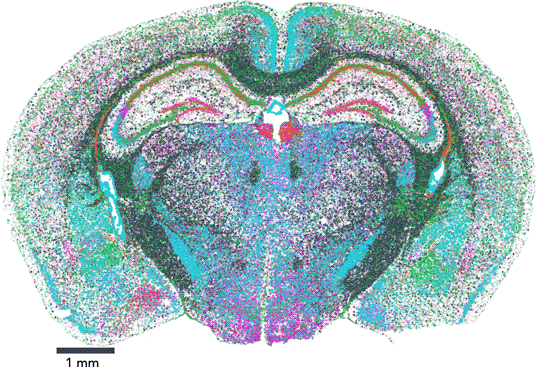
The map encompasses three full coronal slices (and three biological replicates per slice). It contains the exact positions of 554,802,908 RNA transcripts from 483 genes within 734,696 cells. And not only does the dataset provide information about gene expression, it also provides the exact position of each detected transcript within the sample, along with high, 100 nm-resolution images of the nucleus, total mRNA stains, and single-cell segmentation results (Figure 1).
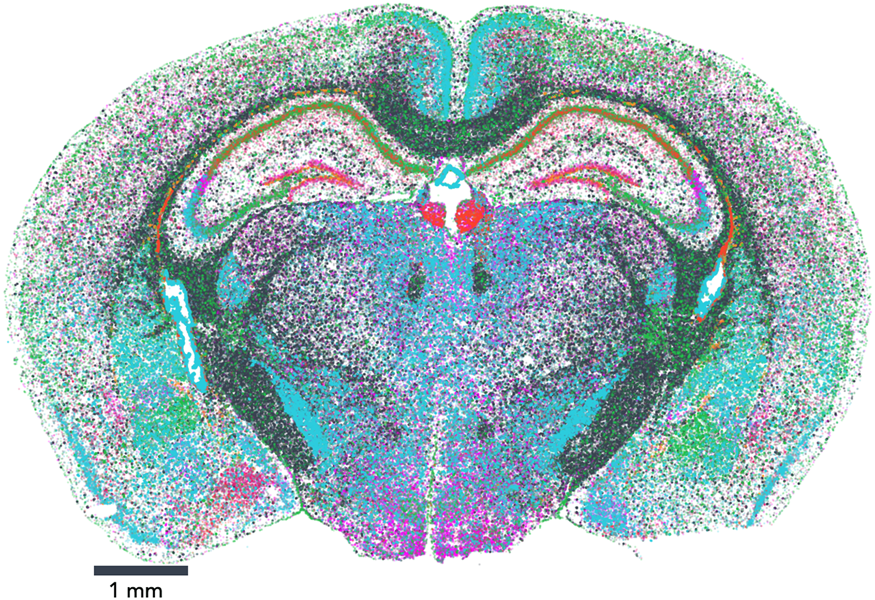
Figure 1: Vizgen's MERFISH Mouse Brain Receptor Map was generated using a gene panel of 483 genes. It identifies 734,696 cells and pinpoints the precise location of 554,802,908 RNA transcripts. Together, the map offers an unprecedented look into the molecular basis of the murine brain.
Vizgen's MERFISH Mouse Brain Receptor Map is the largest dataset of single-cell spatial transcriptomics available to the public to date and is free for researchers who wish to explore new ways to analyze extremely high-volume data and to gain a direct window into the cellular, subcellular, and functional organization of an intact brain and beyond. This dataset allows direct visualization of the expression profile of hundreds of genes across the entire brain slice and also within individual cells, down to subcellular resolution of approximately 100 nm. It also enables traditional single-cell analysis researchers to surpass standard lower-resolution techniques to characterize and map individual cells based on each cell's gene expression profile. In addition to capturing information about highly expressed genes that provide a reference, MERFISH's high sensitivity and detection efficiency enabled a major victory: the dataset captures information about hundreds of genes, such as nonsensory g-protein coupled receptors (GPCRs), that are expressed at such low levels within the tissue that they had been previously difficult to characterize (Figure 2). Notably, the Mouse Brain Receptor Map contains a gold mine of data on medically relevant species such as the OXTR (oxytocin receptor) [Reference Quintana9], TSHR (thyroid stimulating hormone receptor) [Reference Crisanti10], and INSR (insulin receptor) [Reference Jin11]. With its wealth of phenotypic data in a spatial context, the dataset is charged with insight into how these rare species accomplish their roles within the body.

Figure 2: MERFISH high detection efficiency and resolution. The images represent a comparison between a MERFISH measurement on a MERSCOPE instrument and a measurement from an oligo array capture-based technology in the left column, highlighting the expression of opioid receptor delta 1 (OPRD1) in the right column. MERSCOPE consistently detects ~70-fold more copies of each transcript.
Bringing GPCRs out of the Shadows
GPCRs make up the largest family of transmembrane signaling molecules—about 1% of the human genome—and help regulate virtually all physiological processes in our bodies [Reference Richmond4,Reference Regard12]. They are estimated to be the targets of approximately 34 percent of all FDA-approved drugs on the market [Reference Degrandmaison13]. GPCRs have incredible relevance to human health, but several roadblocks make in vivo molecular analysis difficult. Namely, they tend to be expressed in very low levels in cells, there is a lack of antibodies to detect them, and they have conserved structural properties not amenable to experimentation. However, it is known that GPCRs come in two flavors: sensory and nonsensory. Sensory GPCRs receive input from the external environment. On the other hand, there are an estimated 370 species of nonsensory GPCRs, all expressed in the brain. Ninety percent of these are involved in development, neuronal excitability, immune function, homeostasis, behavior, reproduction, and metabolism.
The breadth of nonsensory GPCR jurisdiction implicates these receptors in regulation of numerous complex traits: states of health and disease resulting from a combination of genetic factors and the environment [Reference Yong14]. In health, one major role that GPCRs play is in regulating metabolic activity, including insulin secretion, glucose homeostasis, appetite, sleep, calcium-sensing, heart rate, and blood pressure [Reference Tzameli15]. But when these processes go awry, GPCRs are implicated in complicated, difficult-to-treat diseases such as Type 2 diabetes, insomnia, heart disease, and numerous chronic illnesses.
Having a cell atlas to better understand the expression of specific GPCRs, neurons, and neural circuits that are responsible for these traits is instrumental to our understanding of how and why they malfunction to cause disease. Furthermore, a deeper cellular and molecular understanding of the pharmacologically relevant GPCR species will help direct a new generation of more potent, better-targeted drugs in each of these areas.
In addition to their role in regulating metabolism and other physiological processes, recent studies have found a prominent role for GPCRs in the aging brain and neurodegeneration in Alzheimer's and Parkinson's diseases, redoubling the need to find ways to study the underlying mechanisms of each [Reference Azam16]. Many scientists hypothesize that GPCR signaling over long periods slowly diminishes neuronal integrity and drives the progression of these neurodegenerative disorders. Insight drawn from the MERFISH Mouse Receptor Map may provide a springboard, revealing specific cell types and signaling receptors that may be involved in this process, narrowing down candidates for further study.
Conclusion
Now that scientists have access to a MERFISH-generated cell atlas of the brain, how might they use it to advance their research? Labs could already uncover a great deal of information about specific proteins, cells, or signaling pathways; however, by decoding the MERFISH Mouse Receptor Map, a lab can integrate all of its research and existing knowledge into greater context to reach unprecedented levels of insight. As these experts learn more about their areas of focus, they may uncover new cellular pathways to investigate, as well as new proteins and cell types to zero in on. Grounded in shared reference materials like the MERFISH Mouse Receptor Map, studies about development, health, and disease will become more harmonized.


